El Salvador PowerPoint Maps Template: Visualize Central American Potential


Type: PowerPoint Maps template
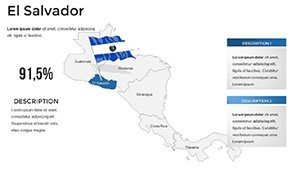
Category: Central America
Sources Available: .pptx
Product ID: PM00187
Template incl.: 36 editable slides
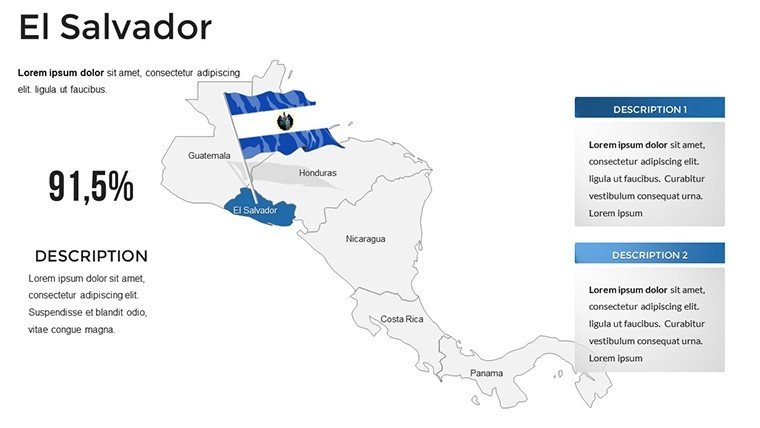
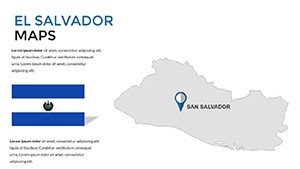
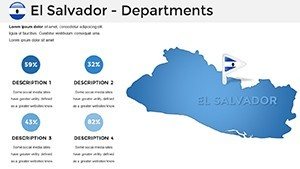
Delve into the vibrant heart of Central America with a template that turns geographic data into compelling tales. Featuring 36 editable slides, our El Salvador PowerPoint Maps Template is crafted for innovators mapping volcanic terrains, bustling markets, or cultural festivals. Suited for entrepreneurs eyeing fintech hubs in San Salvador, educators detailing Pupusa heritage, or researchers tracking biodiversity in cloud forests, it brings clarity to complexity. Highlight trends like the 2024 Bitcoin adoption surge, as per Central Bank reports, with intuitive visuals that engage and inform.
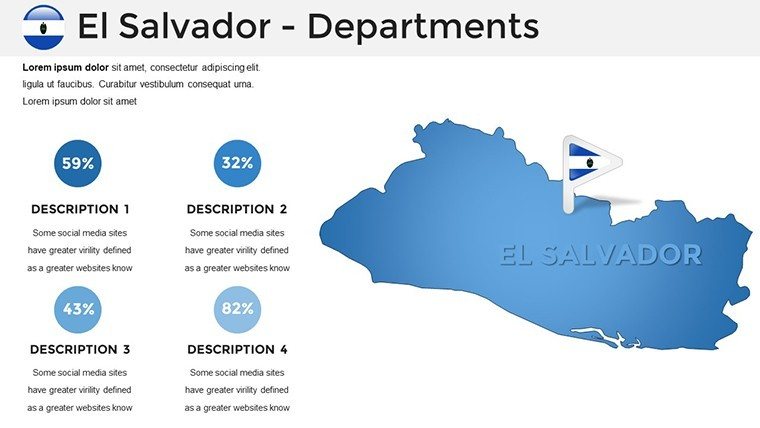
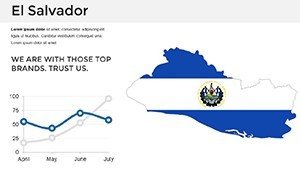
At its essence, the template offers interactive charts and customization galore - tweak colors to mirror Pacific sunsets, insert graphs for economic indicators, and adapt layouts for your unique angle. Supporting PowerPoint (.pptx) and Google Slides, it facilitates effortless updates, bypassing the grind of custom mapping.
Discovering the Depth in Salvadoran Mapping
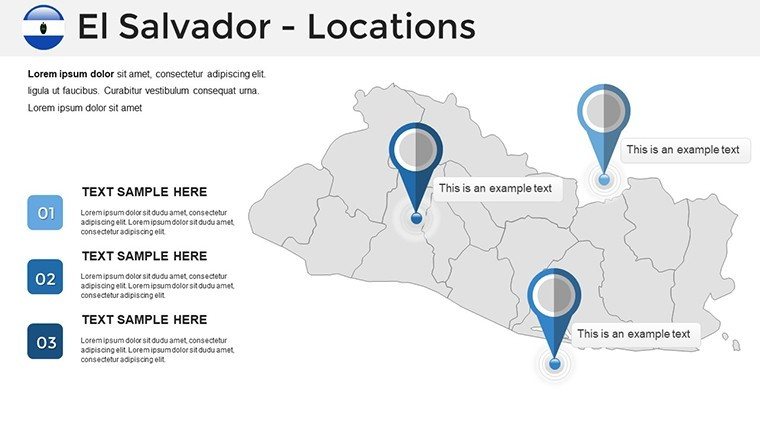
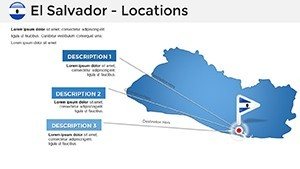
Anchored in high-fidelity representations, this template mirrors standards from institutions like the Salvadoran Geographic Institute, providing dependable foundations. Imagine a travel consultant plotting eco-tours around Joya de Cerén, the "Pompeii of the Americas," using embedded animations for dynamic reveals.
Key Attributes for Persuasive Visuals
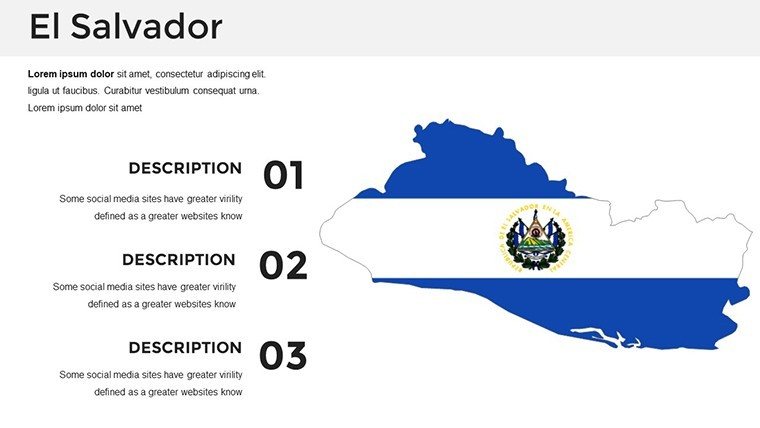
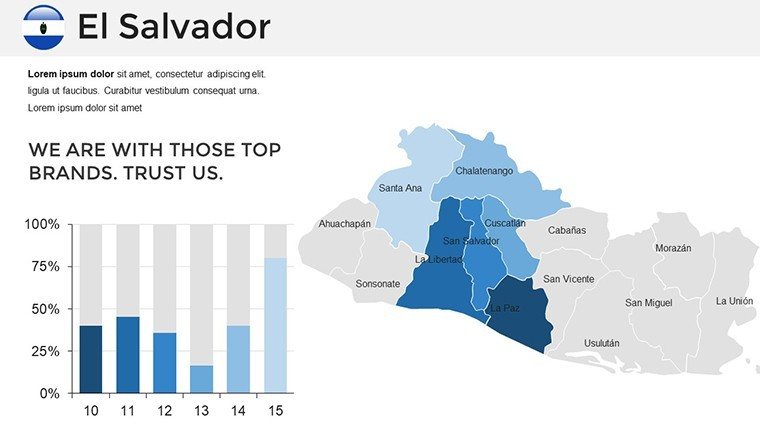
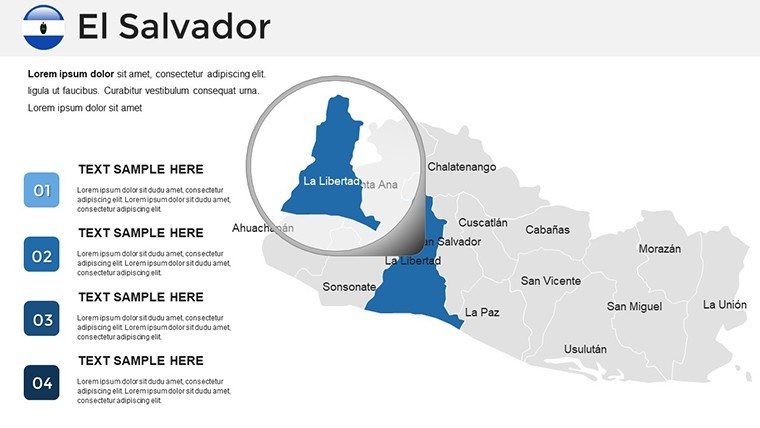
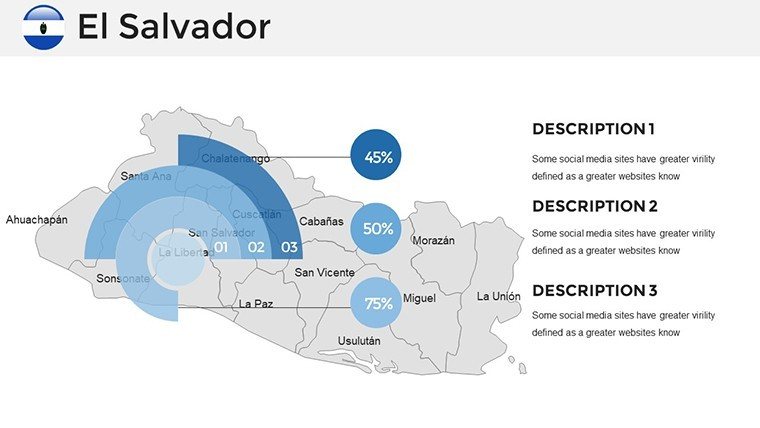
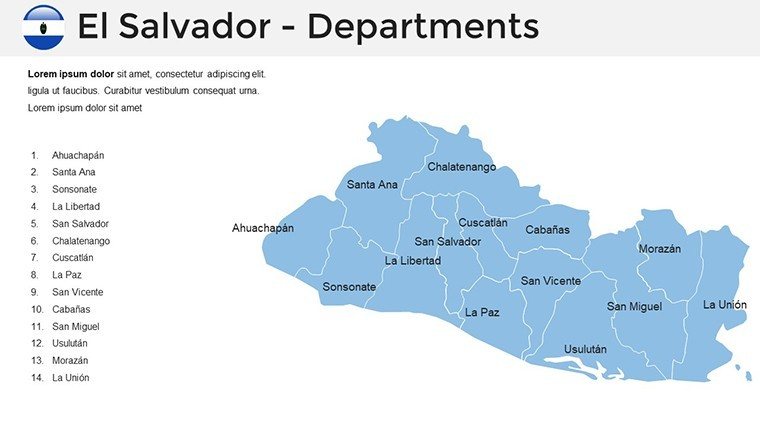
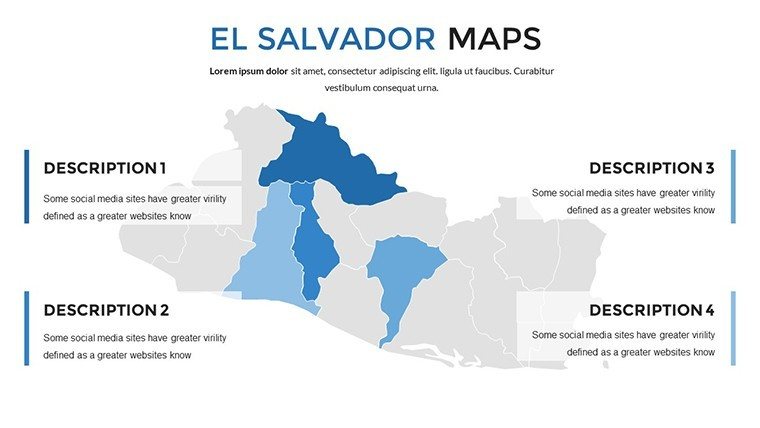
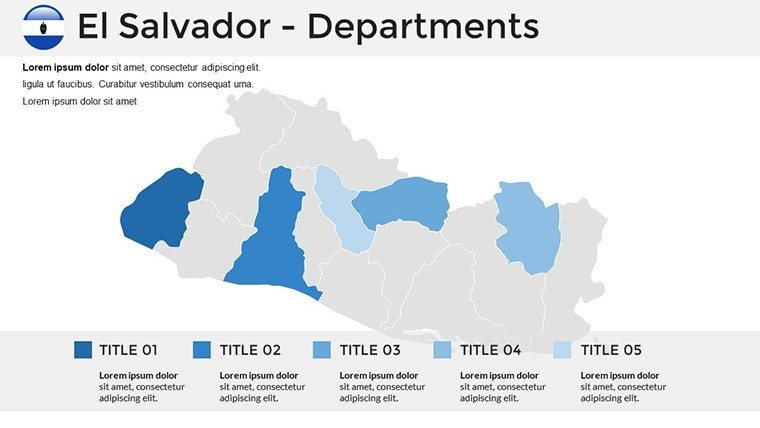
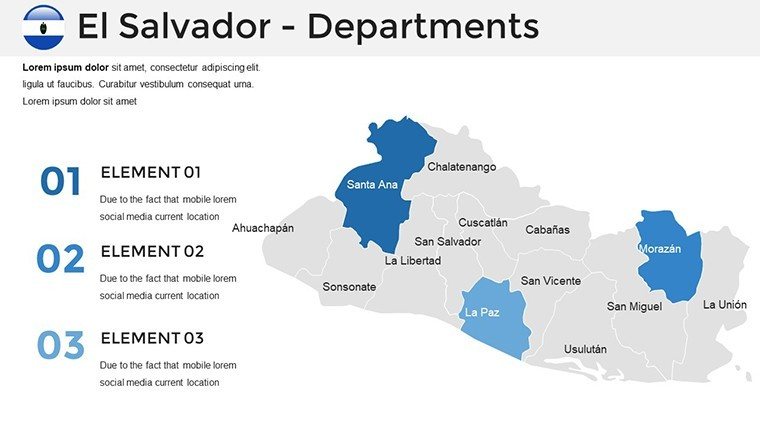
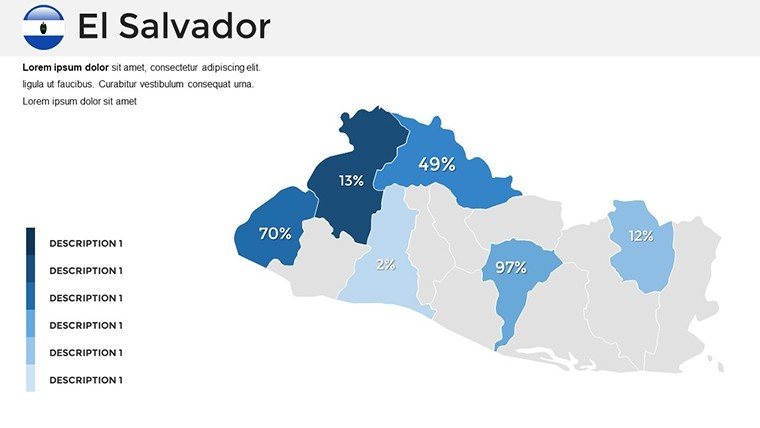
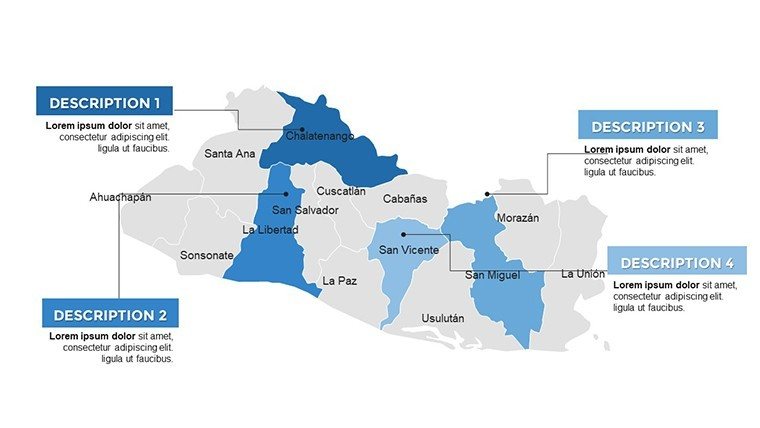
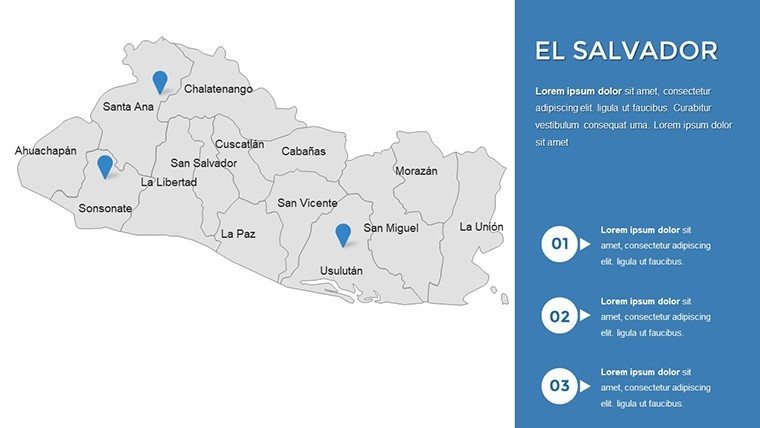
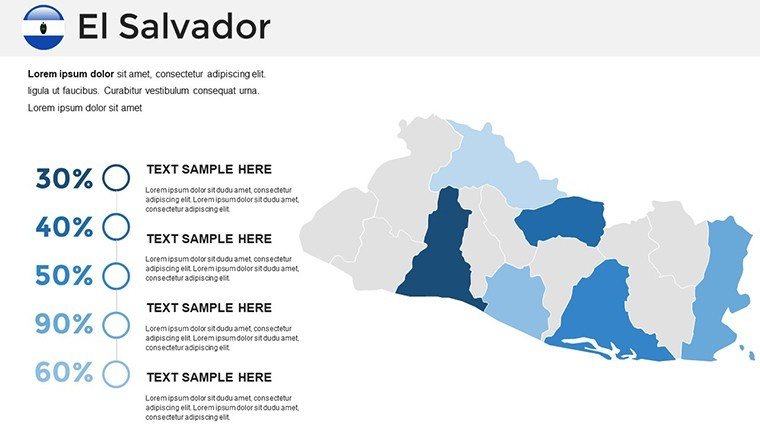
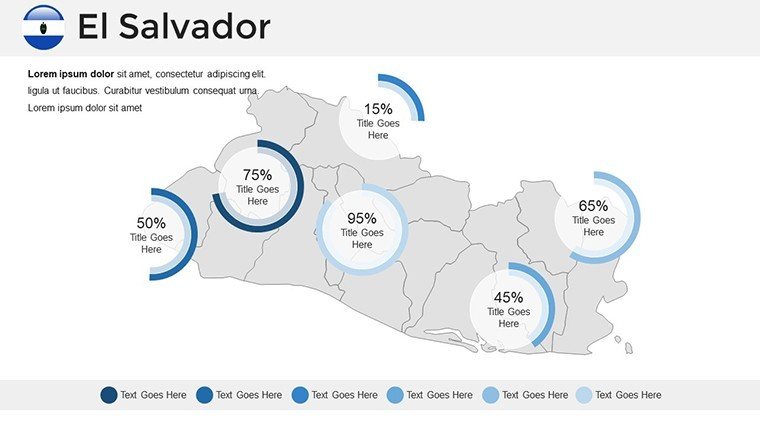
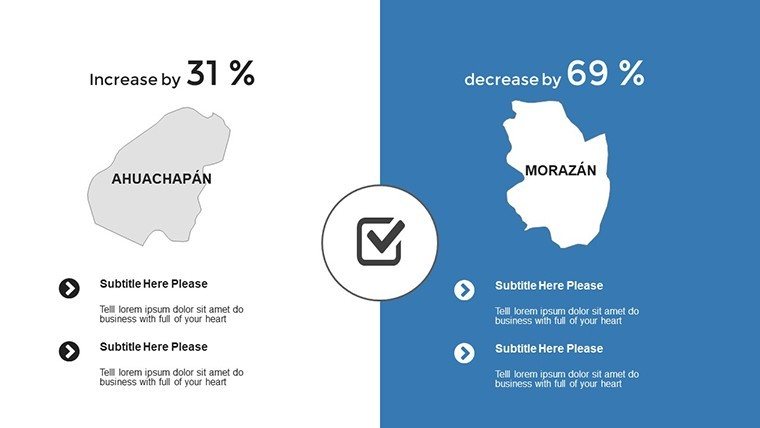
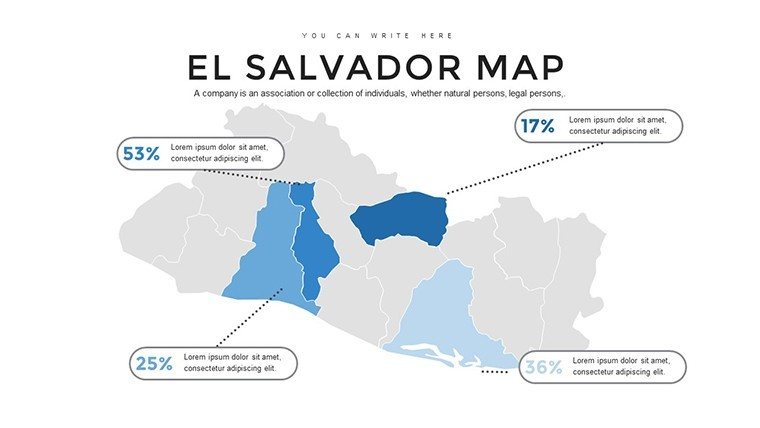
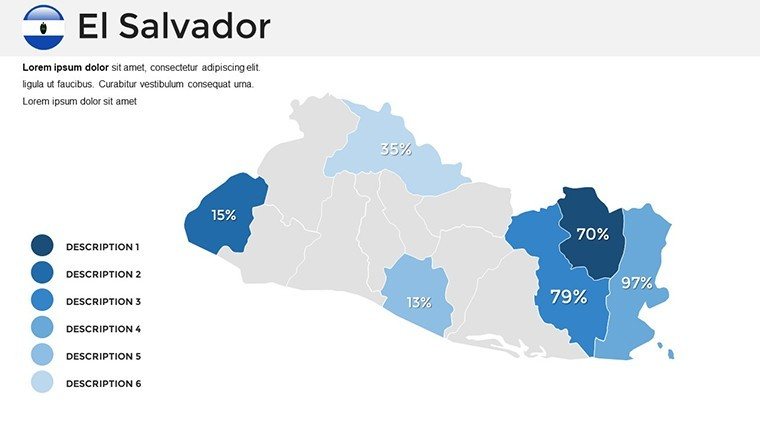
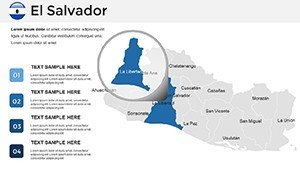
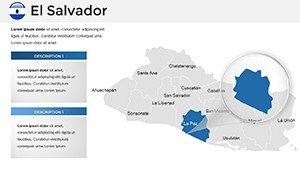
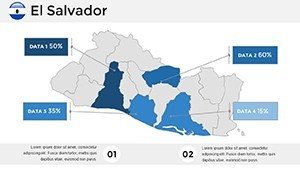
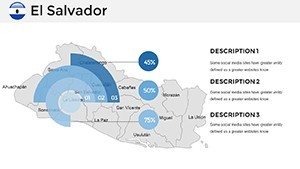
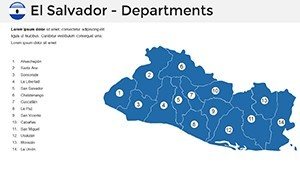
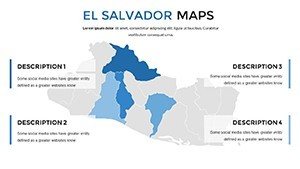
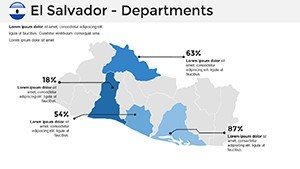
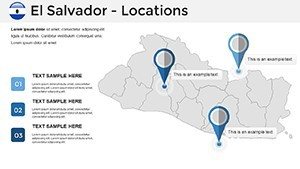
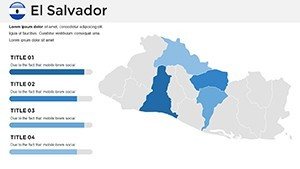
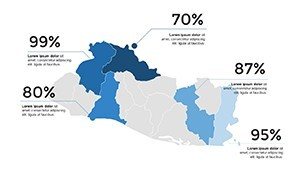
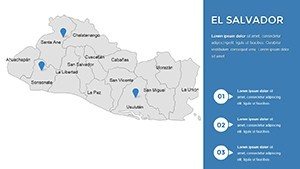
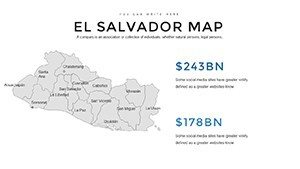
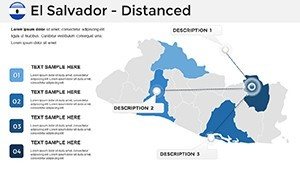
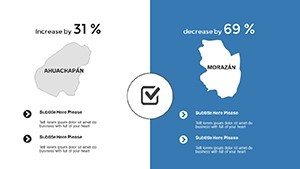
- Rich Map Assortment: Covering departments from Ahuachapán to Usulután, with urban zooms on key cities.
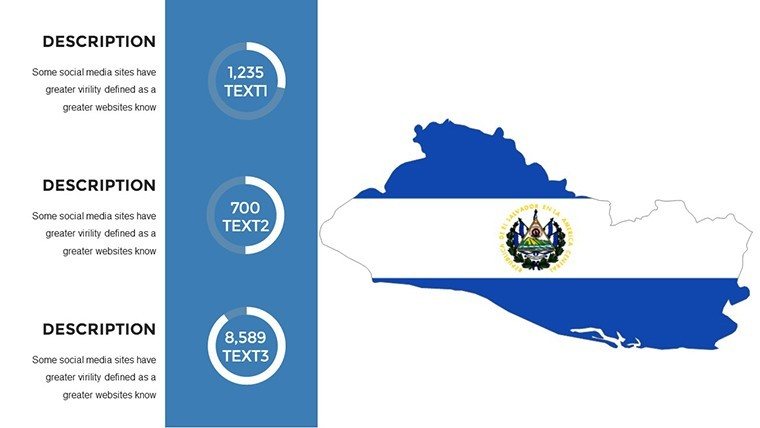
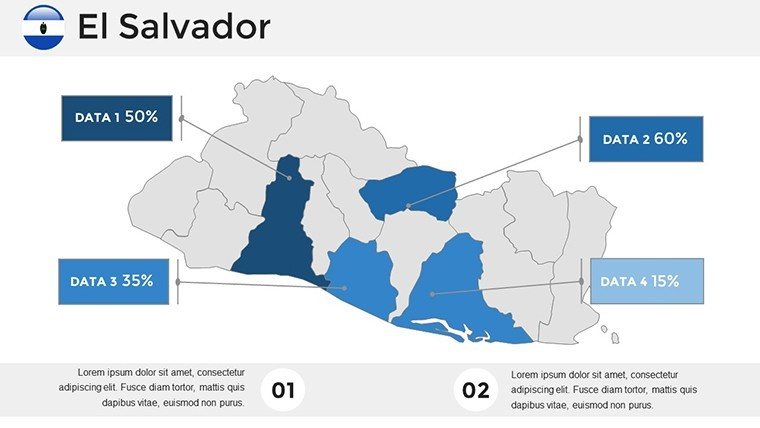
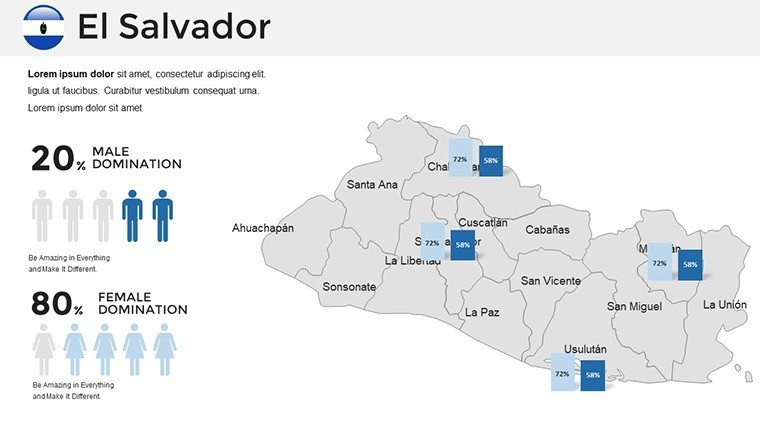
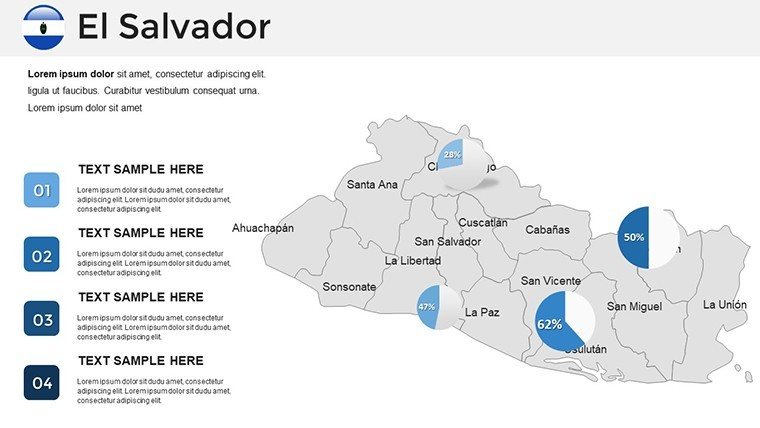
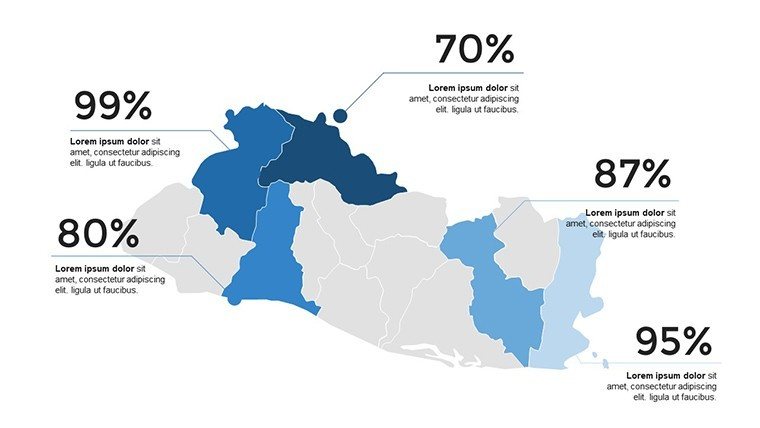
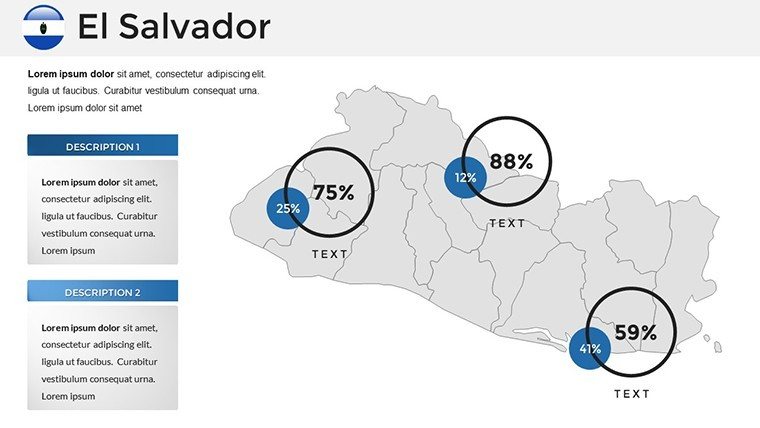
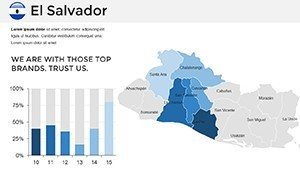
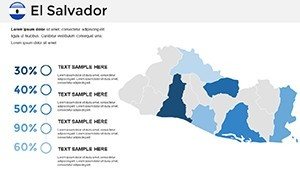
- Interactive Graphing: Build charts for metrics like remittance flows, vital to El Salvador's economy.
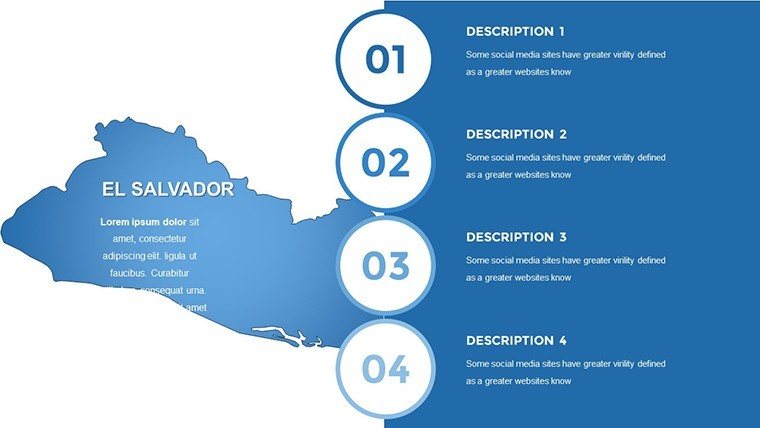
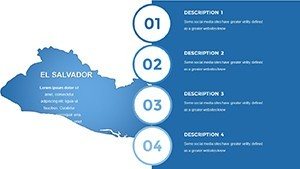
- Adaptable Design: Change fonts, shades, and structures to align with vibrant cultural motifs.
- Superior Resolution: Pixel-perfect for digital shares or printed handouts.
- Beginner-Friendly UI: Intuitive for all skill levels, with quick-start placeholders.
- Animation-Ready: Add transitions to unveil data progressively, enhancing storytelling.
These components alleviate the burden of data visualization, delivering tools that foster understanding and retention.
Applied Contexts: Charting El Salvador's Stories
This template thrives in hands-on applications. A fintech startup could map adoption rates of digital currencies, citing World Bank inclusion data, while an environmentalist illustrates conservation efforts in Montecristo Cloud Forest.
- Business Investor Pitches: Depict opportunity zones in free trade areas, emphasizing export growth.
- Classroom Dynamics: Animate historical events like the 1932 peasant uprising for immersive learning.
- Research Symposiums: Graph seismic patterns from the country's volcanic arc, supported by USGS insights.
- Travel Planning Sessions: Outline routes through surfing beaches and coffee plantations.
Surpassing rudimentary options, it incorporates interactive elements and user interfaces, trimming hours off prep while amplifying professionalism - like a dedicated cartographer in your toolkit.
Insights for Optimal Map Deployment
Initiate with core objectives: Use departmental maps for regional breakdowns, city views for localized focus. Infuse animations sparingly to spotlight key facts, like economic spikes. Reference authoritative sources, such as the Ministry of Economy, for bolstered credibility. Preview across platforms for consistency, and inject subtle wit, perhaps quipping on how maps make volcanoes 'erupt' with data.
Adopt methodologies from geographic experts to exude trustworthiness, turning your slides into authoritative references.
Craft Enduring Visions of Salvadoran Innovation
To conclude, these maps serve as conduits for El Salvador's dynamic spirit, enabling you to present with precision and passion. From fiscal forecasts to cultural showcases, they empower your voice.
Ignite your creative spark - acquire this template and propel your presentations to new heights.
Frequently Asked Questions (FAQ)
How interactive are the charts?
Highly - build and customize graphs with ease for dynamic data display.
Compatible with Google Slides?
Yes, fully supports both PowerPoint and Google Slides environments.
What regions does it cover?
All 14 departments of El Salvador, with detailed urban and rural mappings.
Suitable for beginners?
Definitely, with a user-friendly interface and intuitive tools.
Can I animate the maps?
Yes, add transitions and effects to enhance engagement.