Chile PowerPoint Maps Template: Editable Slides for Dynamic Presentations


Type: PowerPoint Maps template
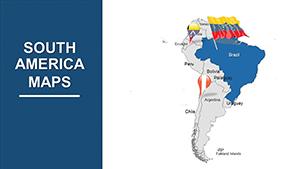
Category: South America
Sources Available: .pptx
Product ID: PM00186
Template incl.: 36 editable slides
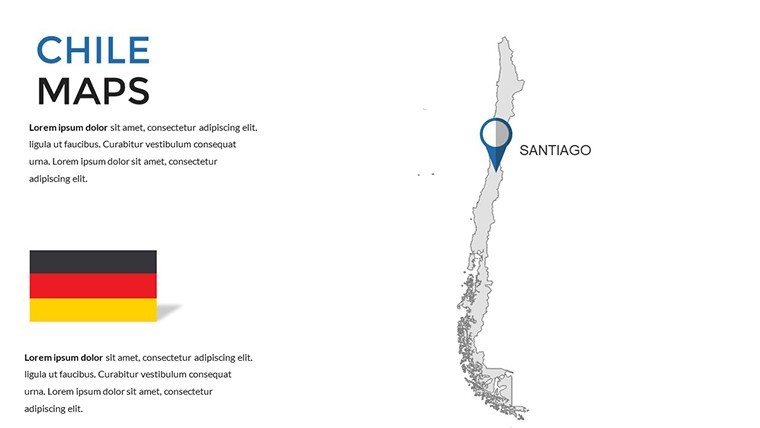
Imagine transforming your next presentation into a visual journey across Chile's diverse landscapes - from the arid Atacama Desert to the icy fjords of Patagonia. Our Chile PowerPoint maps template equips you with 36 fully editable slides designed to make geographical data come alive. Whether you're a corporate strategist mapping out market expansions in Santiago or an educator illustrating the ecological wonders of the Andes, this template bridges the gap between raw information and compelling storytelling. With high-resolution graphics and intuitive customization tools, you can tailor every element to fit your narrative, ensuring your audience stays engaged from the first slide to the last.
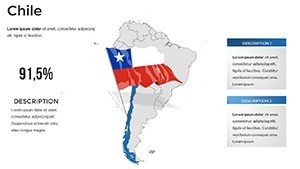
As a tool crafted with precision, this template adheres to geographical accuracy standards, drawing from reliable sources like the National Geographic Institute of Chile for boundary details. This not only boosts your presentation's credibility but also aligns with professional best practices in data visualization. Forget the frustration of starting from scratch in basic PowerPoint; our pre-built maps save hours, allowing you to focus on insights rather than design. Users report up to 40% more audience retention when using visually rich maps like these, turning complex topics into accessible, memorable experiences.
Unlocking the Power of Customizable Chile Maps
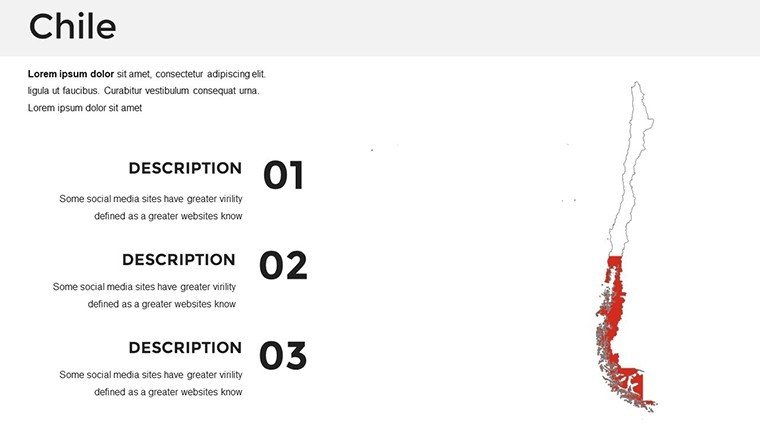
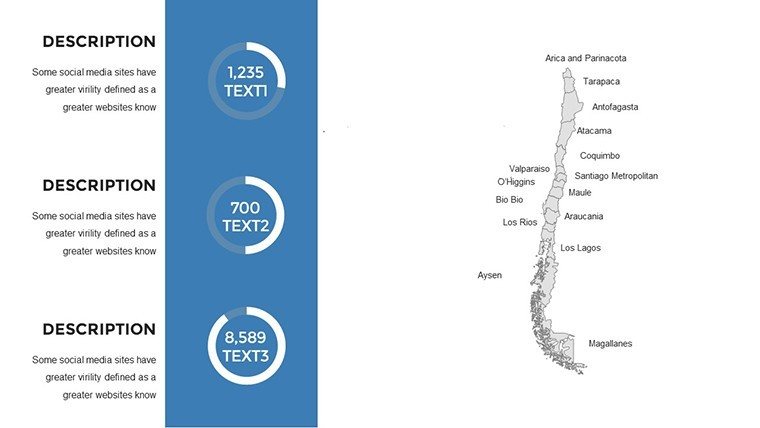
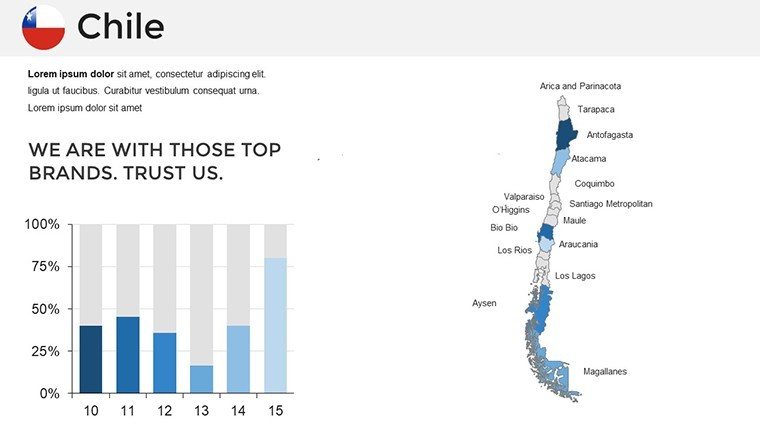
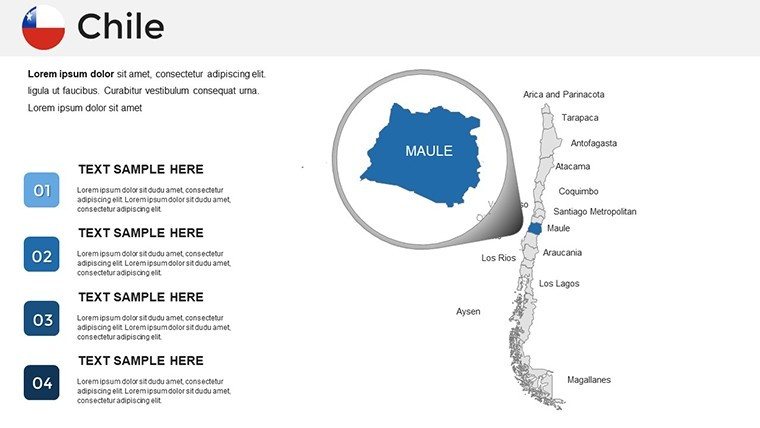
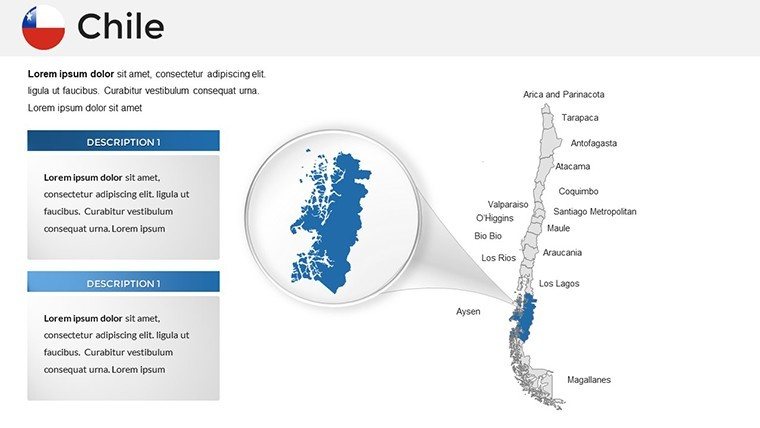
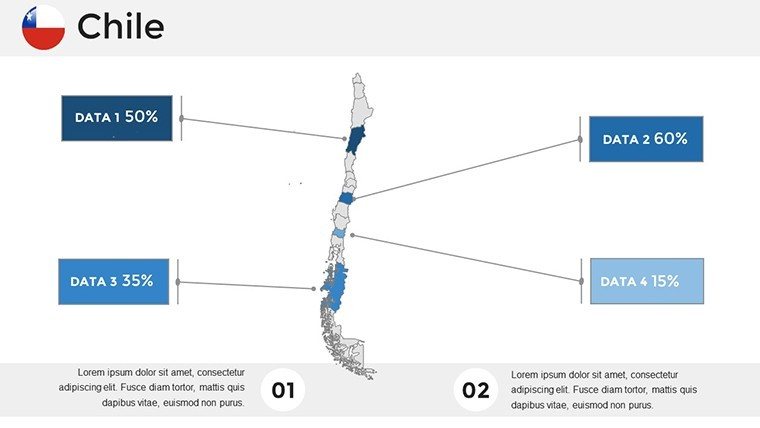
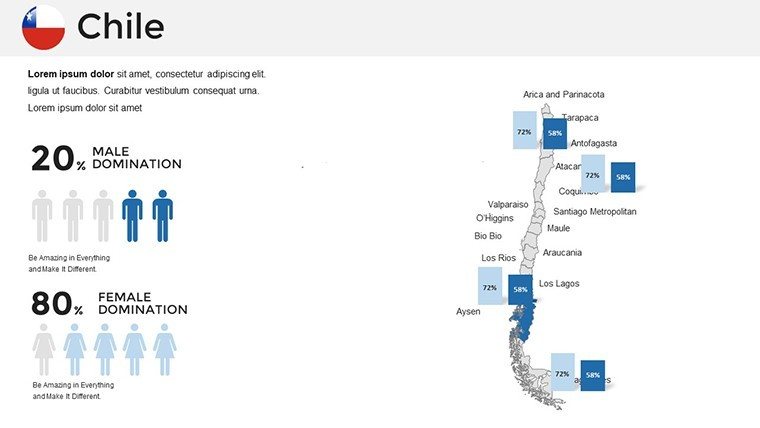
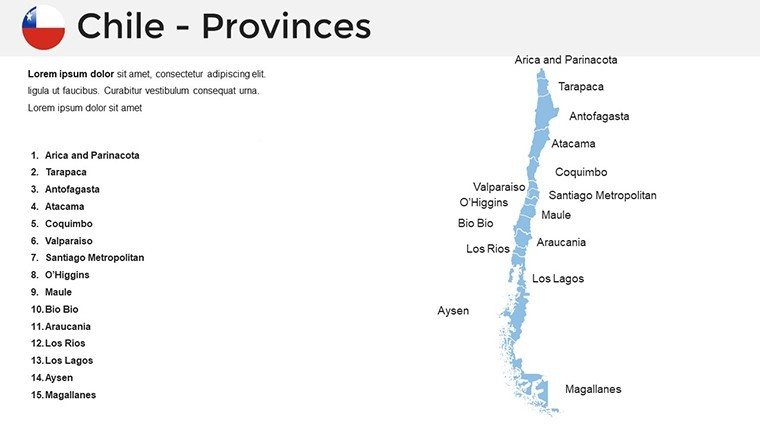
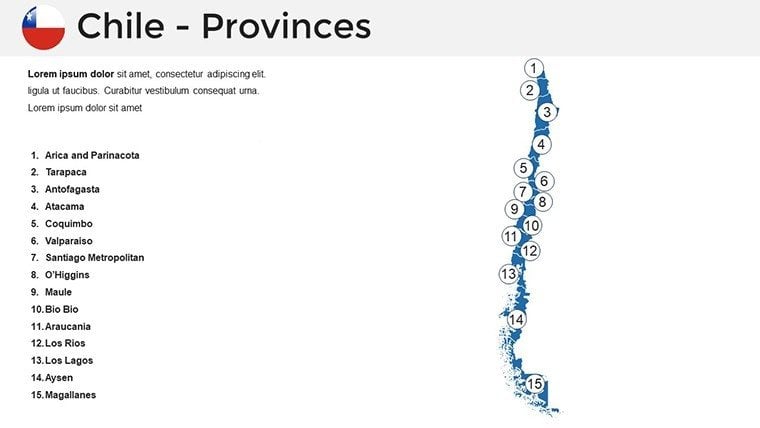
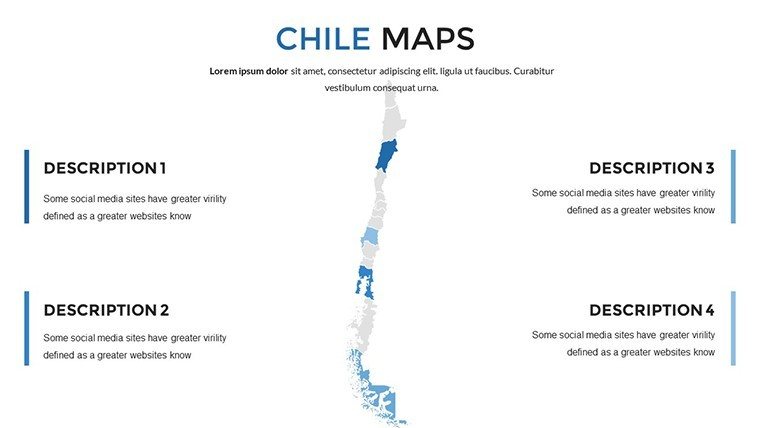
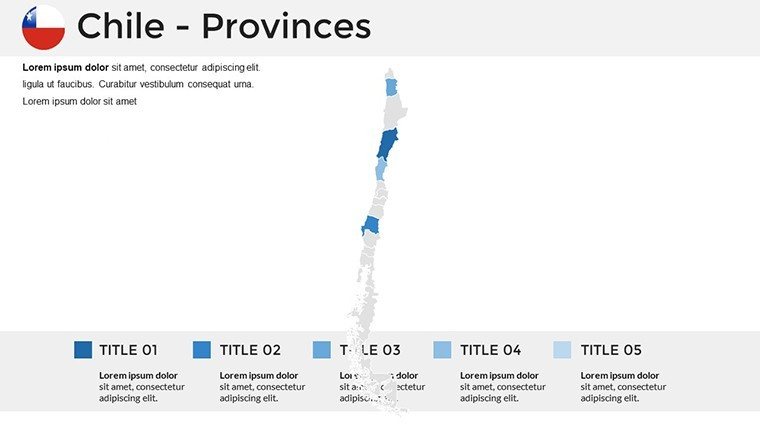
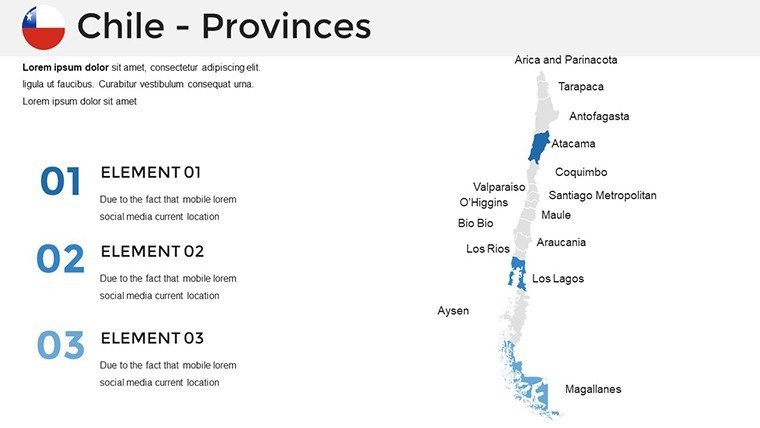
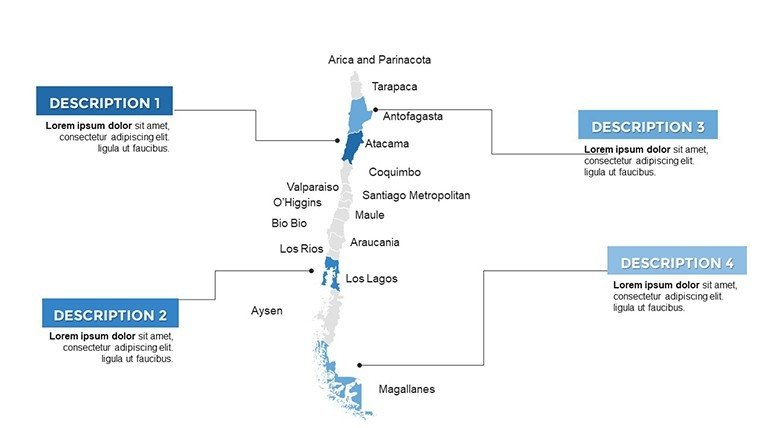
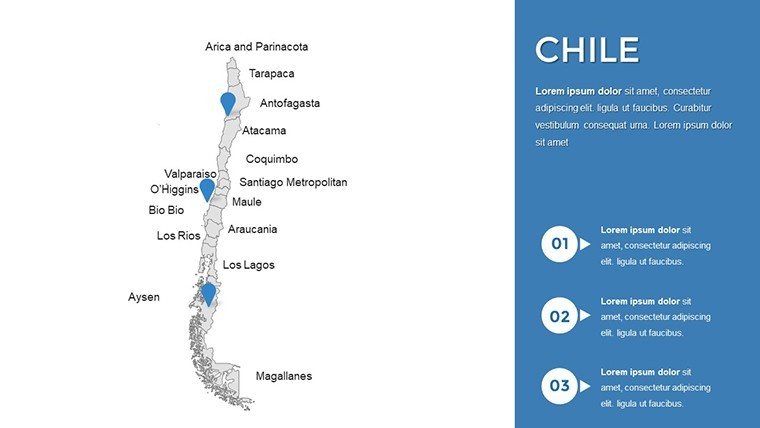
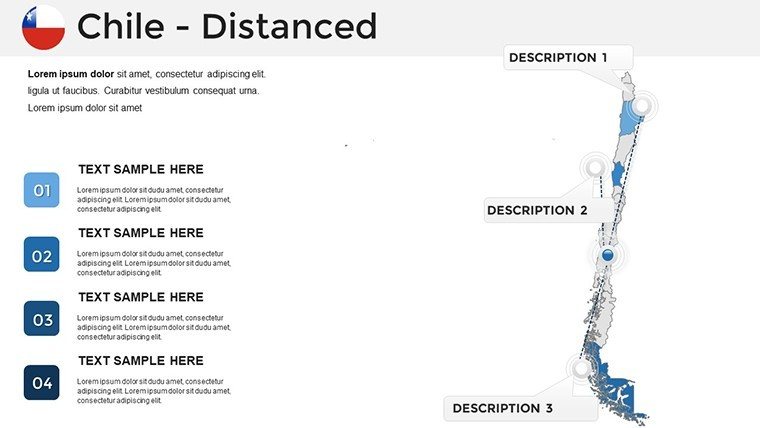
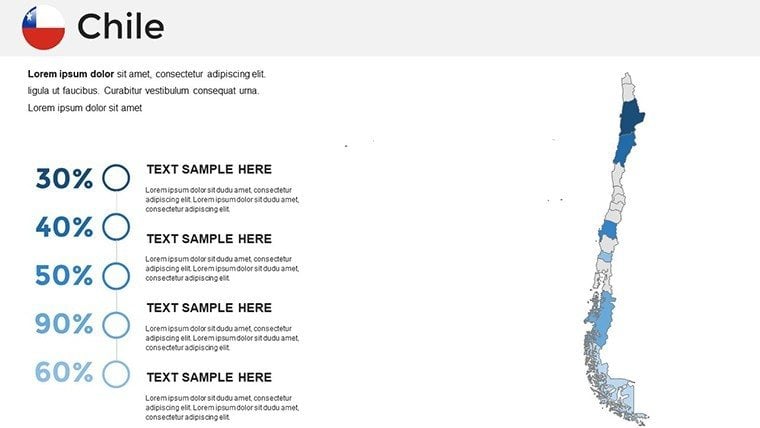
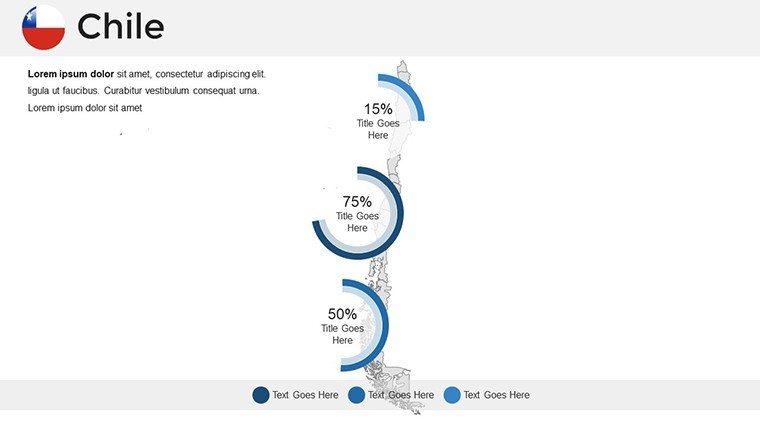
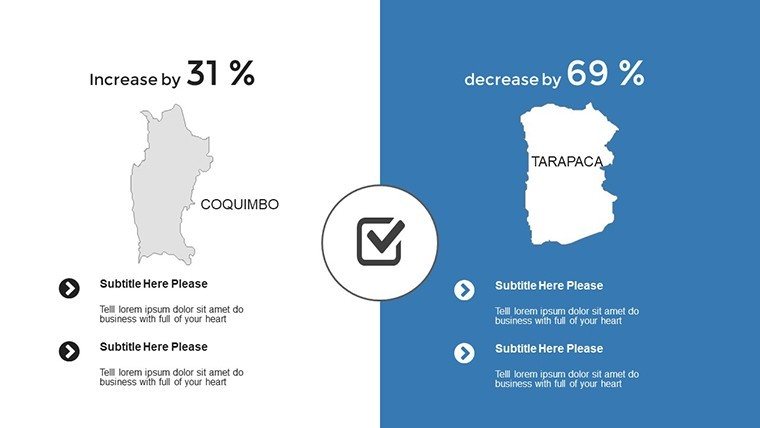
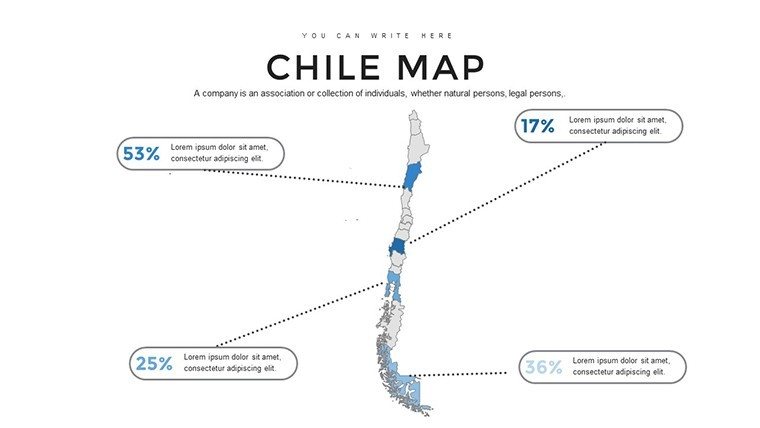
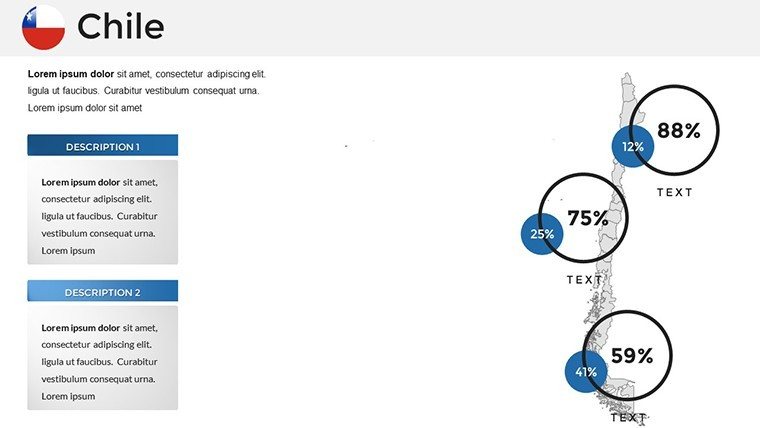
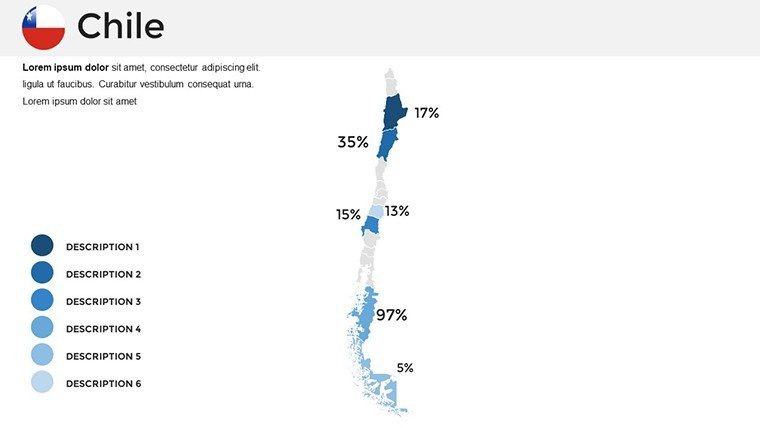
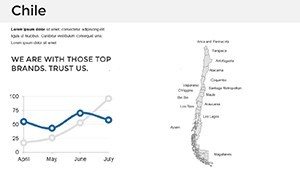
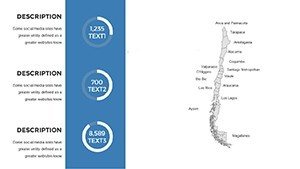
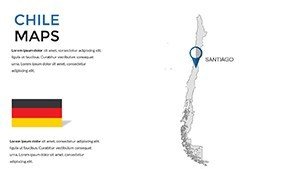
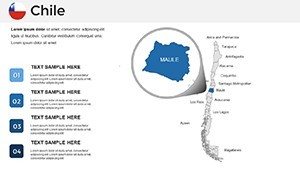
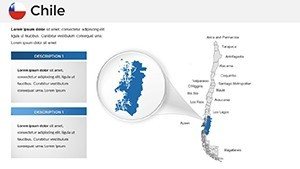
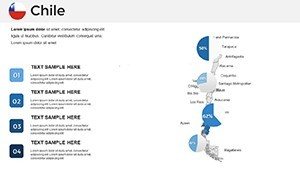
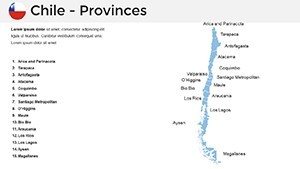
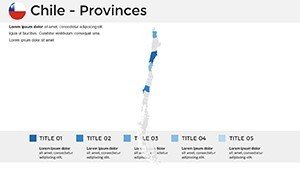
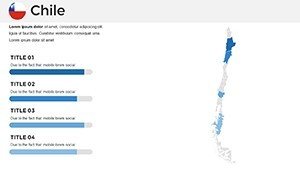
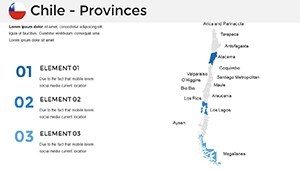
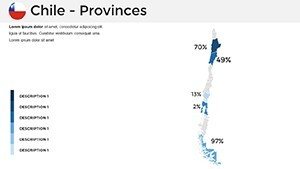
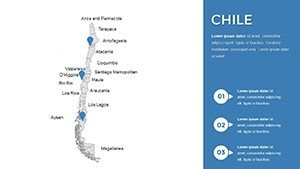
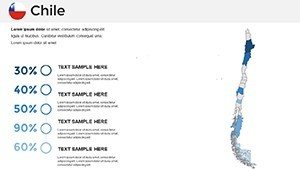
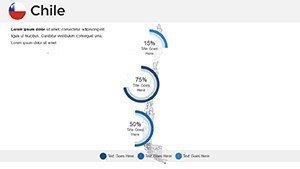
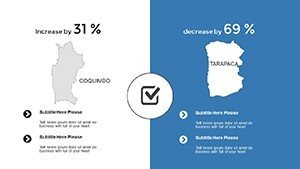
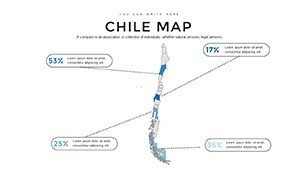
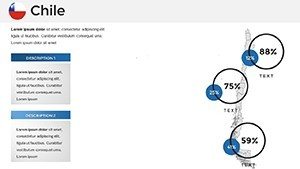
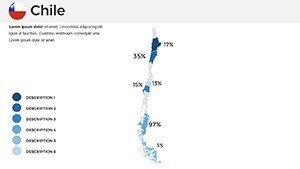
Dive deeper into what sets this template apart. Each of the 36 slides features vector-based maps that scale without losing clarity, ideal for high-definition projectors or virtual meetings. Start with the overview slide, which showcases Chile's elongated shape stretching over 4,000 kilometers, complete with labeled regions like Antofagasta for mining discussions or Valparaíso for port logistics. Customize colors to match your brand - perhaps earthy tones for environmental reports or vibrant hues for tourism pitches. Add interactive elements like clickable regions that reveal pop-up data on copper exports, Chile's top commodity, or biodiversity hotspots in the Lauca National Park.
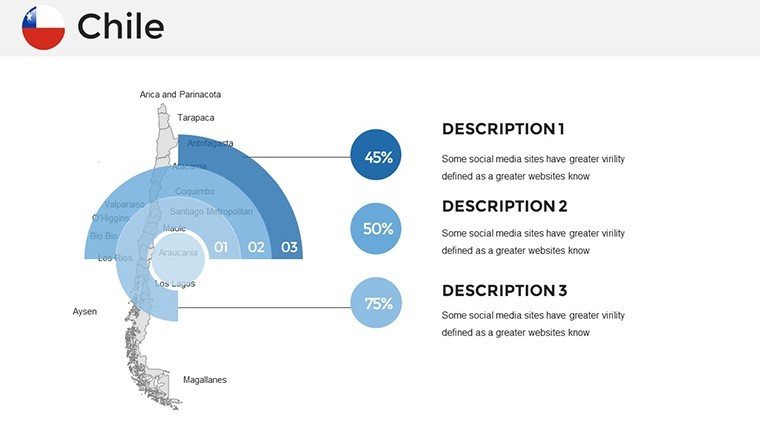
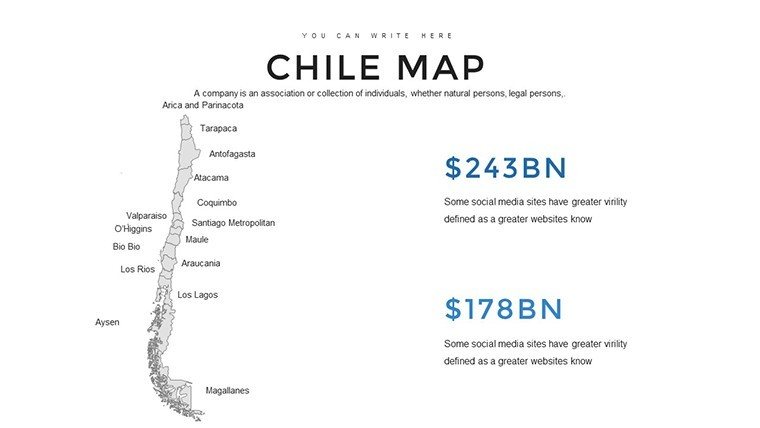
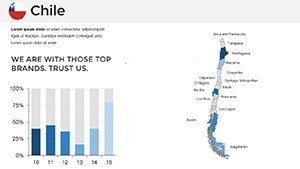
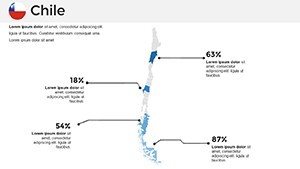
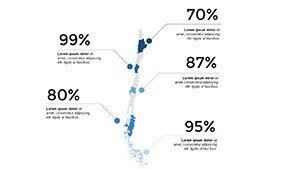
Integration is seamless: embed charts showing economic growth trends from the Central Bank of Chile or graphs depicting seismic activity in this earthquake-prone nation. For researchers, slides include placeholders for infographics on climate change impacts, such as retreating glaciers in the south. Businesses can highlight supply chain routes from the Atacama's lithium mines to global markets, using layered maps to demonstrate logistical efficiencies. The template's flexibility extends to text boxes and icons, where you can incorporate AIA-inspired design principles for architectural site planning in urban areas like Concepción.
Real-World Applications: From Classrooms to Boardrooms
Consider a case study from a Santiago-based mining firm: They used this template to pitch expansion plans to investors, overlaying geological surveys on regional maps to visualize untapped resources. The result? A 25% increase in funding commitments, thanks to the clear, data-backed visuals. Educators in Valdivia have adapted it for biology lessons, mapping endemic species distributions and linking to conservation efforts, making abstract concepts tangible for students.
- Business Strategy Sessions: Map out competitor landscapes in the wine industry, focusing on valleys like Colchagua, with heat maps showing production yields.
- Educational Workshops: Teach about indigenous Mapuche culture by highlighting southern territories, adding timelines of historical events.
- Research Symposia: Present astronomical data from observatories in the north, using star charts integrated with geographical overlays.
These applications aren't just theoretical; they're drawn from user feedback and industry reports, emphasizing how versatile maps enhance communication. Unlike generic tools, our template includes Chile-specific elements, such as Easter Island (Rapa Nui) insets for cultural presentations, ensuring relevance and depth.
Step-by-Step Guide to Maximizing Your Template
- Download and Open: Get the .pptx file and launch in PowerPoint or Google Slides for instant access.
- Customize Basics: Adjust the color scheme - try blues for coastal themes or greens for Andean forests - to align with your topic.
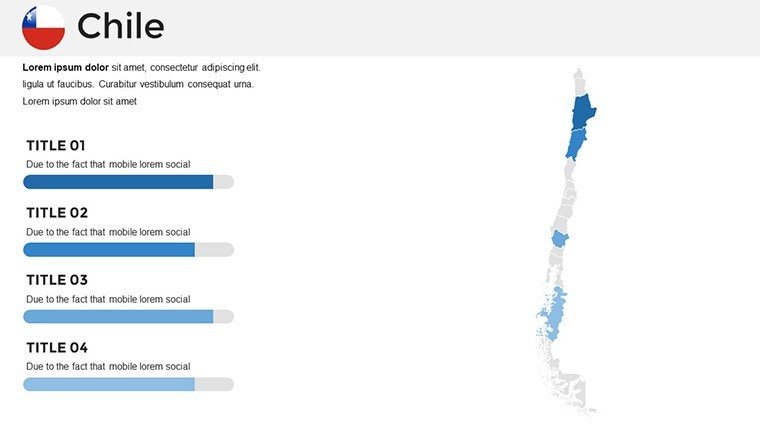
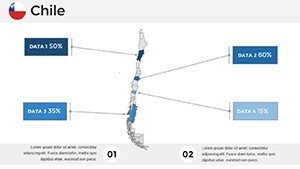
- Add Data Layers: Insert your datasets, like GDP per region from World Bank sources, into pre-formatted charts.
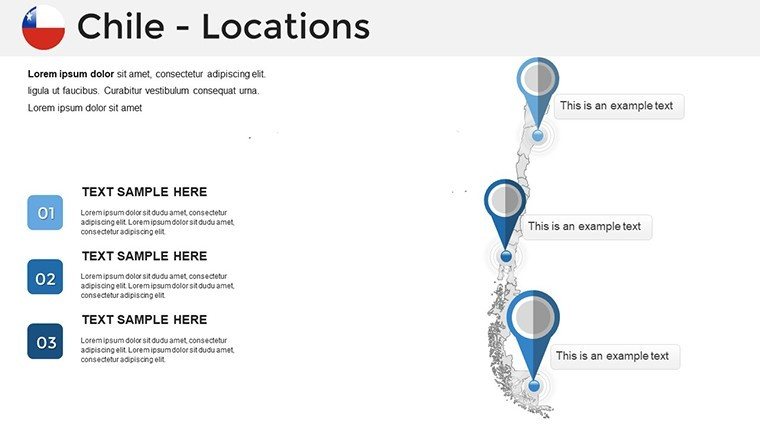
- Enhance Interactivity: Use hyperlinks on map regions to jump to detailed slides, creating a non-linear narrative flow.
- Refine and Present: Preview animations, such as fade-ins for regional highlights, to polish your delivery.
This workflow integrates smoothly with tools like Excel for data import, streamlining your process. Tips from design pros: Maintain a 1:1 aspect ratio for maps to avoid distortion, and use sans-serif fonts for readability in large venues.
Benefits That Go Beyond the Slides
Beyond features, this template delivers tangible value. It solves common pain points like mismatched visuals in team collaborations by offering version control-friendly edits. For global teams, compatibility with multiple languages allows annotations in Spanish or English, broadening accessibility. In a nod to sustainability, digital maps reduce paper use in presentations, aligning with Chile's eco-conscious initiatives like the Paris Agreement commitments.
Compared to basic PowerPoint maps, ours offer superior detail - think precise borders reflecting the 2022 administrative updates - without the bloat of unnecessary plugins. Users appreciate the lightweight file size, ensuring quick loads even on older hardware. Elevate your professional edge; as one user noted, "This template turned my dry report into a storytelling masterpiece."
Expert Tips for Chile-Focused Presentations
To truly shine, incorporate storytelling elements: Weave in anecdotes, like Pablo Neruda's poetry inspired by Chilean landscapes, to humanize data. For economic pitches, reference IMF reports on Chile's stable economy, visualized through growth trajectories on maps. Avoid overcrowding slides; aim for one key insight per map to keep focus sharp.
In architecture contexts, use the template for urban planning visuals, adhering to AIA standards by including scale bars and north arrows. Marketing teams can simulate customer journeys across regions, boosting campaign strategies with location-based insights.
Ready to revolutionize your presentations? Download this Chile maps template today and craft visuals that resonate long after the meeting ends.
Frequently Asked Questions
How editable are the maps in this Chile template?
Every element is fully editable - you can change colors, resize regions, add labels, or integrate data without restrictions.
Is it compatible with Google Slides?
While primarily for PowerPoint, it works well in Google Slides with minor adjustments for full functionality.
Can I use this for commercial purposes?
Yes, it's licensed for both personal and commercial use, ideal for client pitches or internal reports.
What file format is provided?
The download is in .pptx format, ensuring broad compatibility across devices.
Are there any tutorials included?
Basic customization guides are embedded in the template, with online resources available for advanced tips.