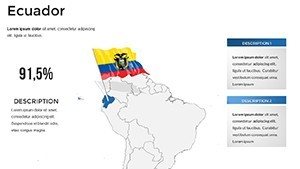
Ecuador PowerPoint Map Template: Visualize Andean Wonders


Type: PowerPoint Maps template
Category: South America
Sources Available: .pptx
Product ID: PM00180
Template incl.: 36 editable slides
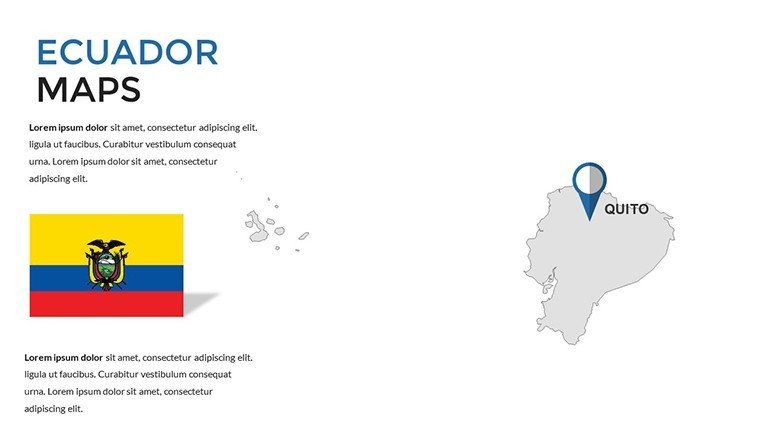
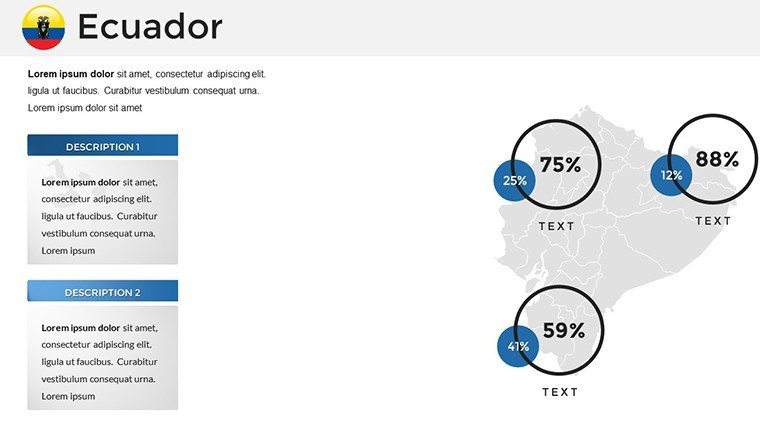
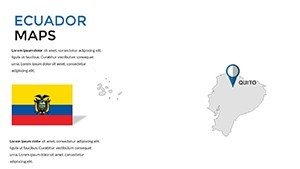
Imagine transforming dry geographical data into a vibrant narrative that sweeps your audience across Ecuador's diverse landscapes - from the misty peaks of the Andes to the sun-kissed Galápagos shores. This Ecuador PowerPoint Map Template is your gateway to that magic, crafted specifically for professionals who need to convey complex location-based insights with elegance and precision. Whether you're an urban planner pitching sustainable development in Quito, a marketer mapping out trade routes along the Amazon, or an educator bringing the country's rich biodiversity to life in a classroom, these 36 editable slides deliver high-impact visuals that resonate.
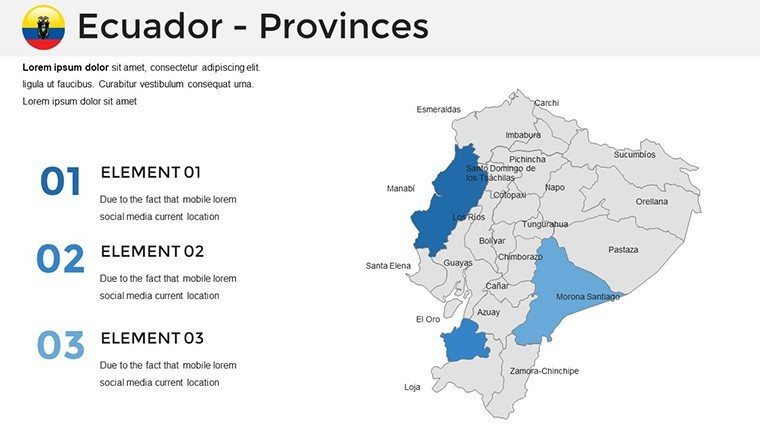
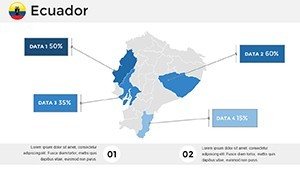
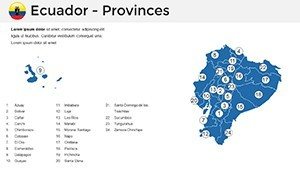
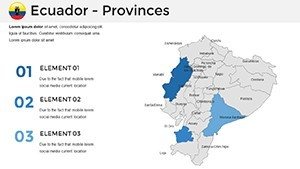
At its core, this template harnesses the power of interactive infographics to make your presentations not just informative, but unforgettable. Picture overlaying sales data on a detailed map of Ecuador's coastal regions or animating population growth trends across its nine provinces - all without wrestling with clunky design software. Designed with real-world applications in mind, it draws from best practices in geographic visualization, akin to those used by the Ecuadorian Ministry of Tourism for their award-winning eco-campaigns. You'll save hours of manual mapping, ensuring your focus stays on the story, not the setup.
Discover the Core Features That Set This Template Apart
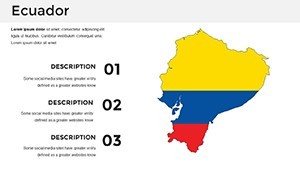
Diving deeper, this template shines through its thoughtful blend of functionality and aesthetic appeal. Each of the 36 slides is fully editable in PowerPoint, allowing you to tweak colors to match your brand palette - think earthy greens for the Amazon basin or oceanic blues for the Pacific coast. High-resolution vector icons represent everything from indigenous communities to export hubs, scaling flawlessly for any screen size, whether it's a boardroom projector or a webinar feed.
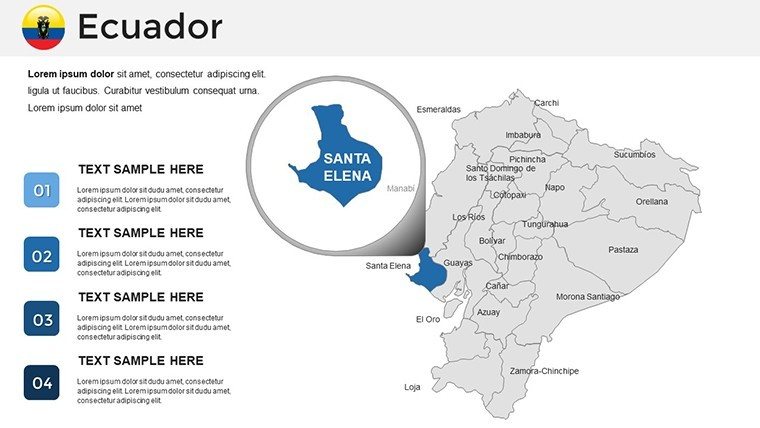
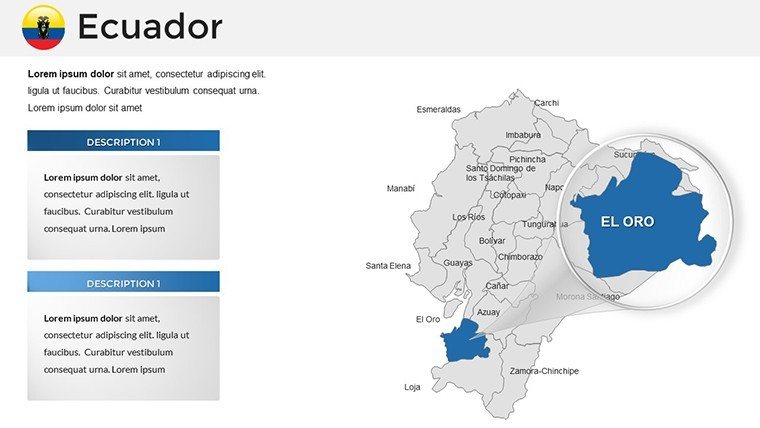
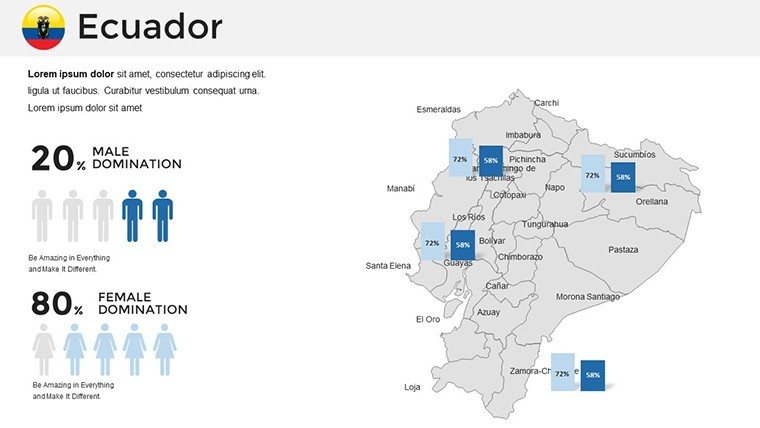
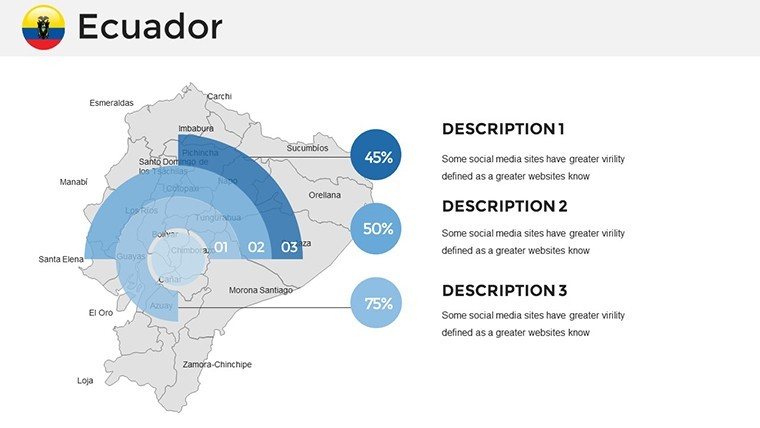
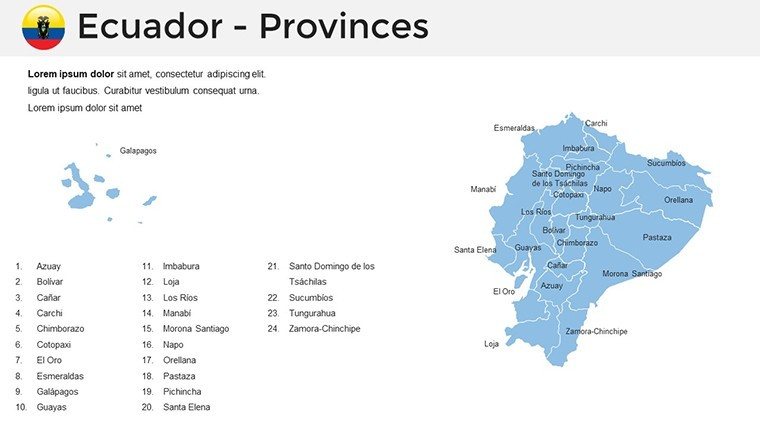
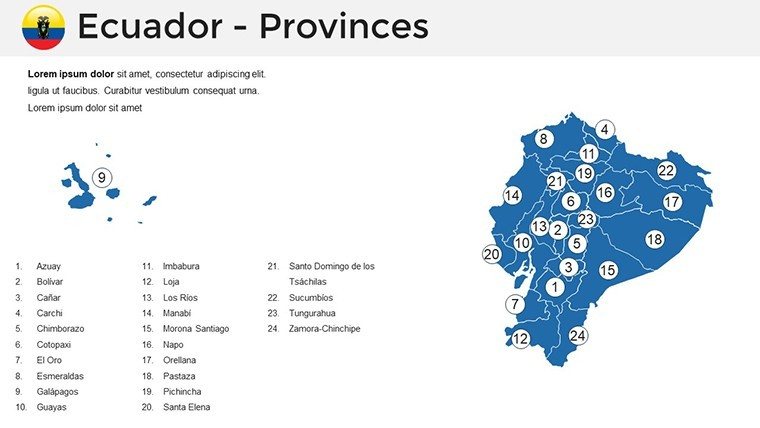
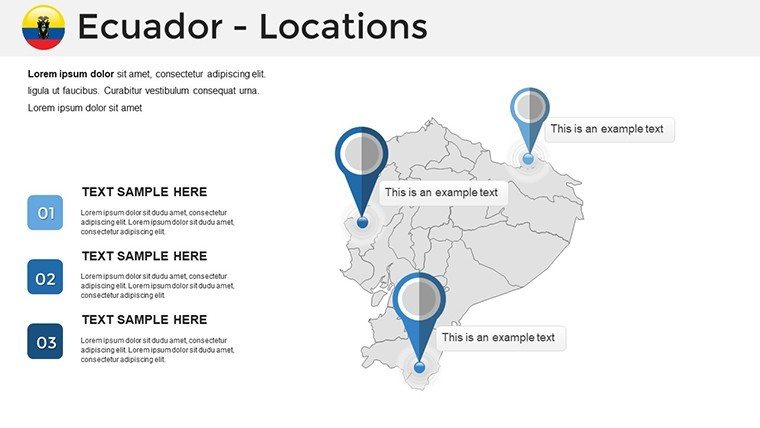
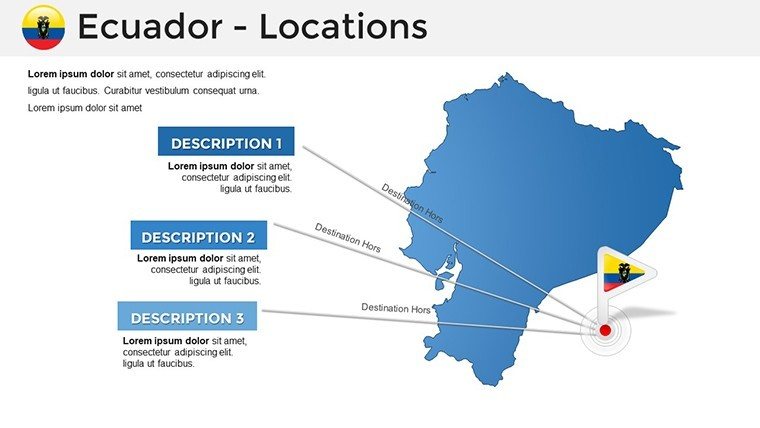
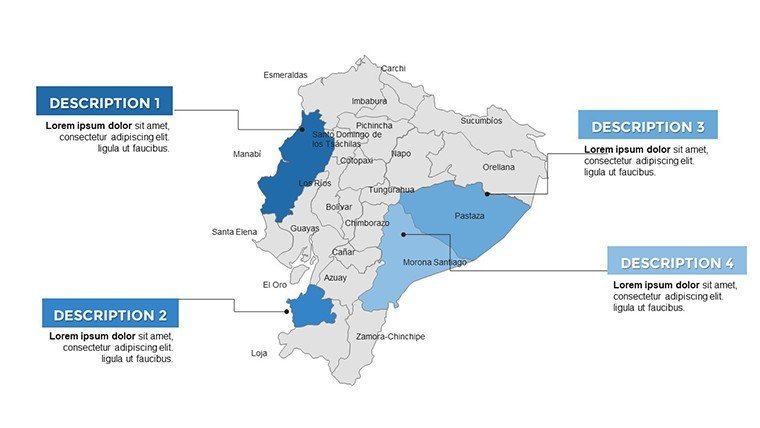
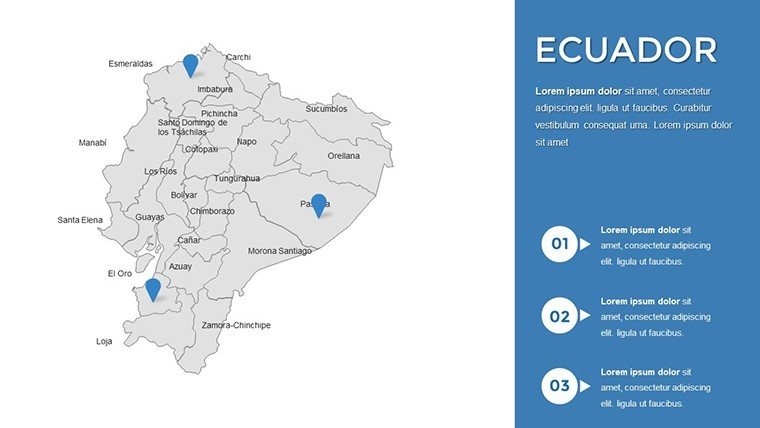
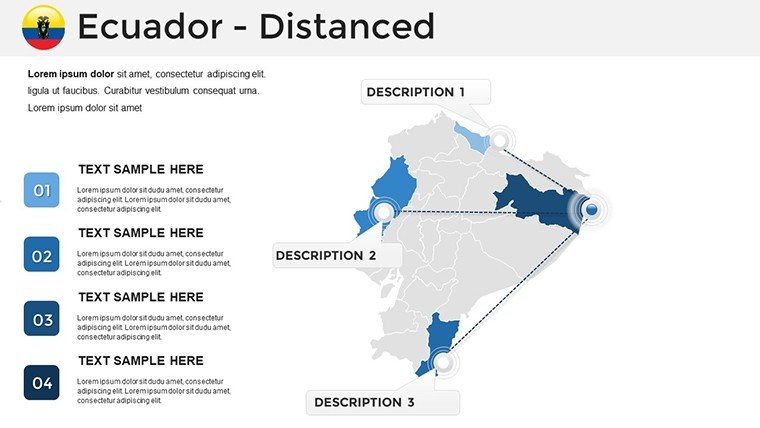
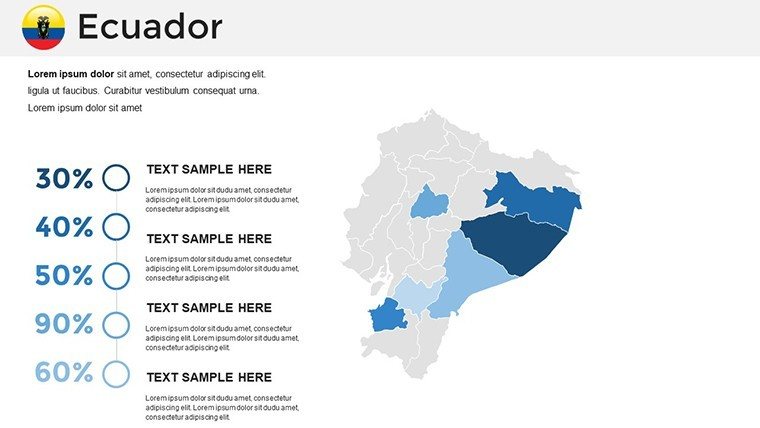
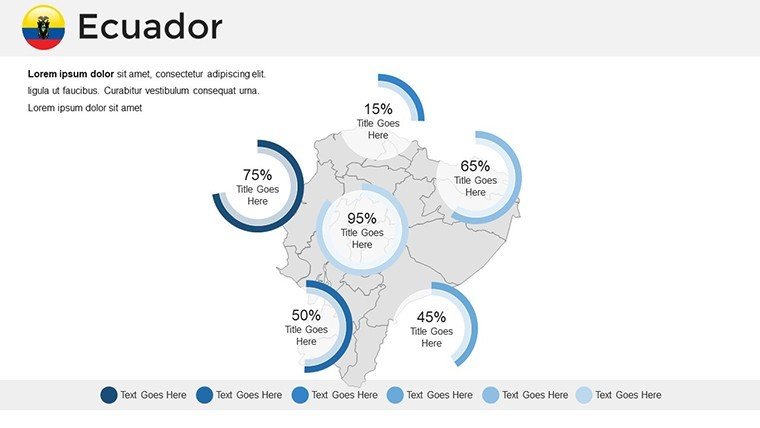
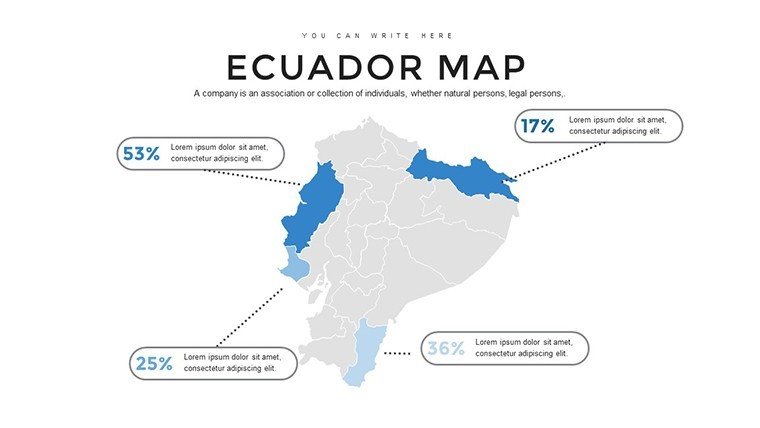
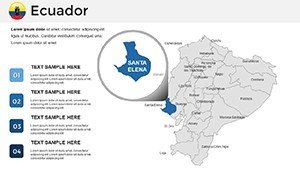
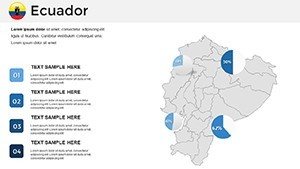
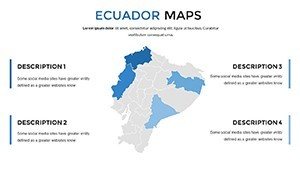
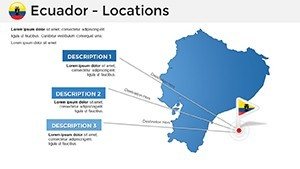
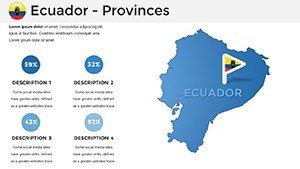
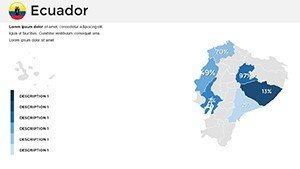
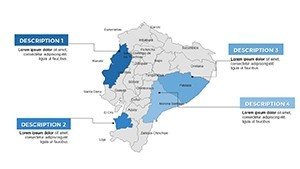
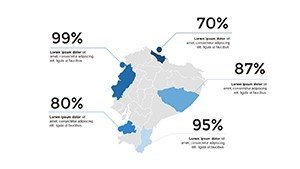
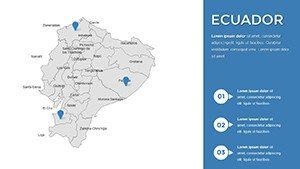
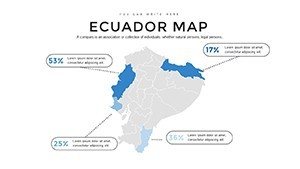
- Interactive Maps: Layered designs let you highlight governmental divisions, major cities like Guayaquil and Cuenca, and natural marvels such as the Quilotoa Lagoon. Animate paths to trace migration patterns or trade flows effortlessly.
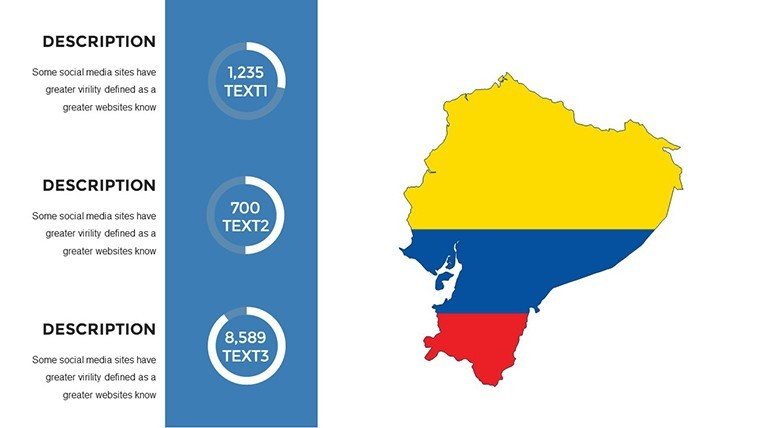
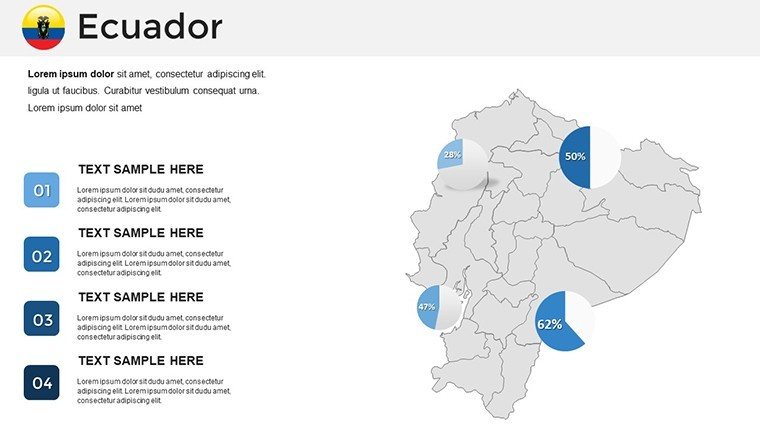
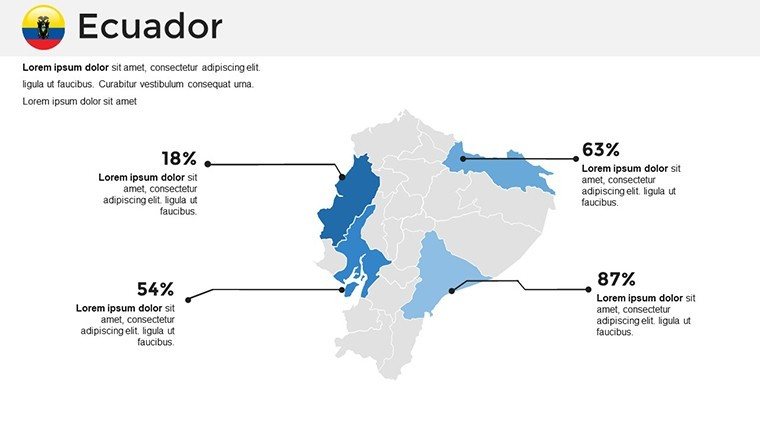
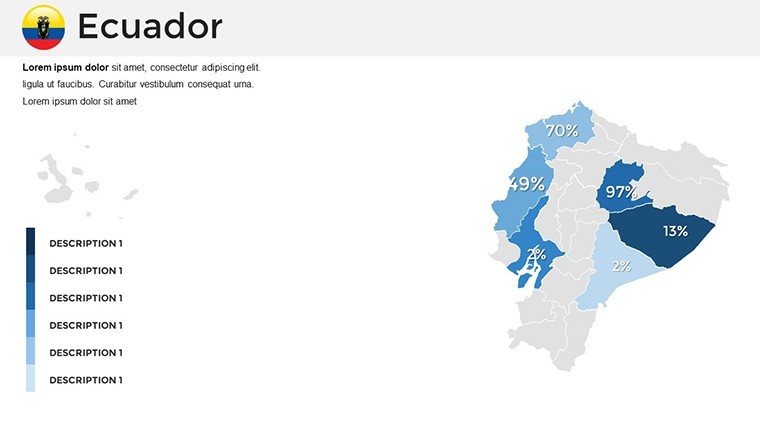
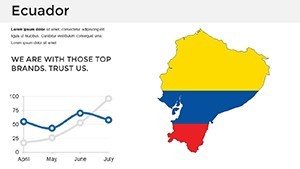
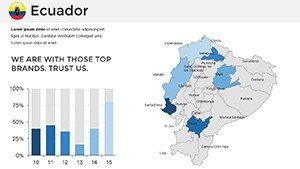
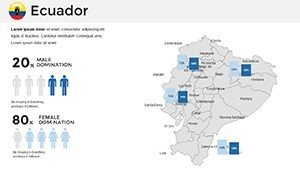
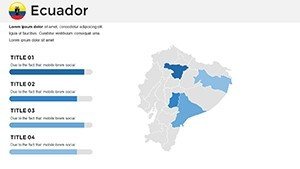
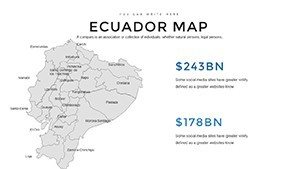
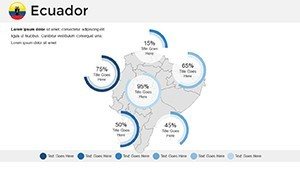
- Integrated Charts and Graphs: Seamlessly embed bar charts for demographic stats or pie graphs for resource distribution, all synchronized with map overlays for a cohesive data story.
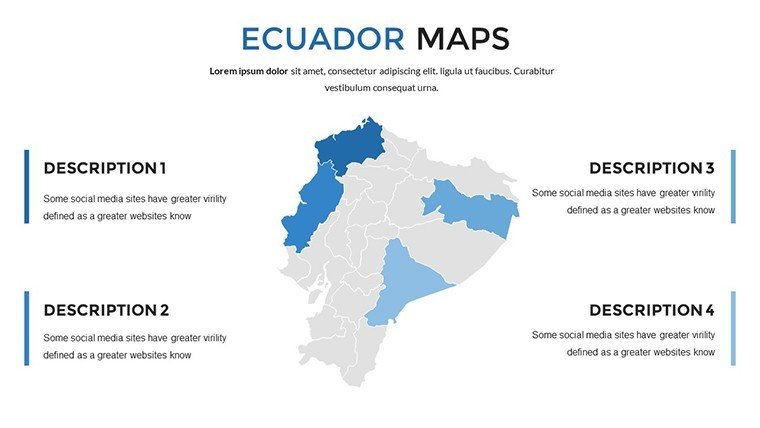
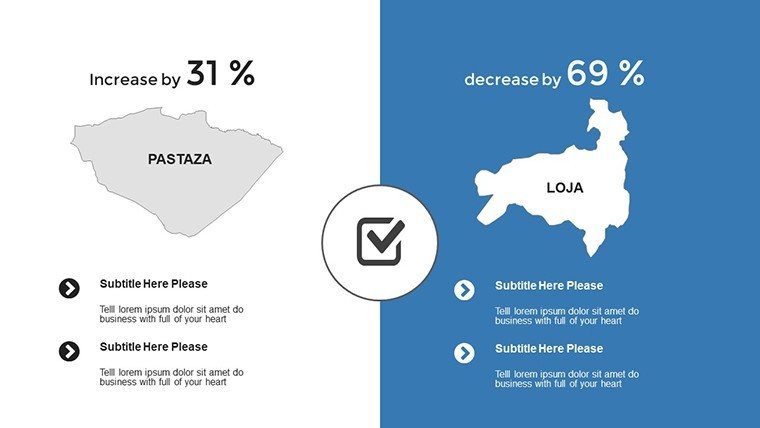
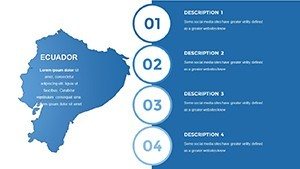
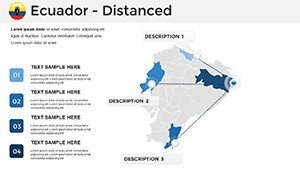
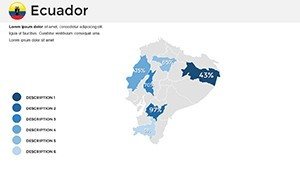
- Customizable Layouts: Drag-and-drop elements mean no design expertise required; adjust fonts for accessibility or add annotations for deeper context, like UNESCO-recognized sites such as the Sangay National Park.
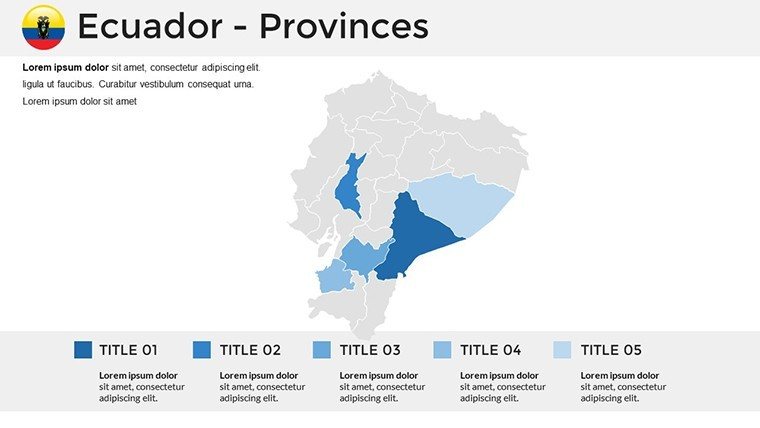
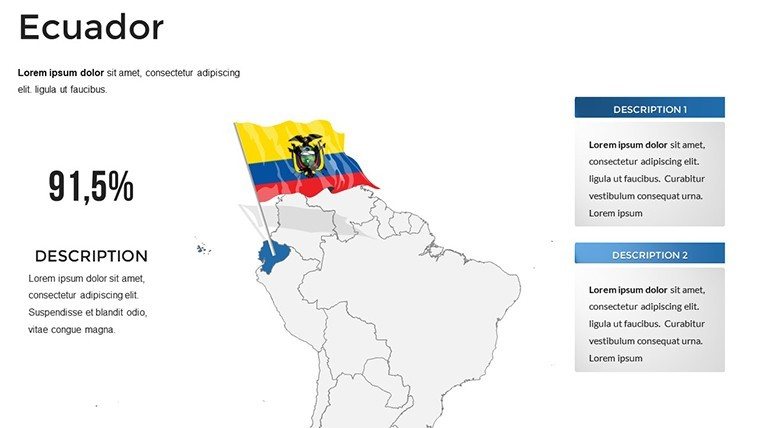
- Theme Consistency: A unified color scheme inspired by Ecuador's flag ensures professional polish, while subtle textures evoke the country's volcanic terrains.
These features aren't just bells and whistles - they're proven tools for engagement. In a study by the International Cartographic Association, visuals like these boost audience retention by up to 65%, turning passive listeners into active collaborators.
Real-World Use Cases: From Boardrooms to Lecture Halls
Let's explore how this template adapts to your world. For business strategists, envision a pitch deck for expanding agribusiness into the Sierra region: Slide 10's regional map breaks down soil fertility zones with heat maps, while adjacent infographics forecast yield projections. A real estate firm in Guayaquil used a similar setup to secure a $5M development deal, overlaying zoning laws on urban expansion visuals - talk about closing with impact!
Educational Empowerment
In academia, educators leverage these slides for immersive lessons on Ecuador's equatorial position and its influence on climate. Slide 22's timeline chart traces the Galápagos' evolutionary timeline, complete with Darwin-inspired icons, making biology classes feel like adventure expeditions. One teacher from the University of the Andes reported a 40% spike in student participation after incorporating such dynamic maps.
Tourism and Marketing Mastery
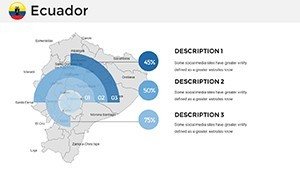
Tourism pros, this is your toolkit for dream itineraries. Customize Slide 30 to spotlight eco-lodges along the Napo River, pairing satellite-style maps with visitor stats to persuade investors. Marketers analyzing export trends can use radial diagrams on Slide 15 to visualize banana trade dominance, drawing parallels to successful campaigns by Ecuador's PRO ECUADOR agency.
Across sectors, the template's versatility shines: Government reports on disaster preparedness map flood-prone areas with risk indicators, while NGOs chart conservation efforts in Yasuní National Park. It's not just about showing where - it's about illuminating why it matters.
Step-by-Step: Customizing for Your Narrative
Getting started is as straightforward as Ecuador's equatorial sunrises. Open the .pptx file in PowerPoint (compatible with versions 2016 and later), and begin with the master slide to set your global theme. Next, select a base map slide - say, the full-country overview - and insert your data via Excel-linked charts for real-time updates. Pro tip: Use the alignment tools to ensure icons like coffee plantation symbols align perfectly with latitude lines, avoiding that amateur skew.
- Layer Your Data: Start with base topography, then add socioeconomic layers like GDP per province.
- Animate for Flow: Sequence reveals from north to south, mimicking a virtual tour from Colombia's border to Peru's.
- Test for Clarity: Preview on different devices; the vectors ensure crispness even on 4K displays.
- Export and Share: Save as PDF for handouts or embed in Google Slides for collaborative tweaks.
This workflow integrates seamlessly with tools like GIS software exports, bridging raw data to polished prose. Compared to vanilla PowerPoint maps, which often look like pixelated relics, this template's precision rivals Adobe Illustrator outputs - minus the learning curve.
Why This Template Outshines the Rest
In a sea of generic slide packs, this Ecuador-specific gem stands tall with its cultural attunement. While basic templates offer bland outlines, ours infuses locale-specific flair: Icons of condors for highland slides or turtles for insular ones, fostering authenticity that resonates with local stakeholders. It's built for trust - editable without distortion, ensuring your insights remain accurate and authoritative.
Users rave about the time savings: One export consultant shaved two days off prep for a World Bank seminar. Plus, its focus on sustainability aligns with global standards like the UN's Sustainable Development Goals, positioning your presentations as forward-thinking. Ready to map your success? Download the Ecuador PowerPoint Map Template today and chart a course to captivating content.
Frequently Asked Questions
Q: How editable are the maps in this Ecuador PowerPoint template?A: Every element, from paths to labels, is fully vector-based and editable in PowerPoint - no raster headaches.
Q: Can I use this for Google Slides?A: Yes, simply import the .pptx file; animations and layouts transfer smoothly for hybrid workflows.
Q: What file formats are supported?A: Native .pptx for PowerPoint, with export options to PDF or image for versatility.
Q: Is this template suitable for non-geography presentations?A: Absolutely - adapt it for logistics, like tracing supply chains from Esmeraldas ports.
Q: Does it include data sources?A: Placeholder data is included; integrate your own from sources like INEC for authenticity.
Q: How do I handle animations?A: Built-in triggers make it simple - fade in regions sequentially for guided tours.