Desired Result PowerPoint Diagrams


Picture this: You're standing in front of a room full of ambitious professionals, ready to unveil a roadmap to success that captivates and convinces. Our Desired Result PowerPoint Diagrams template makes that vision a reality. With 18 meticulously crafted, editable slides, this collection is your secret weapon for presentations on goal setting, problem resolution, and achieving tangible outcomes. Aimed at entrepreneurs, coaches, and team leaders, it transforms abstract concepts into vivid, actionable visuals. Whether you're guiding a startup through growth phases or helping a sales team overcome obstacles, these diagrams provide the clarity needed to drive results.
Inspired by proven methodologies like SMART goals and Kaizen principles, this template embeds expert insights right into your deck. For example, in a corporate workshop on performance improvement, use Venn diagrams to overlap individual strengths with team objectives, revealing synergies that propel collective success. This approach not only aligns with Harvard Business Review findings on goal-oriented strategies but also adds a layer of trustworthiness, showing you've done the homework on what truly works in real-world scenarios.
Unlocking the Power of Visual Goal Setting
The beauty of this template lies in its versatility and user-friendly design. Built with high-resolution vectors, each slide scales effortlessly, maintaining crispness on any device. Full compatibility with PowerPoint, OpenOffice, and Google Slides means no compatibility headaches. The thematic palette - energetic oranges and steady greens - evokes progress and growth, but you can tweak it to fit your narrative.
In-Depth Look at the Slides
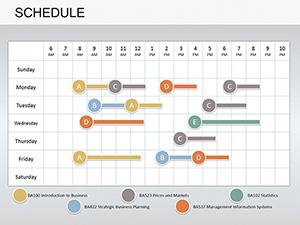
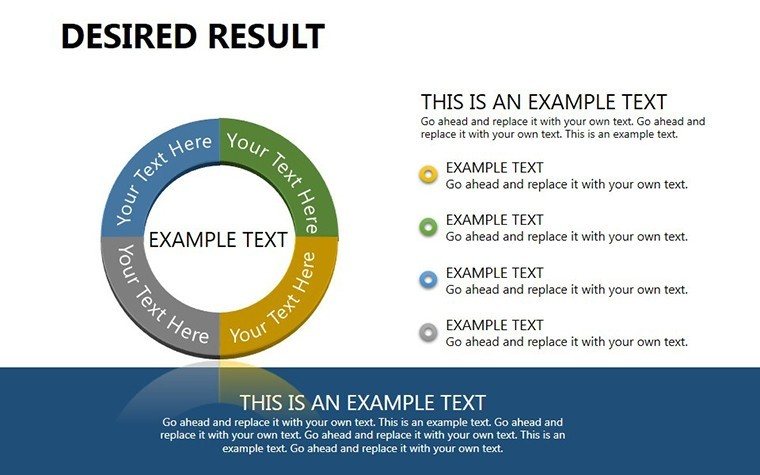
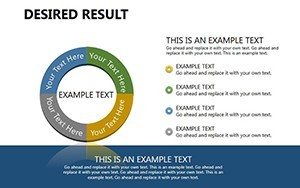
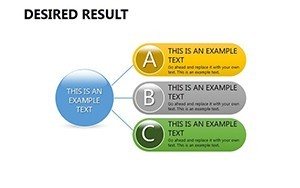
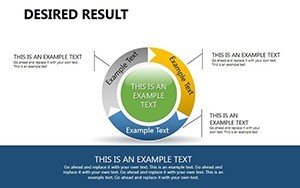
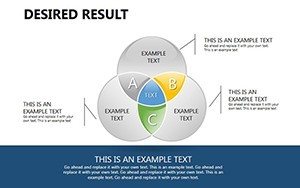
- Slide 1: Goal Framework Venn - Intersecting circles to define core objectives, ideal for brainstorming sessions.
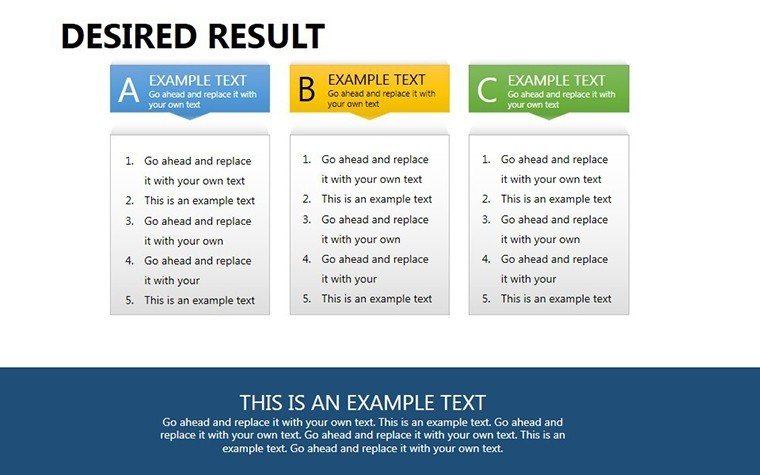
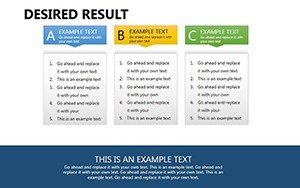
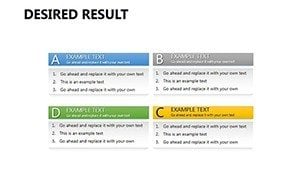
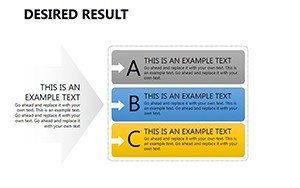
- Slides 2-6: Problem-Solution Tables - Structured layouts comparing challenges with strategies, complete with metrics columns.
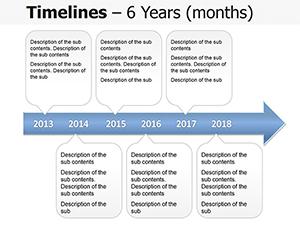
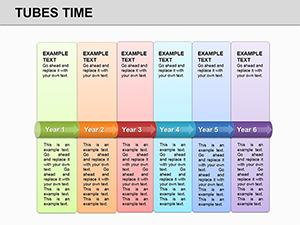
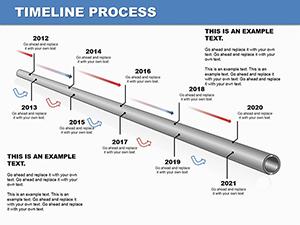
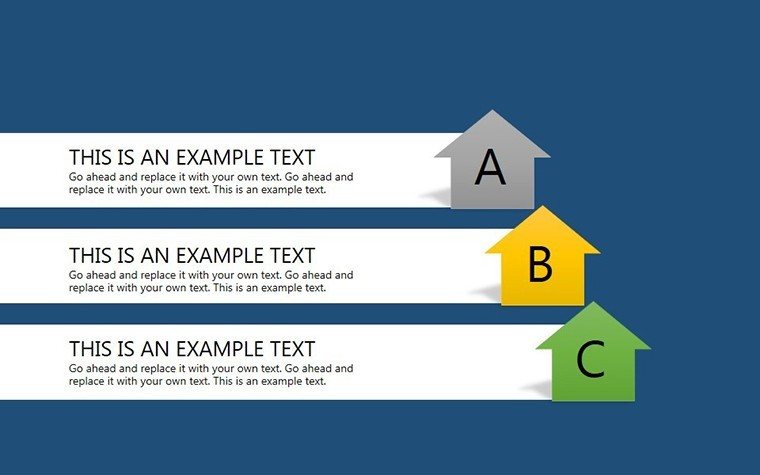
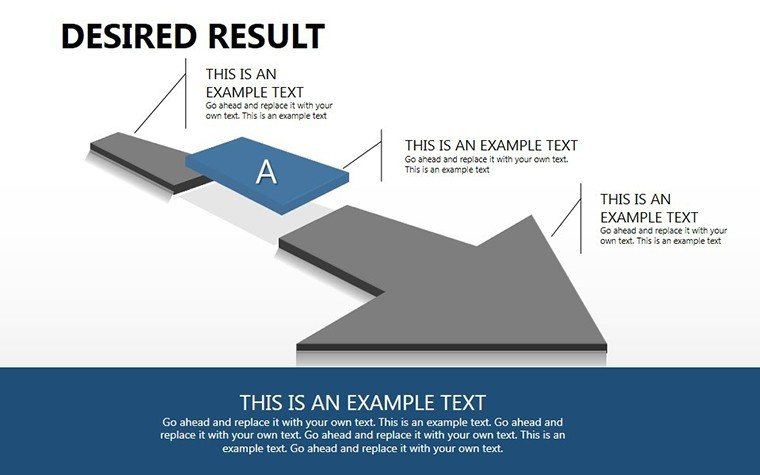
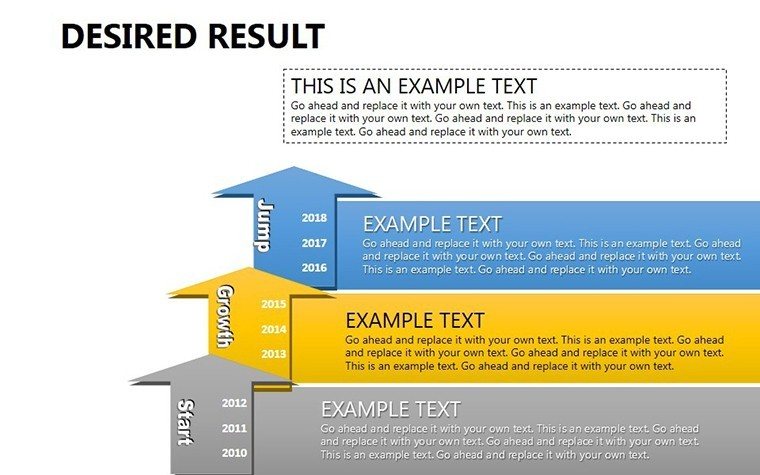
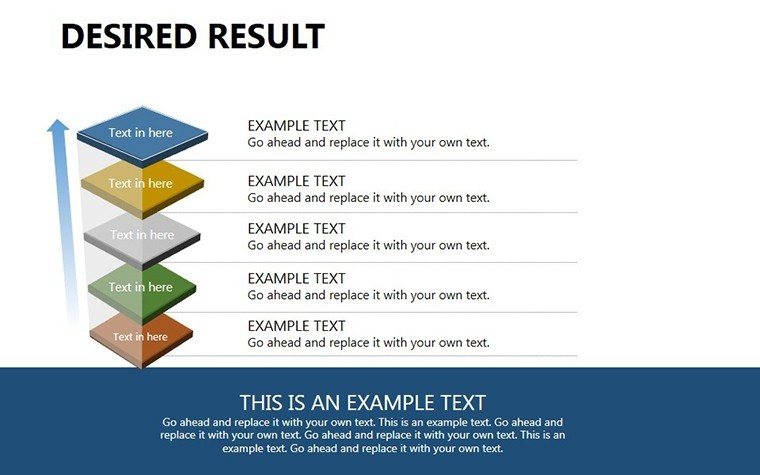
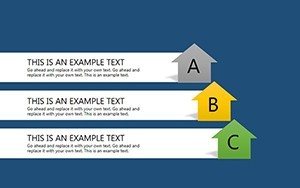
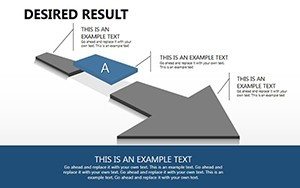
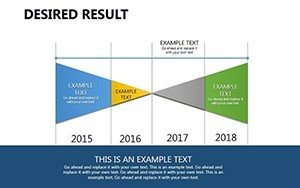
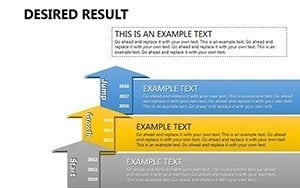
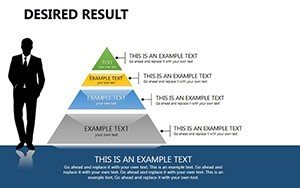
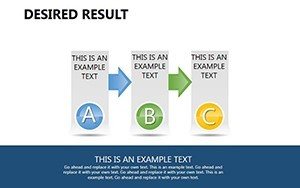
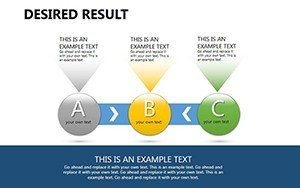
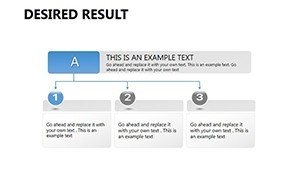
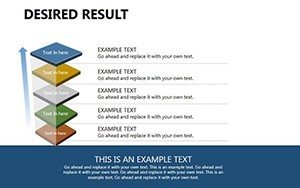
- Slides 7-12: Result Pathway Diagrams - Step-by-step visuals tracing from ideation to achievement, with icon-supported milestones.
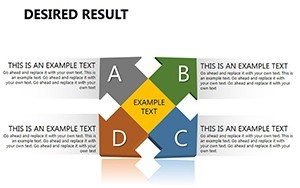
- Slides 13-17: Overlap Analysis Venns - Advanced intersections for multifaceted goals, like balancing short-term wins with long-term vision.
- Slide 18: Achievement Summary Table - A recap grid to highlight key takeaways and next steps.
These aren't generic fillers; they're populated with placeholder examples from diverse fields, like tech innovation or marketing campaigns, sparking your creativity.
Practical Use Cases That Drive Impact
In practice, this template has powered breakthroughs in various settings. Consider a nonprofit organization using table slides to map donor engagement strategies against fundraising goals, resulting in a 30% increase in contributions, as echoed in case studies from the Chronicle of Philanthropy. For personal development coaches, Venn diagrams help clients visualize life balance, merging career ambitions with wellness priorities for holistic success.
Entrepreneurs find value in pitching to investors: Employ pathway diagrams to illustrate market entry plans, turning potential skepticism into enthusiastic funding. The benefits? Faster preparation time versus starting from scratch, enhanced audience retention through visual storytelling, and a professional edge that sets you apart in competitive environments.
Guided Workflow for Result-Oriented Presentations
- Define Your Desired Outcome: Start with the end in mind, selecting slides that match your narrative arc.
- Tailor Content: Populate Venns and tables with your data, using built-in tools for quick adjustments.
- Build Engagement: Add anecdotes or stats to each diagram, making abstract ideas relatable.
- Visual Polish: Apply animations to reveal elements progressively, keeping viewers hooked.
- Deliver and Iterate: Present, gather feedback, and refine for future uses.
This methodical process addresses common pitfalls like overwhelming text slides, instead favoring concise, impactful visuals that resonate.
Integrating into Your Daily Success Toolkit
Seamlessly weave this template into your routine by linking it with productivity apps. Export tables to Excel for data syncing or collaborate in real-time via cloud platforms. A clever hack: Use Venn slides in team meetings to facilitate decision-making, quickly identifying consensus areas amid diverse opinions.
For educators, these diagrams enrich lessons on leadership, providing students with templates to practice goal mapping. In sales, adapt them for client proposals, visually demonstrating how your solutions lead to desired results, boosting close rates.
Expert Tips for Stellar Results
- Balance complexity: Use Venns for up to three overlaps to avoid confusion.
- Incorporate storytelling: Frame tables around success stories for emotional connection.
- Stay data-driven: Back claims with sources like McKinsey reports on goal achievement.
- Adapt for virtual: Ensure high contrast for screen sharing clarity.
- Review metrics: Track presentation effectiveness to evolve your approach.
Embrace these, and you'll not just present ideas - you'll inspire transformations.
Dive into success today - grab this template and start crafting presentations that deliver desired results with ease.
Frequently Asked Questions
What makes these diagrams ideal for goal setting?
They combine Venn overlaps with table structures to visually connect objectives and actions, simplifying complex strategies.
Is OpenOffice support full-featured?
Yes, all edits and features work smoothly in OpenOffice, matching PowerPoint functionality.
How can I apply this to team motivation?
Use pathway slides to map group goals, fostering alignment and enthusiasm through clear visuals.
Are there animation presets included?
The template comes with suggested animations, customizable for dynamic reveals.
What's the best way to handle large datasets?
Integrate with Excel links in tables for automatic updates and scalability.