Strategic PowerPoint Diagram Template


Envision a strategy session where hierarchies unfold like a pyramid's ascent, flows trace revenue streams without a hitch, and spheres cluster opportunities into focused orbs. This PowerPoint template realizes that with 17 editable slides, zeroing in on the diagrams that matter most for business minds. Geared toward executives dissecting market shifts or teams aligning on core principles, it strips away the guesswork, letting you spotlight problems, solutions, and paths ahead with unerring focus.
Rooted in .pptx for broad PowerPoint access, the set embraces pie charts for proportional breakdowns, flow diagrams for sequential logic, pyramid structures for layered priorities, and spheres for relational clusters. Each is vector-based, meaning edits - from resizing wedges to rerouting arrows - stay crisp across formats. It's about efficiency: plug in your data, align to your theme, and emerge with a deck that commands attention rather than competes for it.
Breaking Down the Strategic Toolkit
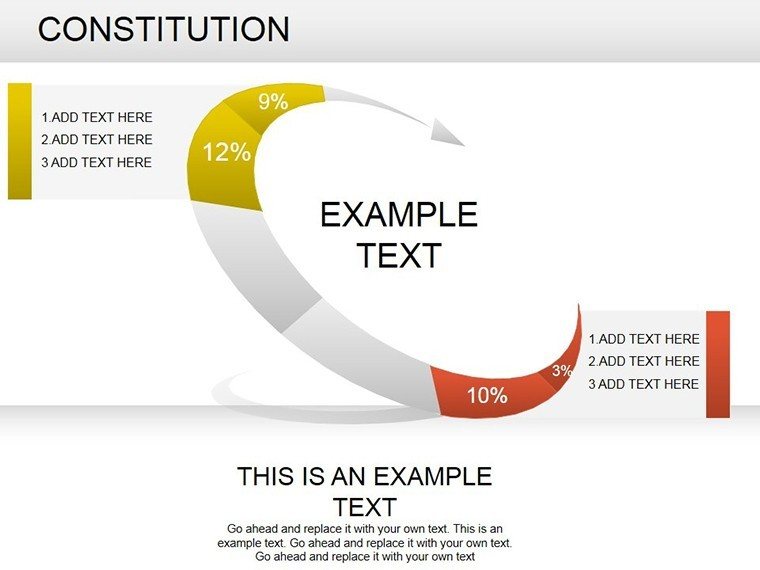
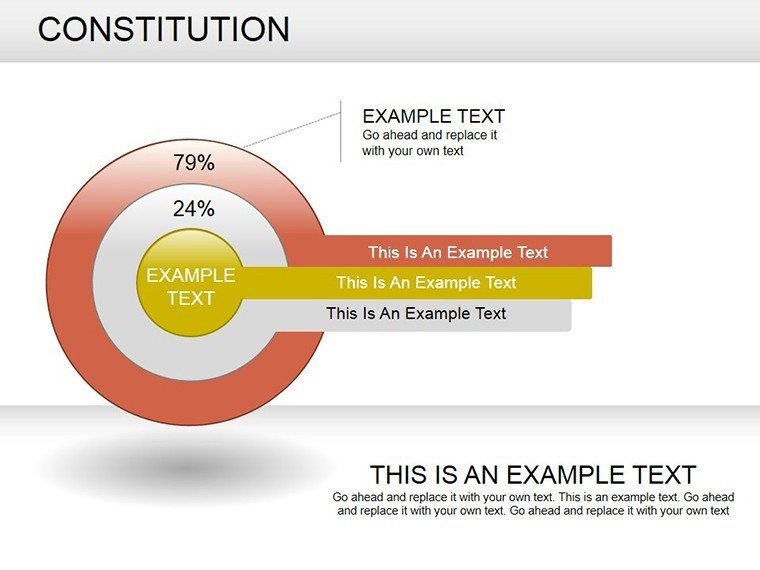
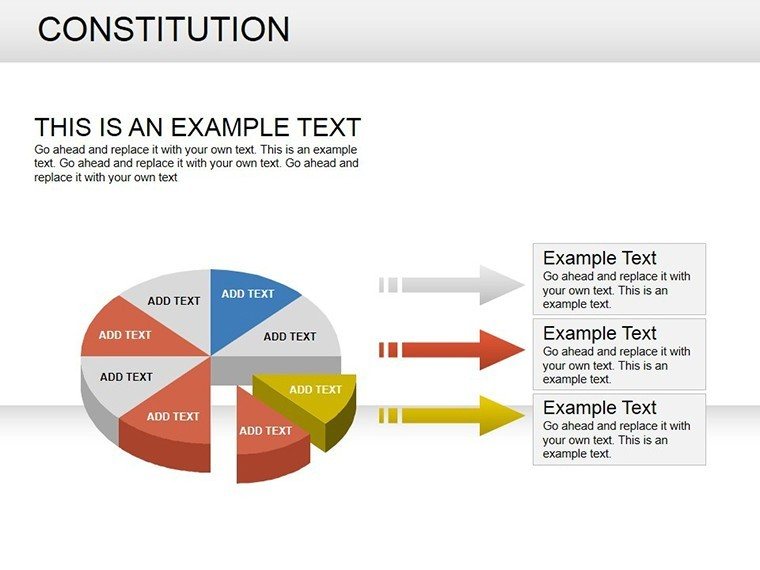
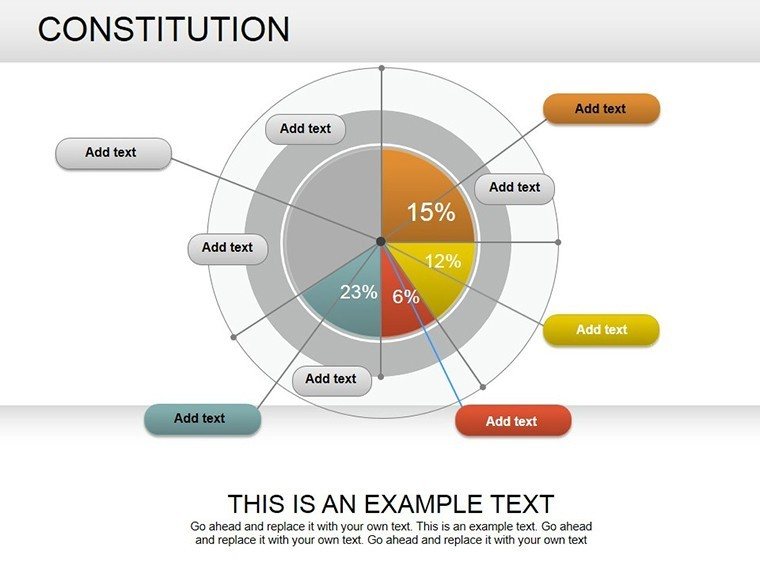
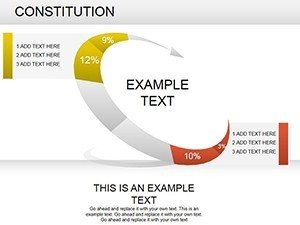
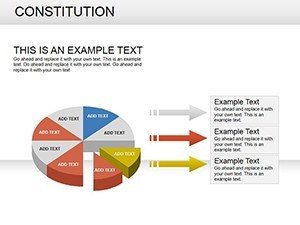
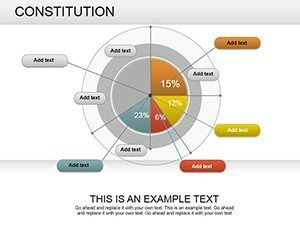
Pie charts kick off with simplicity's strength, slicing market shares or budget allocations into digestible portions. In a quarterly review, segment expenses by category, exploding a slice for deep dives - edit by dragging handles or linking to tables for auto-updates, turning static pies into live insights.
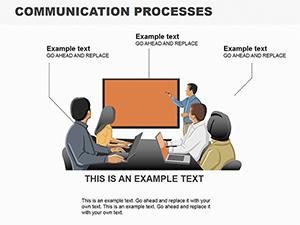
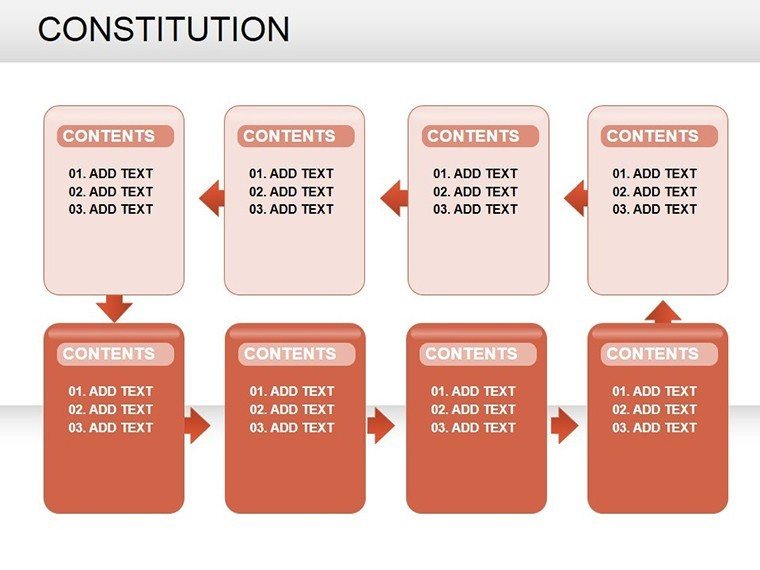
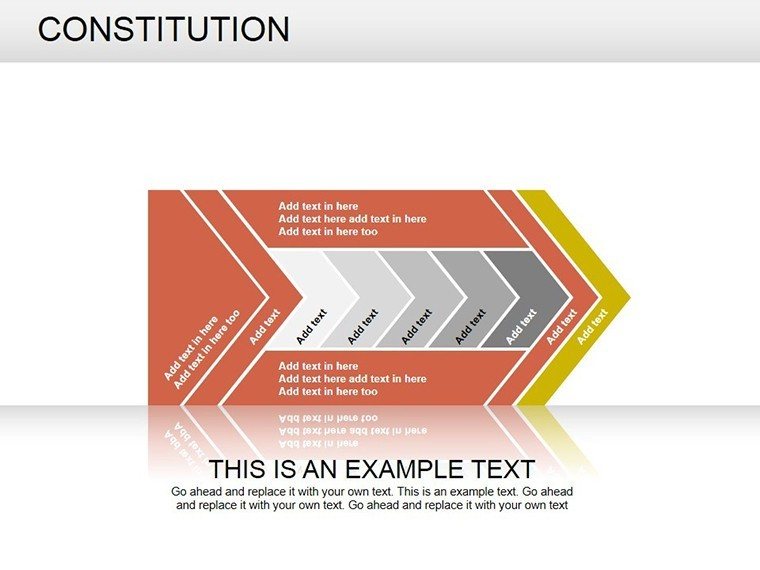
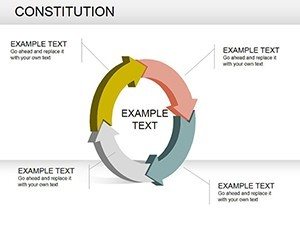
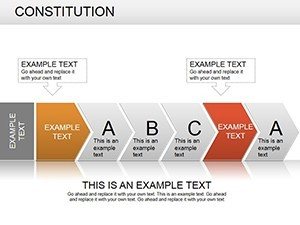
Flow diagrams provide the connective tissue, charting processes from ideation to execution. A operations lead might map supply chain logistics, with decision diamonds branching outcomes. Customization involves snapping connectors precisely or coloring paths by status, all via PowerPoint's smart guides for flawless geometry.
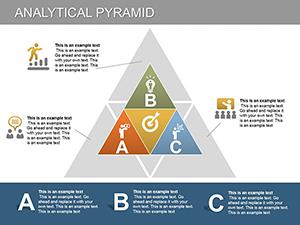
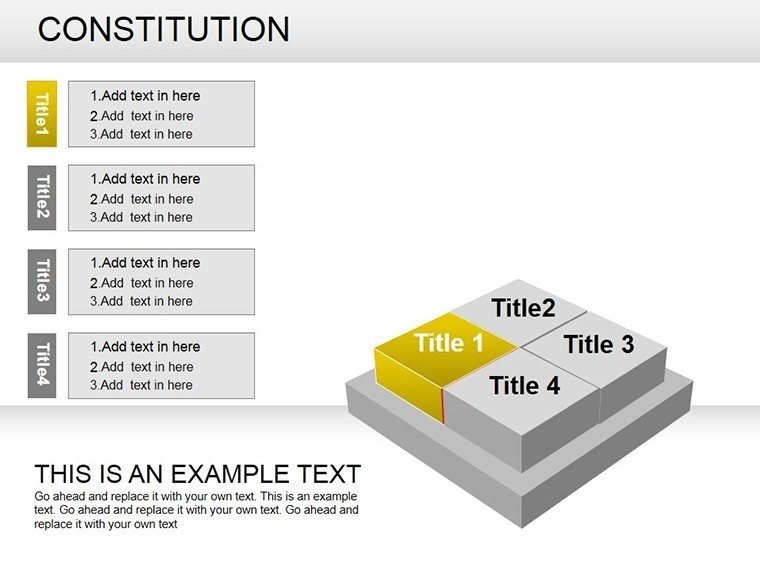
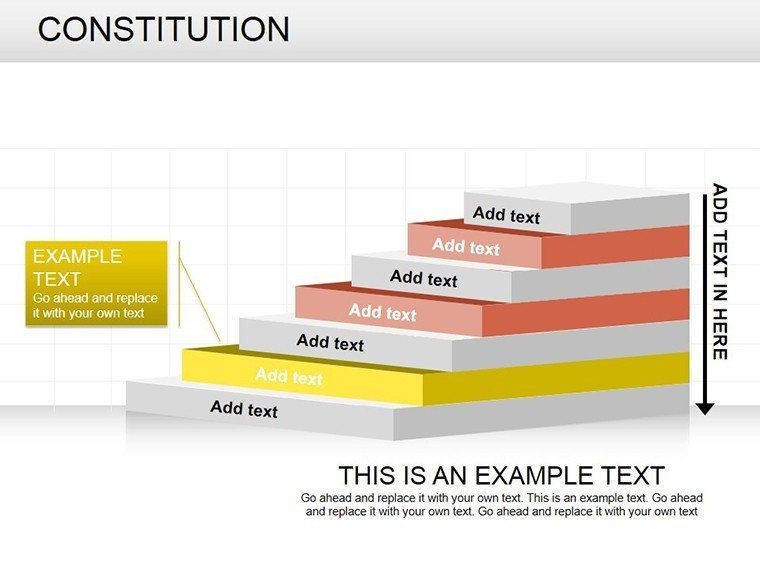
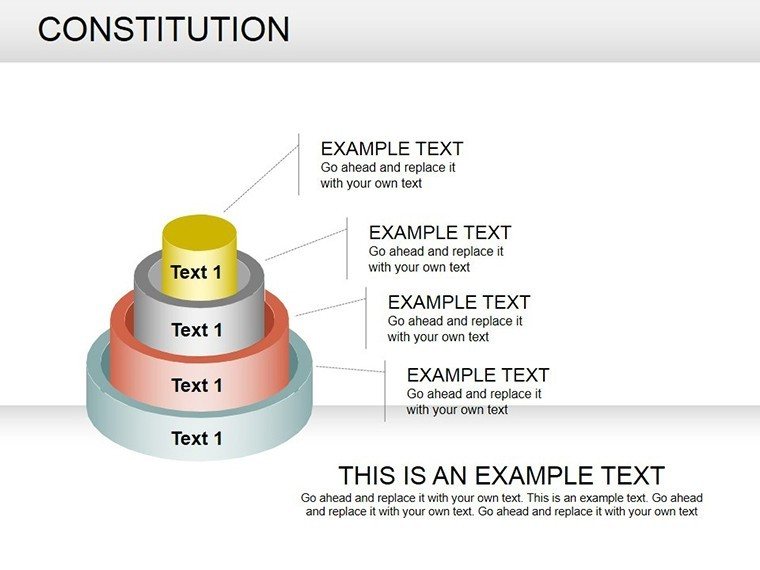
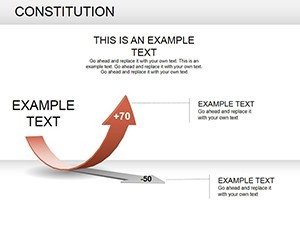
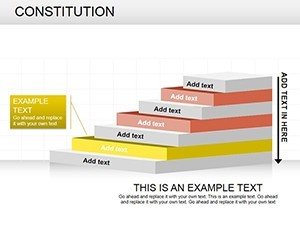
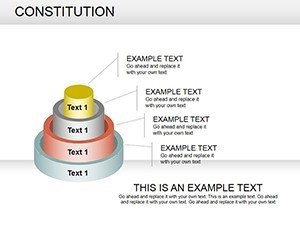
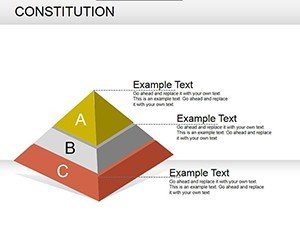
Pyramids build upward momentum, ideal for Maslow-esque needs or strategy tiers. Base layers for foundations, apex for visions - reorder levels by promoting demoting shapes, or infuse with gradients for depth, making abstract strategies feel grounded and achievable.
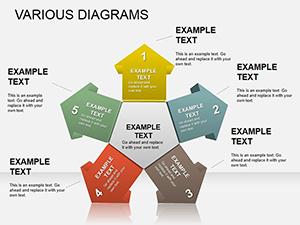
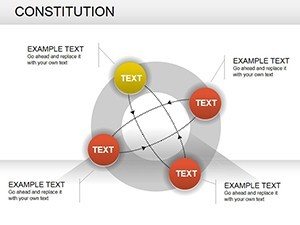
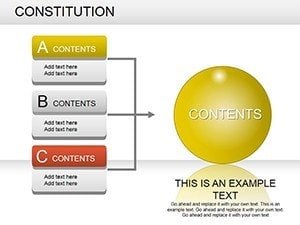
Spheres in Action: Clustering Complex Ideas
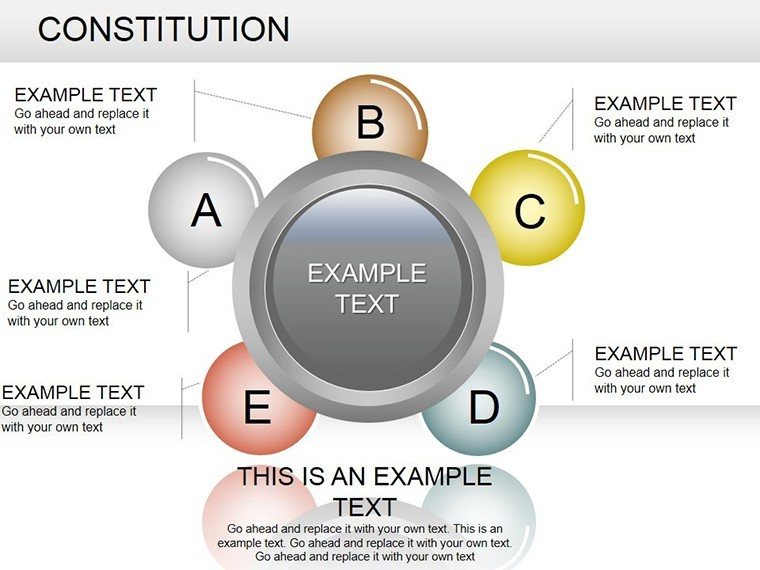
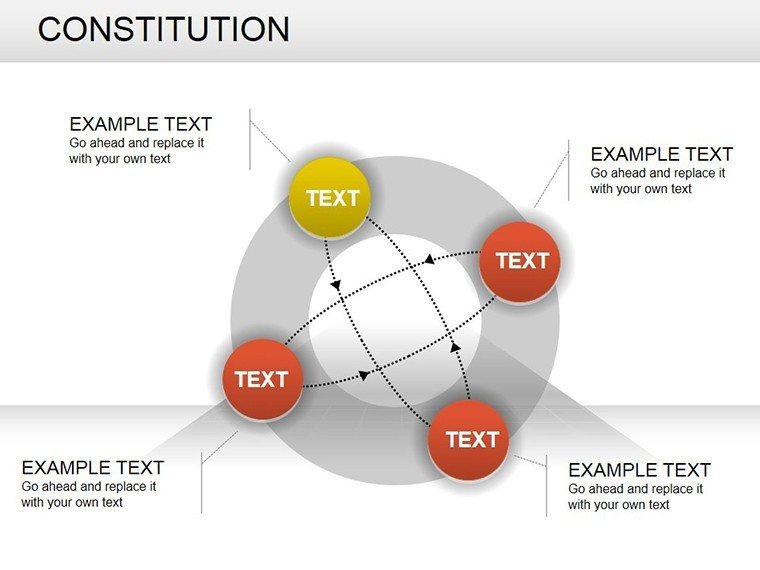
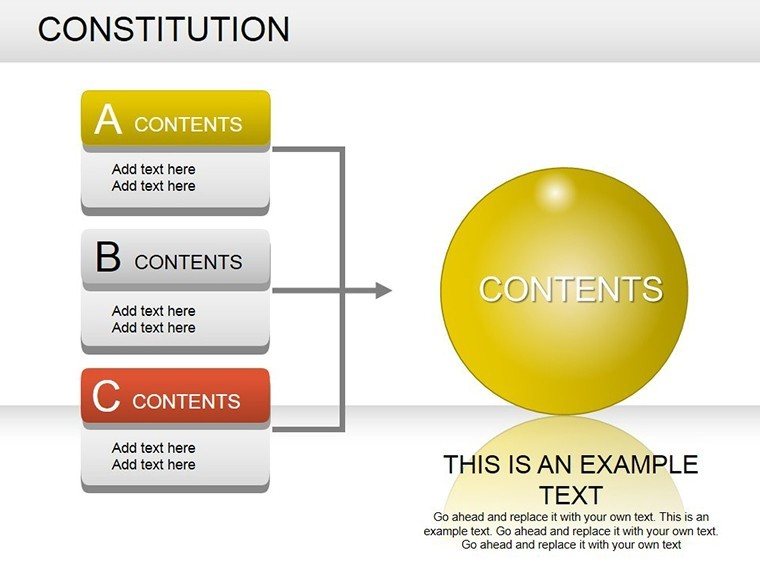
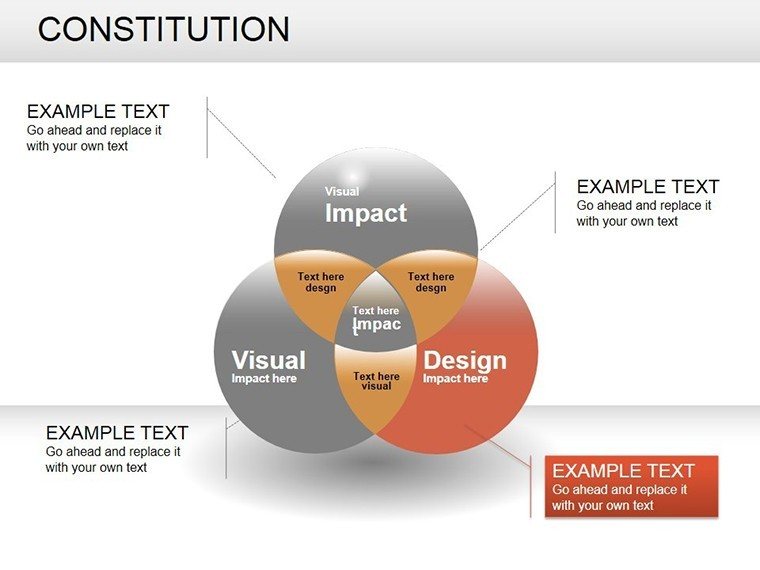
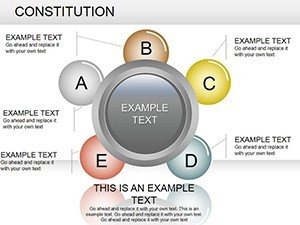
Spheres offer a modern twist, grouping elements in 3D-like arrays for ecosystem views. Cluster customer segments around a central brand orb, adjusting overlaps to show synergies. In PowerPoint, extrude for dimension or rotate groups, enhancing pitches where spatial relations seal the deal.
Practical Scenarios: Strategy in the Spotlight
For board-level talks, these diagrams distill vast data into pivotal moments. An exec unveiling a turnaround plan uses pyramids to layer risks from tactical to transformative, guiding discussions toward consensus without drowning in details.
Team workshops benefit too - a product owner employs flow diagrams to prototype user experiences, iterating live as feedback flows in. It's collaborative fuel, where visuals bridge gaps between diverse viewpoints.
In consulting gigs, spheres map competitive landscapes, spheres intersecting to highlight niches. One advisor layered these for a retail client, revealing untapped alliances that reshaped their expansion blueprint.
Your Roadmap to Strategic Slide Mastery
- Import and Inspect: Open the template; thumb through thumbnails to match slides to sections.
- Data Infusion: Begin with pies - enter values, watch auto-calculations handle the math.
- Flow Forging: Connect nodes in flows, label via text anchors, and test arrow directions.
- Pyramid Building: Stack levels, align centrally, and add callouts for key escalations.
- Sphere Synthesis: Position clusters, group for moves, and animate assemblies for reveal timing.
This approach harnesses PowerPoint's grouping prowess, far surpassing ad-hoc drawings in precision and speed.
Customization for Lasting Impact
Flexibility defines the experience: 40+ thematic icons, from arrows to abstracts, editable in outline view. Animations - wipe for flows, grow for pyramids - add narrative punch, inspired by clean infographic standards.
For cohesion, apply slide masters to lock fonts and colors, then override per need. Embed charts from Excel for dynamic refreshes, or export to PDF for stakeholder shares, preserving fidelity.
Why It Aligns with Demanding Schedules
Light on resources yet heavy on value, it's printer-friendly and collaboration-ready via OneDrive. Ultimately, this template equips you to navigate strategic depths with surfaces that shine.
Sharpen your business edge - grab this strategic PowerPoint diagram template and chart courses that captivate.
Frequently Asked Questions
What diagram varieties are in this strategic template?
It covers pie charts, flow diagrams, pyramids, and spheres for comprehensive business visuals.
Compatibility details for PowerPoint?
Fully works with PowerPoint 2016+, in standard .pptx format.
Editing ease for non-designers?
Yes, intuitive tools like drag-and-drop and auto-align make it accessible.
Slide count and editability?
17 fully editable slides, primed for your strategic content.
Animation support?
Includes basic builds; expand with PowerPoint's animation pane as desired.