System Analysis PowerPoint Diagram: Decode Processes Effortlessly


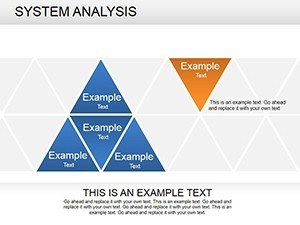


Systems don't break themselves - you uncover their fault lines. For business architects and IT strategists tired of tangled spreadsheets, our System Analysis PowerPoint Diagram template offers a 19-slide lifeline. This curated set dives into the art of dissecting workflows, from flowcharting user journeys to pyramid-modeling hierarchies, all in a format that's as intuitive as it is impactful.
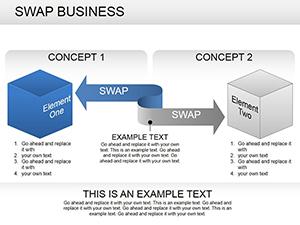
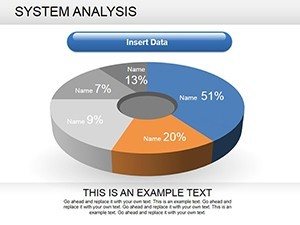
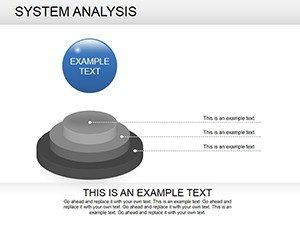
Whether you're auditing enterprise software integrations or pitching ERP overhauls to skeptical boards, these diagrams turn chaos into clarity. Inspired by methodologies like those in BABOK guides, the template equips you with tools to map relationships that matter - think pie charts segmenting bottlenecks or 3D spheres representing interconnected modules. Editable down to the node, it's your canvas for custom narratives that resonate in agile sprints or compliance audits.
Envision a consultant at Deloitte using Slide 12's flow diagram to trace data migrations, highlighting redundancies that slashed costs by 25%. That's the real-world alchemy here: visuals that not only explain systems but catalyze change.
Core Features Engineered for Analysts
Built with the precision of a systems engineer, this template anticipates every pivot point in your analysis.
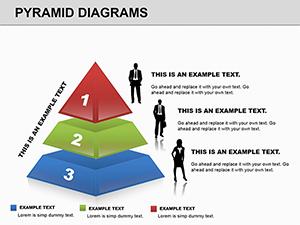
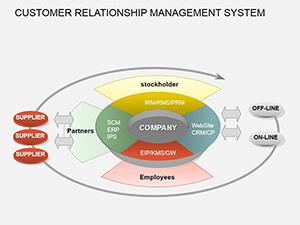
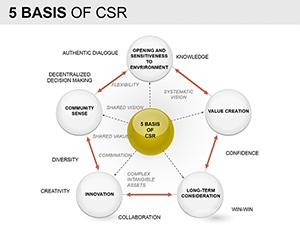
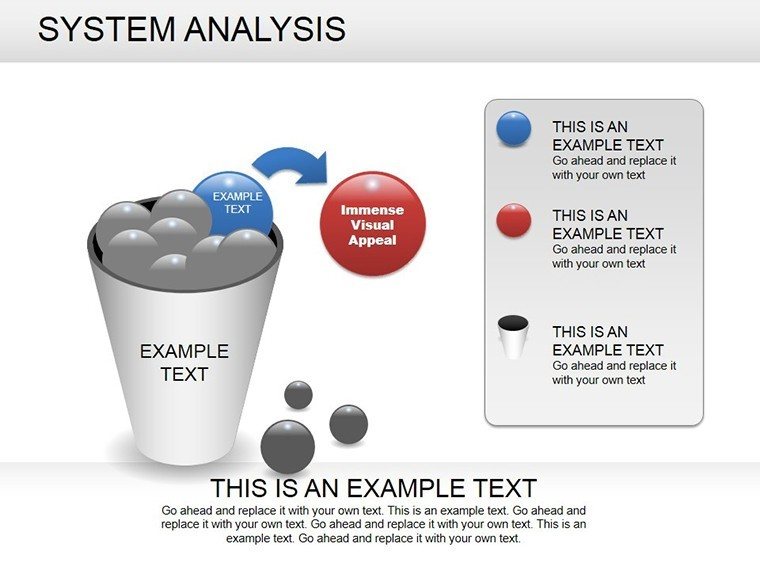
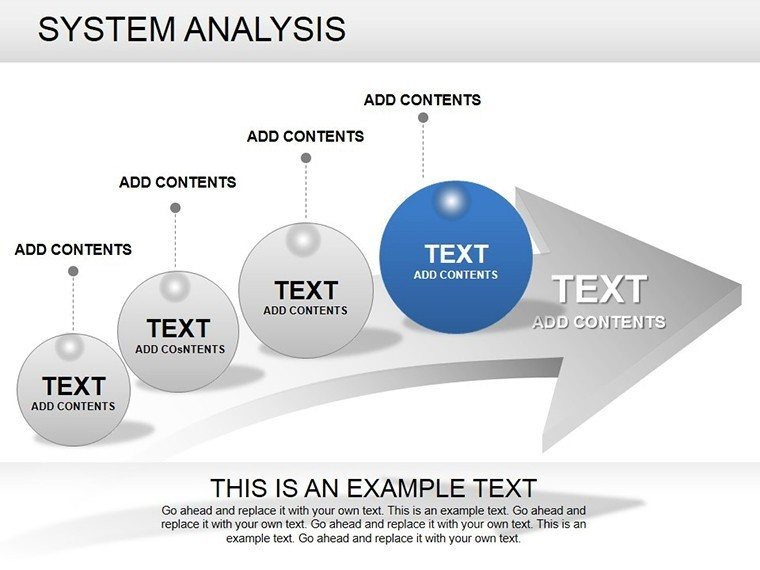
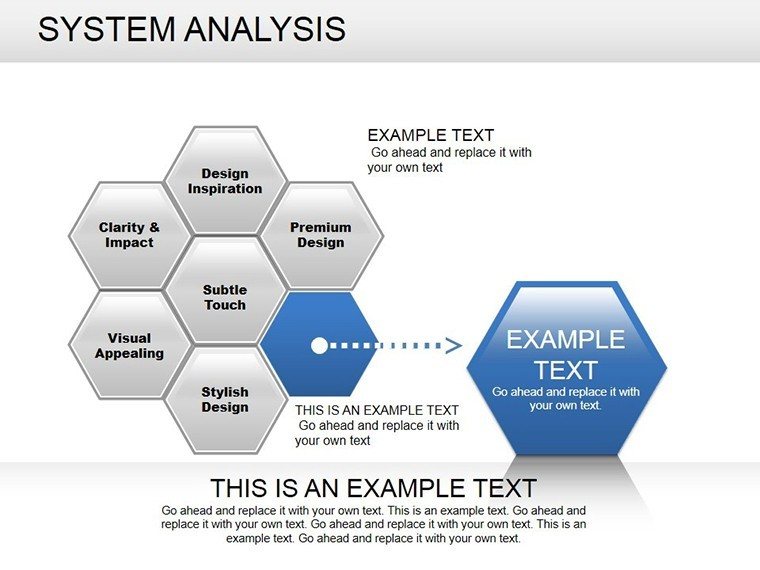
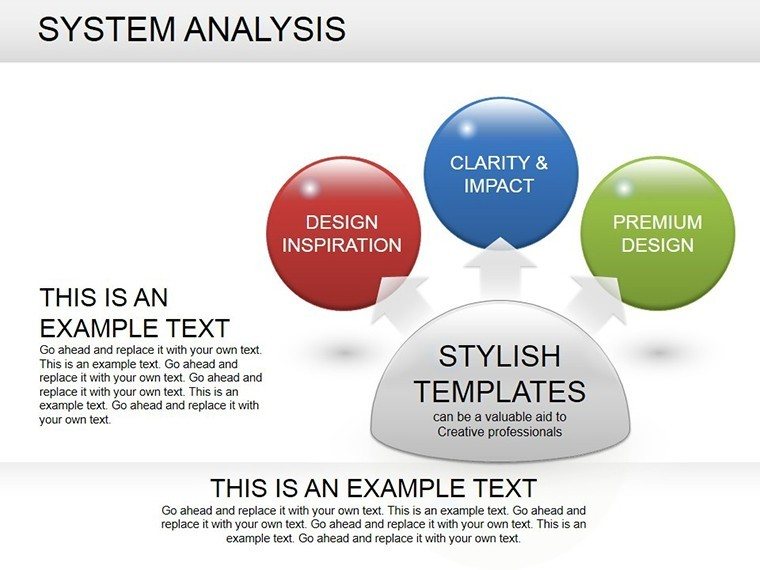
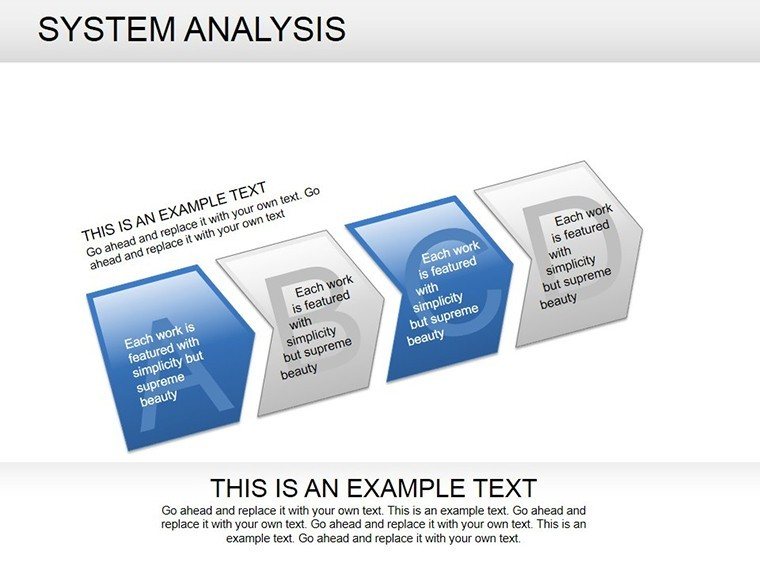
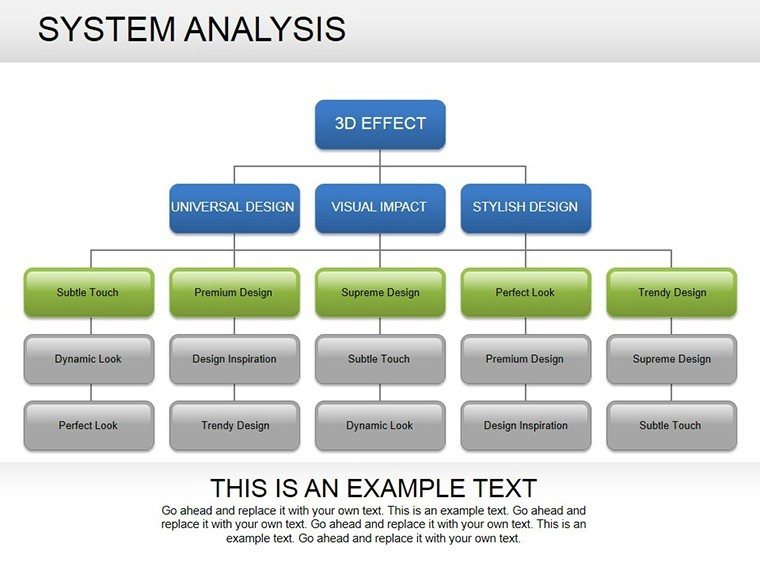
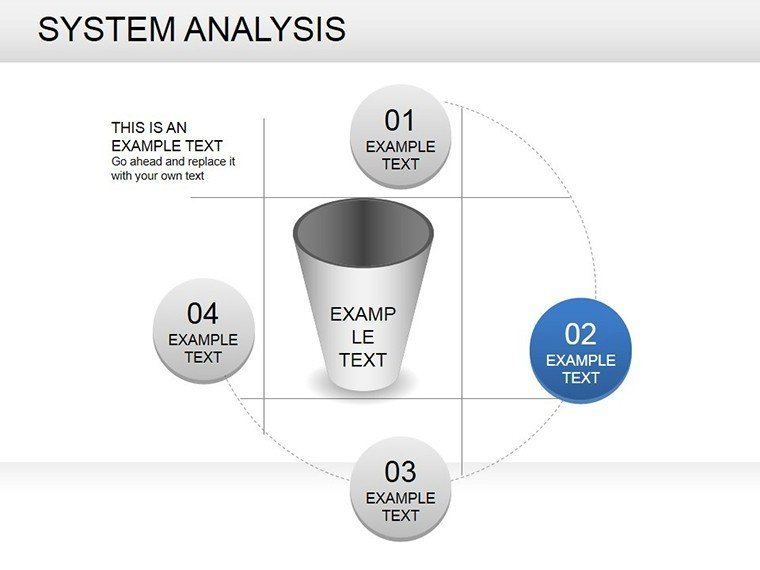
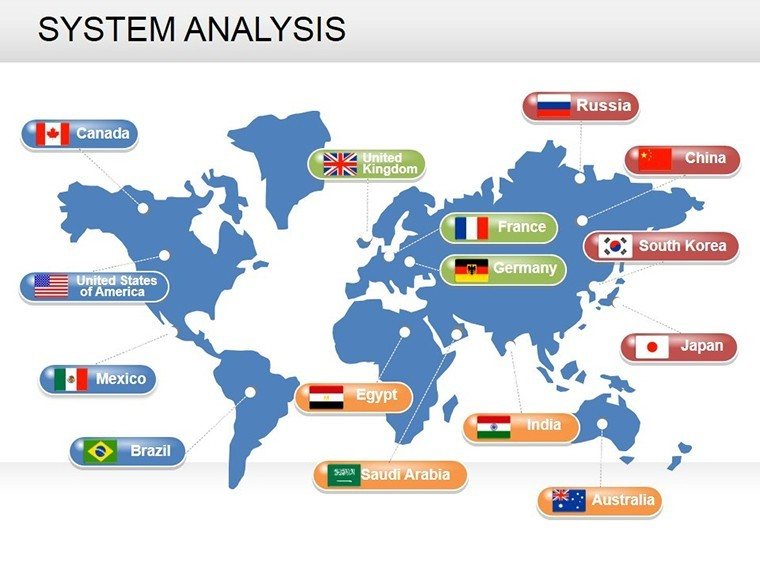
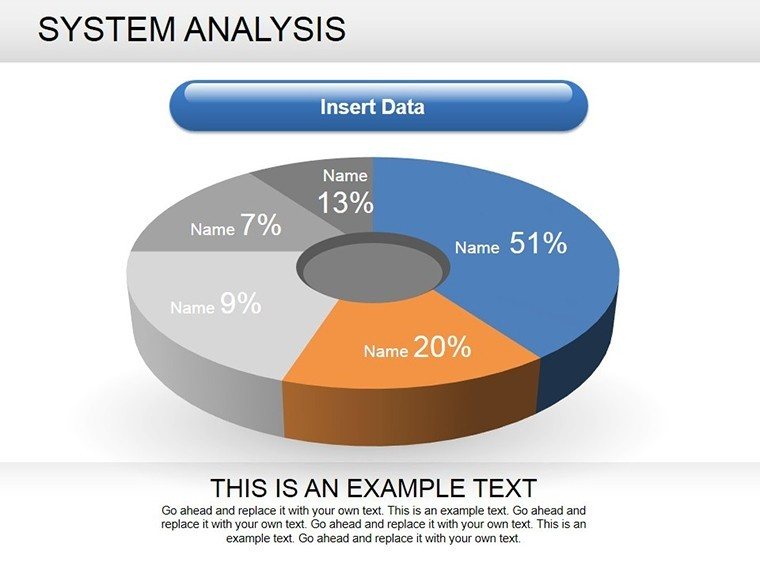
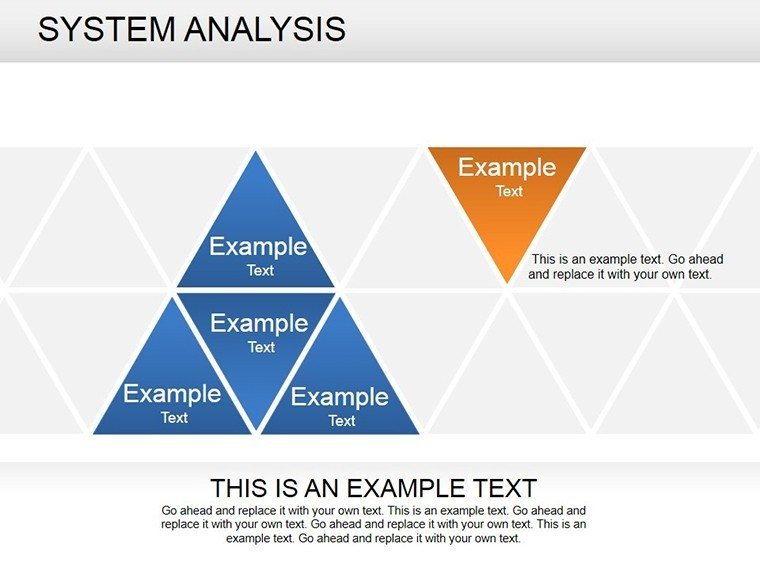
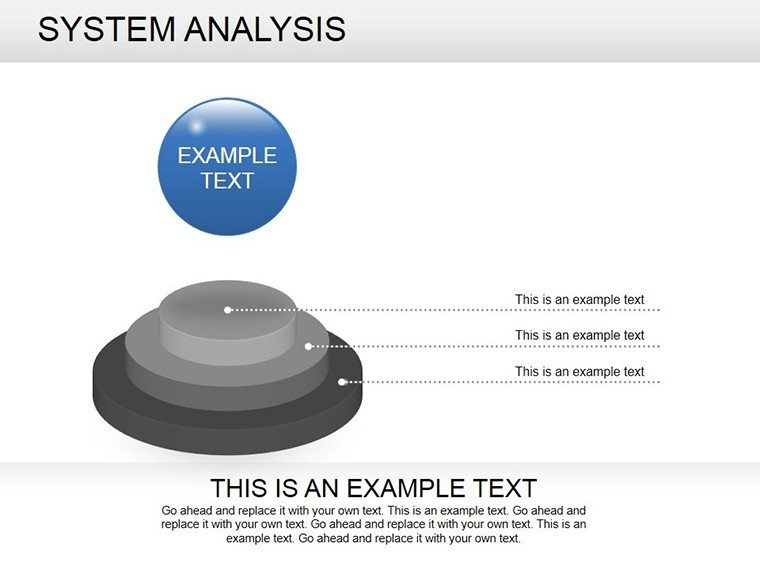
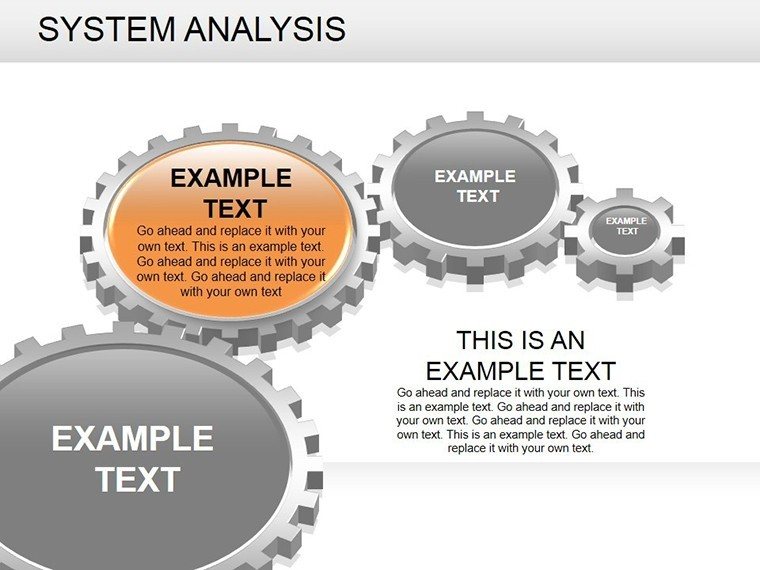
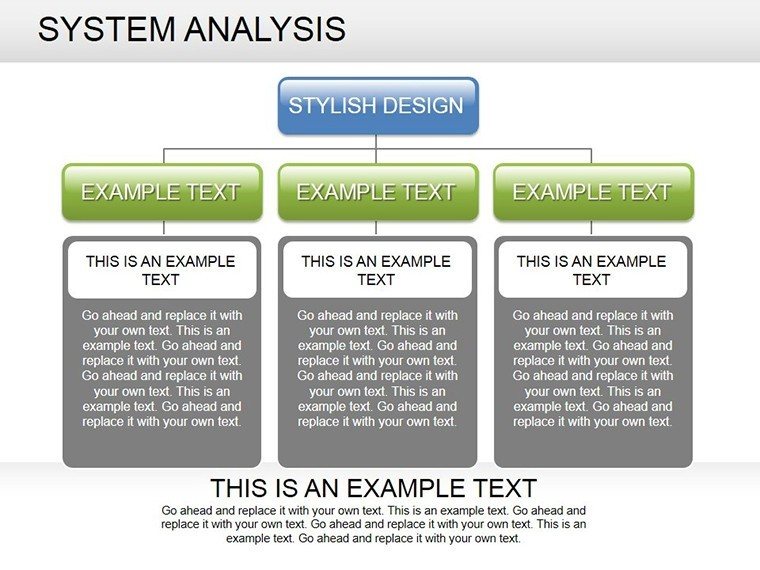
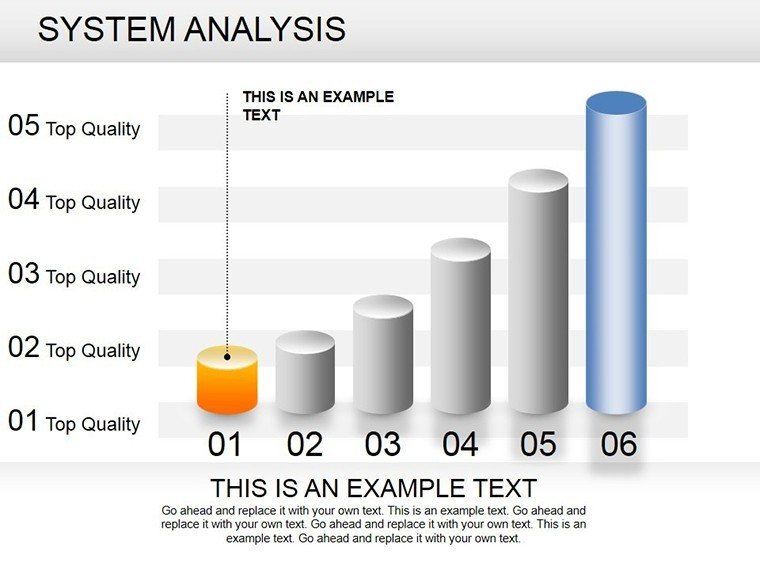
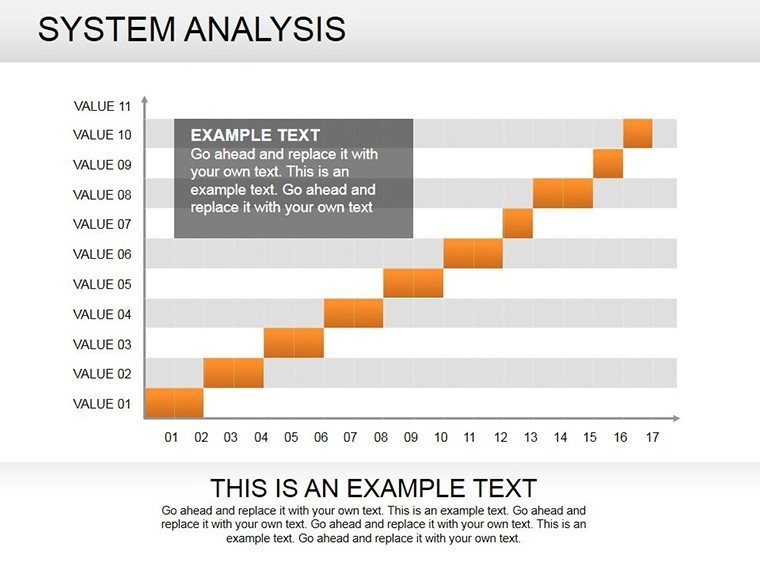
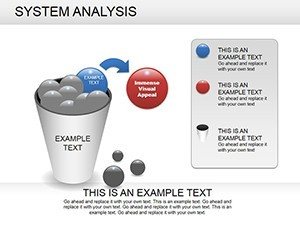
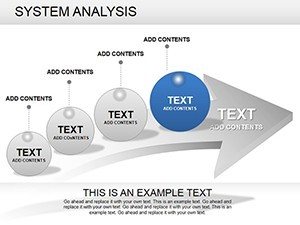
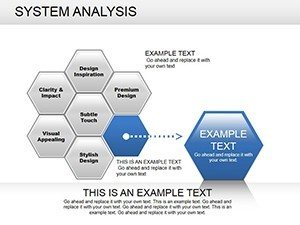
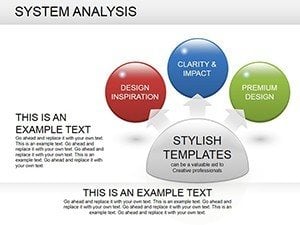
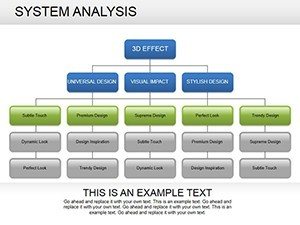
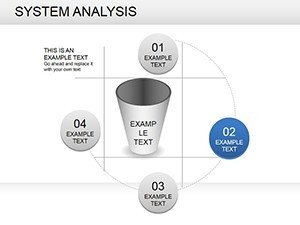
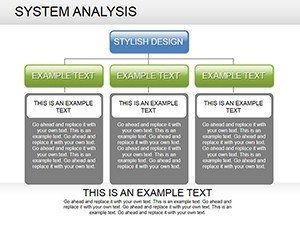
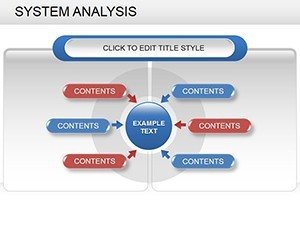
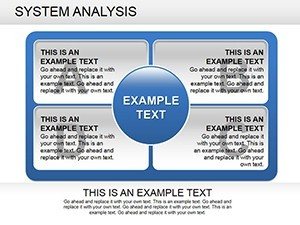
- Diverse Diagram Arsenal: 19 slides spanning pies for allocations, flows for sequences, 3D for depths, pyramids for structures, and spheres for holistics.
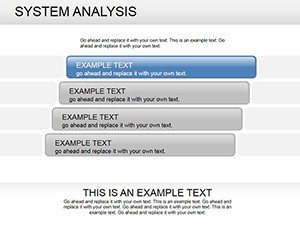
- Seamless Editability: Vector graphics that resize flawlessly, with text boxes that auto-adjust for lengthy descriptions.
- Icon-Infused Variety: 40+ process icons (arrows, gears, nodes) to denote steps without verbosity.
- Transition Magic: Preset animations that cascade elements, mimicking real-time system flows.
Outshining vanilla PowerPoint shapes, which demand manual alignment, this saves hours while boosting professionalism.
Applying Diagrams to Everyday System Challenges
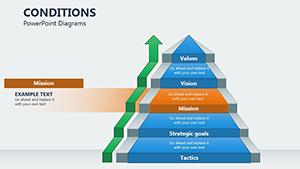
Take a retail chain optimizing inventory: Employ the pyramid slide to layer supplier tiers, apexing at stock levels. Edit metrics on-the-fly to simulate disruptions, revealing resilience gaps.
In software dev, a flow diagram on Slide 7 outlines CI/CD pipelines, with branches for error handling - vital for scrum retrospectives. For HR systems, spheres interconnect roles, exposing silos that hinder collaboration.
- Define Scope: Outline your system's boundaries.
- Choose Diagram Type: Match to intent - flow for linearity, pie for portions.
- Populate and Refine: Input variables, calibrate visuals.
- Iterate with Feedback: Animate to test narrative flow.
Such sequences echo ITIL frameworks, where visualization precedes validation.
Insider Hacks for Deeper Insights
Hyperlink diagram elements to appendices for drill-downs, or color-code by risk (red for vulnerabilities). In a NIST-aligned security review, this approach clarified threat vectors, enhancing audit scores.
Elevate Above Standard Tools
Default diagrams lack depth; ours deliver dimension with 3D renders that engage without gimmicks. Cross-compatible with Visio exports, it's a bridge for hybrid teams.
Unlock systematic success - get the System Analysis PowerPoint Diagram template and architect presentations that process perfection.
Frequently Asked Questions
Q: What diagram types are covered?A: Pies, flows, 3D, pyramids, spheres - tailored for diverse system views.
Q: Is it suitable for IT and non-IT systems?A: Yes, from tech stacks to org structures.
Q: Animation options?A: Built-in sequences for step-by-step reveals.
Q: File specs?A: .PPTX, 19 slides, PowerPoint/Google Slides ready.
Q: Customization depth?A: Full - shapes, colors, data links.