Business Solutions PowerPoint Diagrams Template
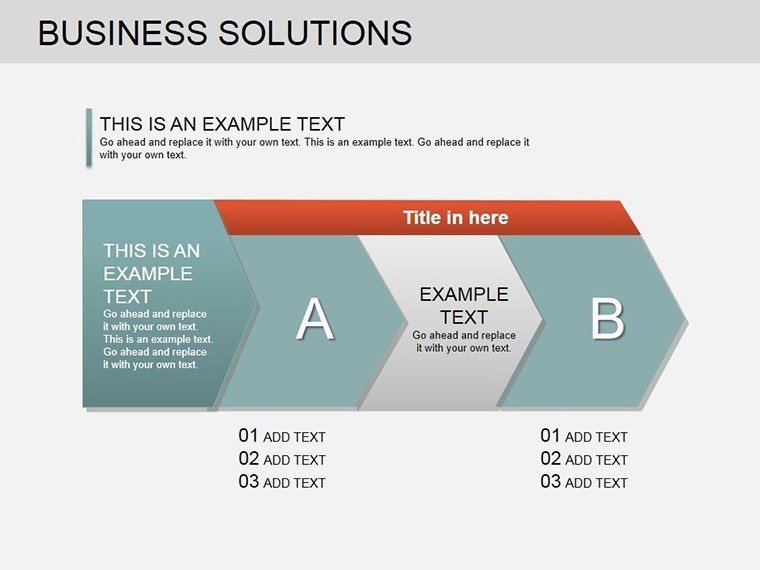


Every business presentation is a chance to solve a problem, spark innovation, or seal a deal - but only if your visuals cut through the clutter. The Business Solutions PowerPoint Diagrams Template delivers exactly that: 20 meticulously crafted, editable slides spanning cycles, processes, flows, tables, and arrows. Tailored for executives mapping strategies, marketers dissecting trends, or entrepreneurs pitching visions, this template turns raw ideas into polished narratives that command attention.
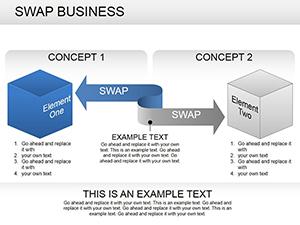
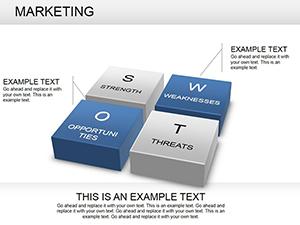
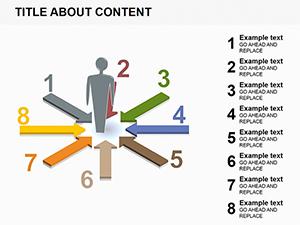
Picture a startup founder layering market data over a SWOT flow to captivate investors, or a sales lead using timeline arrows to forecast quarterly wins. These aren't generic shapes; they're purpose-built tools that adapt to your story, ensuring every slide advances your objective with elegance and precision.
Standout Features That Drive Results
What elevates this template is its blend of versatility and refinement - high-resolution graphics that render crisply on any projector, coupled with drag-and-drop editability that respects your time. Themes sync across slides for cohesive branding, and smart guides snap elements into alignment effortlessly.
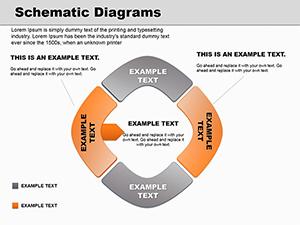
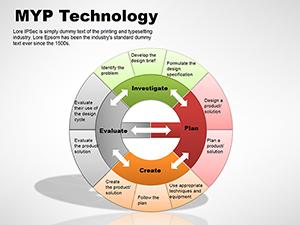
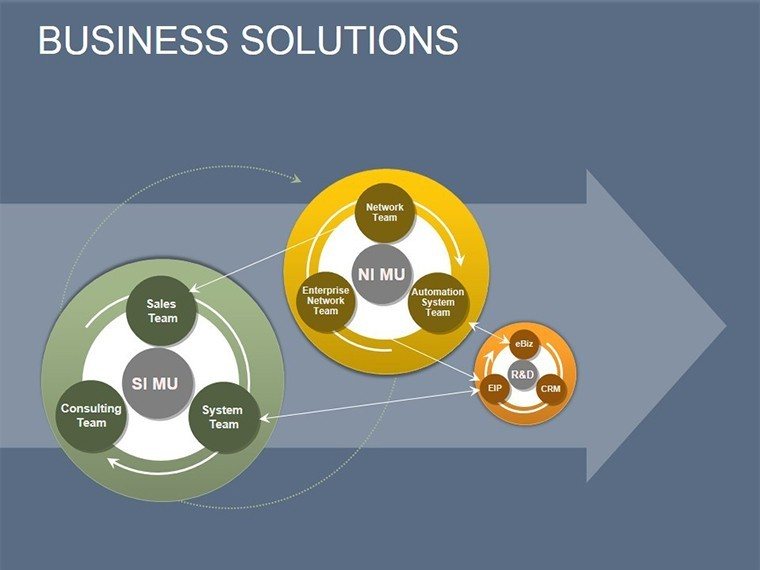
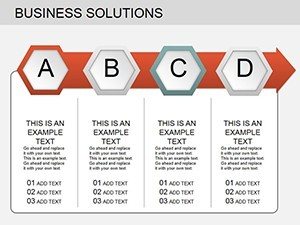
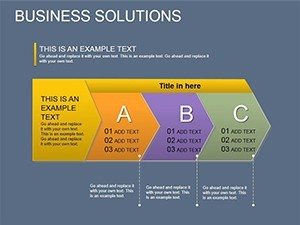
- Comprehensive Slide Variety: From cyclical strategy wheels to tabular comparisons, covering every angle of business discourse.
- Brand-Aligned Customization: Swap colors, fonts, and icons to mirror your corporate identity without starting from scratch.
- Time-Efficient Builds: Pre-animated transitions for flows that unfold naturally, saving hours on manual setups.
Rooted in proven design practices, like those echoed in Edward Tufte's data visualization ethos, these elements prioritize clarity over ornamentation, making complex solutions feel approachable and authoritative.
Exploring the Included Slides
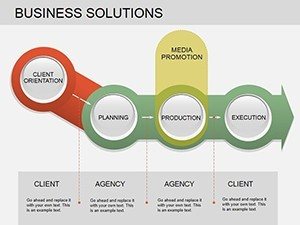
The template's arsenal equips you for full-spectrum storytelling. Slide 1's company overview table sets a professional tone, while Slide 6's project timeline arrow chains critical paths with milestone markers.
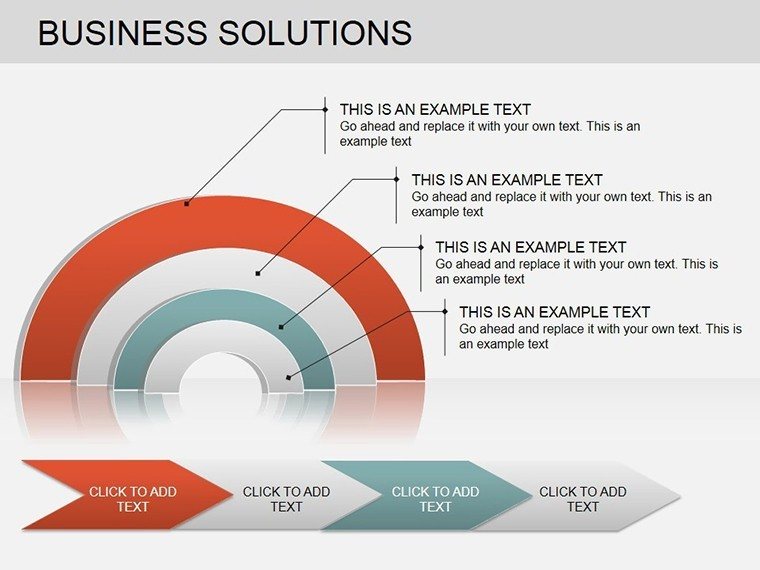
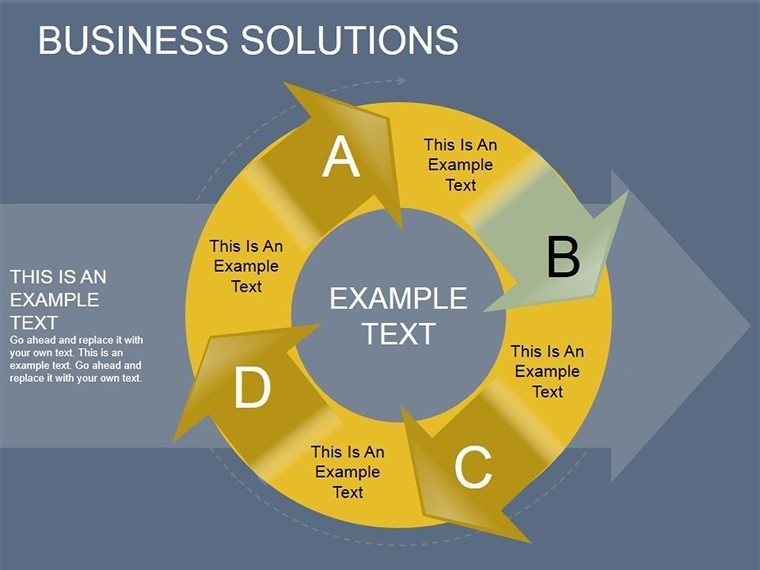
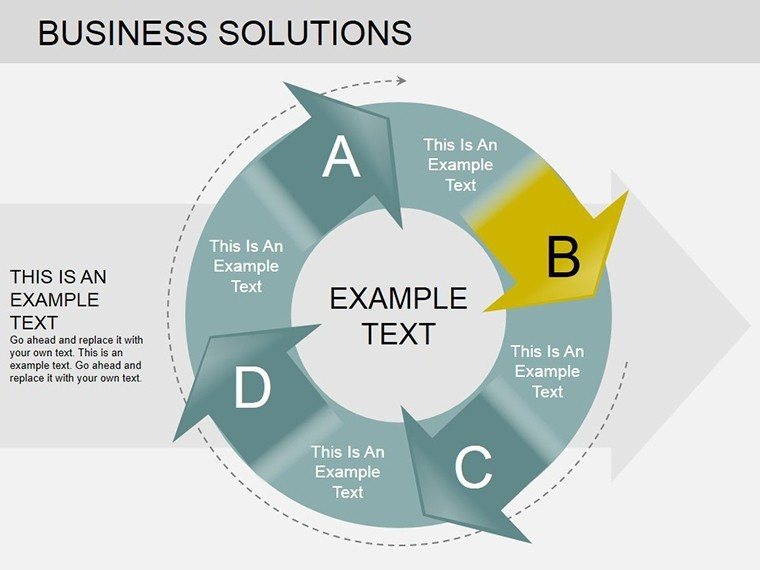
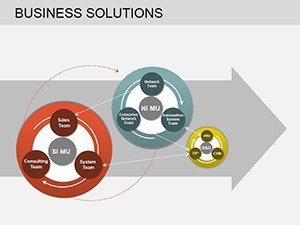
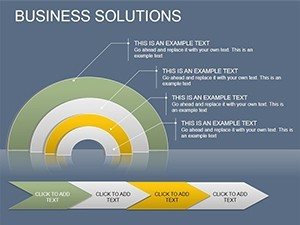
- Strategic Foundations (Slides 1-5): Overview tables and cycle diagrams for high-level planning, like annual goal-setting.
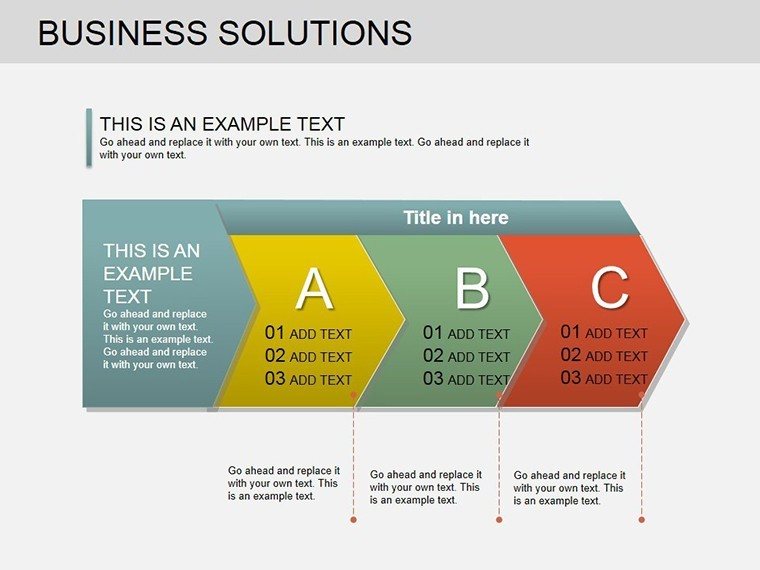
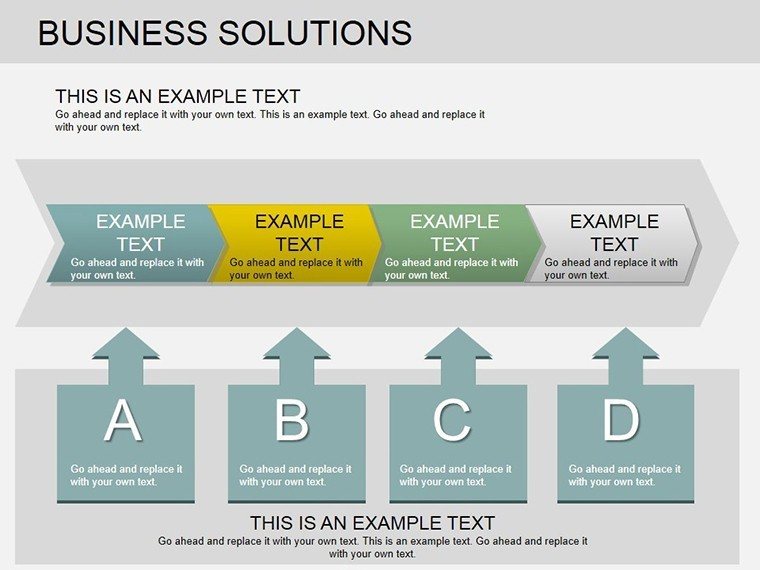
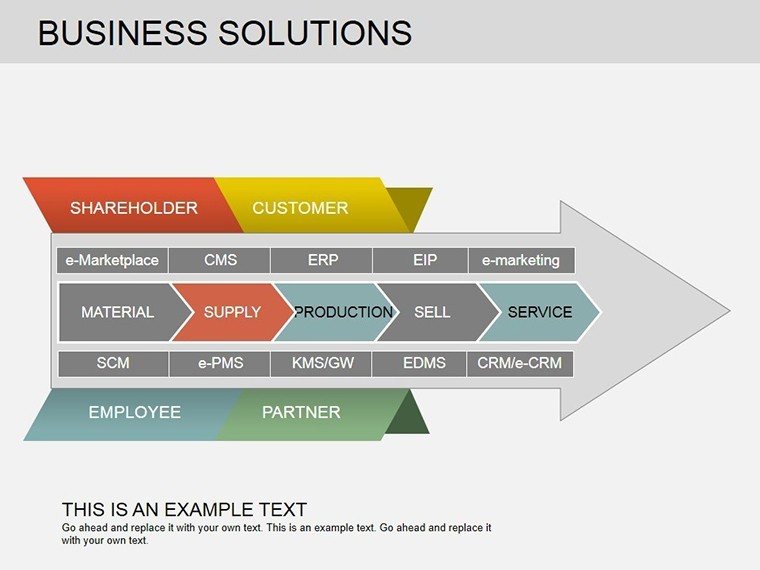
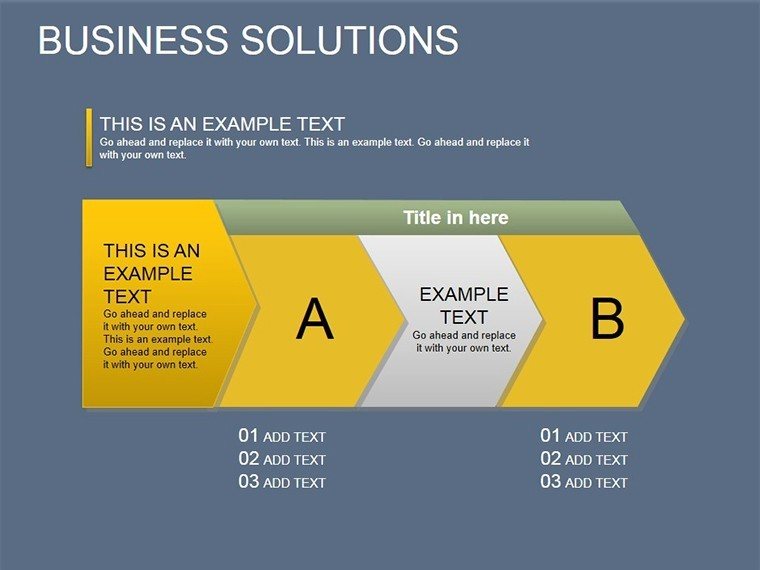
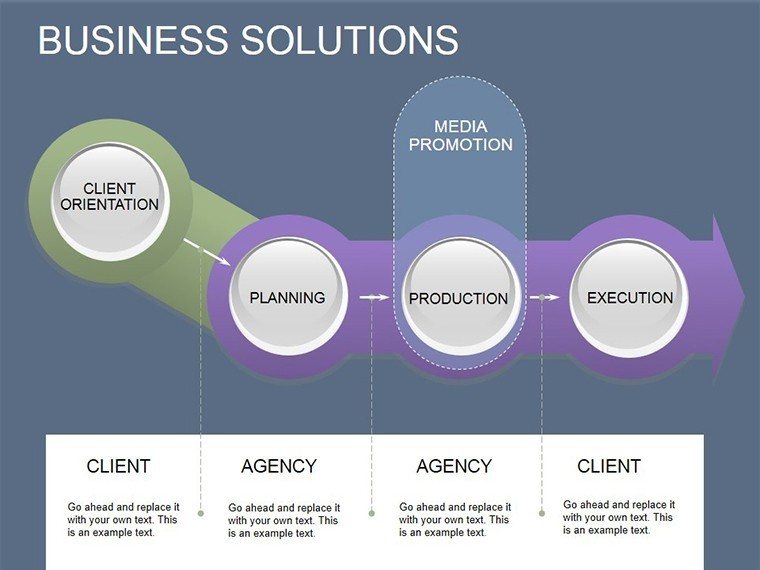
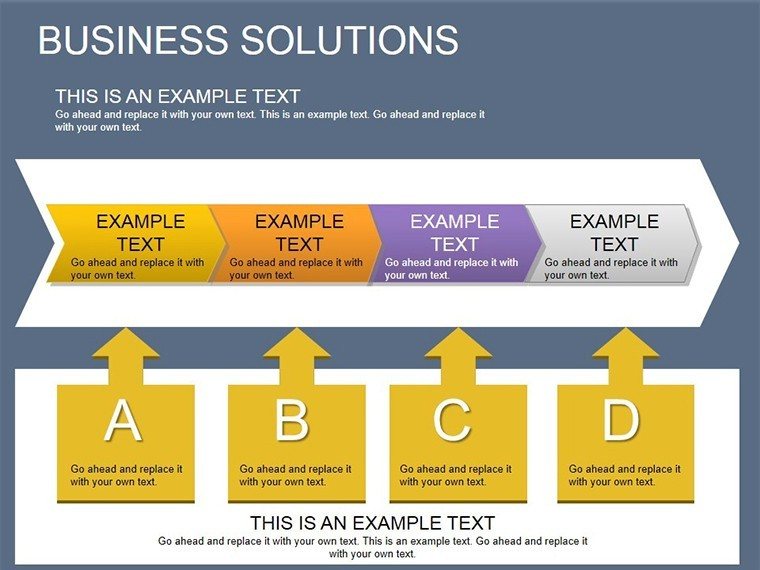
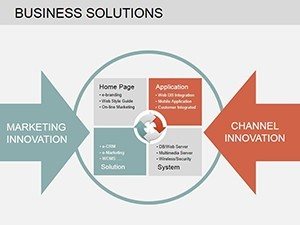
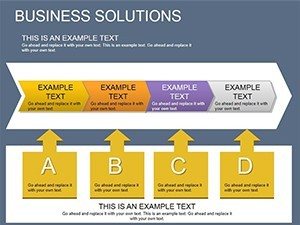
- Analytical Depths (Slides 6-10): Flow arrows and process maps for market dives or operational audits.
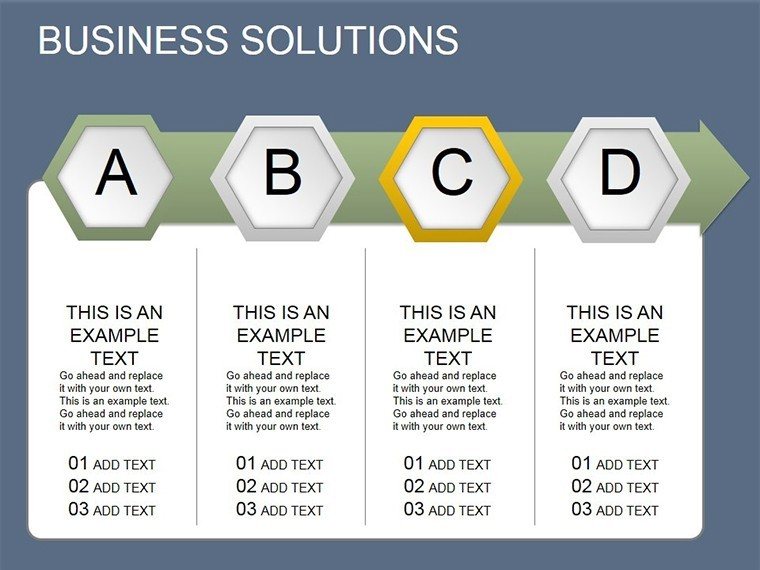
- Performance Trackers (Slides 11-15): Bar-integrated tables for financials or KPI dashboards.
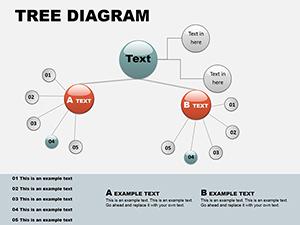
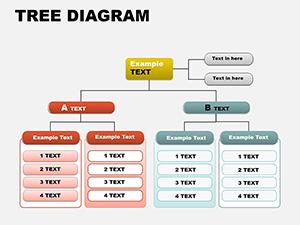
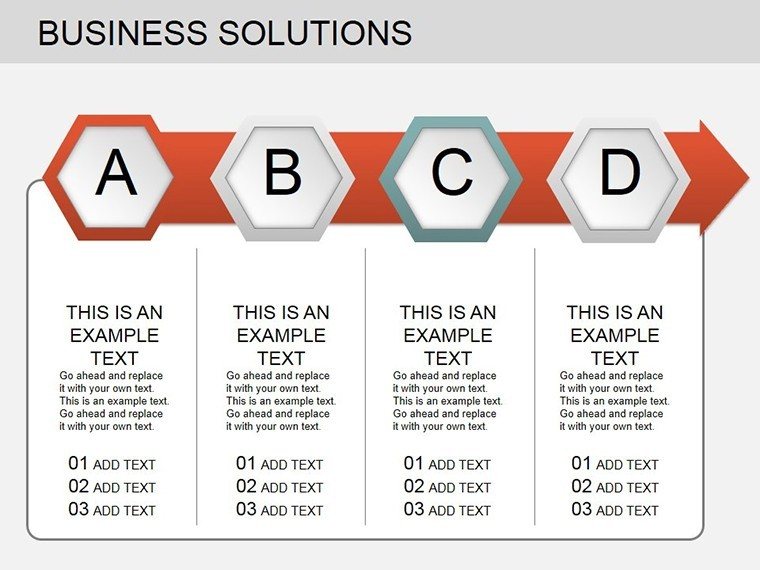
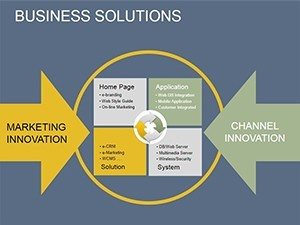
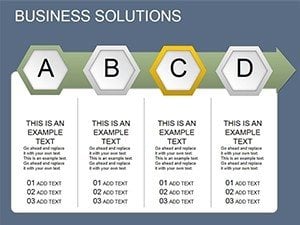
- Structural Insights (Slides 16-20): Hierarchical arrows for org evolutions or solution architectures.
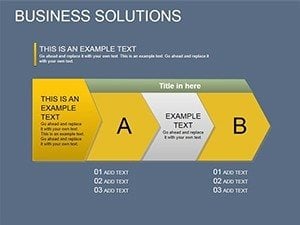
Tweak a slide's flow by selecting arrow segments - resize, recolor, or add data labels in moments. An HR director could repurpose Slide 14's org chart for talent pipeline visuals, streamlining recruitment talks with visual logic.
Versatile Applications Across Business Scenarios
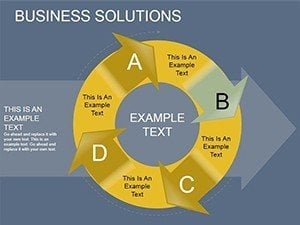
This template shines in high-stakes environments: Investor pitches where cycle diagrams illustrate growth loops, or team huddles using flow arrows to troubleshoot bottlenecks. Consultants favor the tables for client recaps, condensing audits into digestible formats.
In educational settings, trainers deploy process slides for workshop agendas, mirroring how firms like Deloitte structure training modules for maximum retention. The arrows' directional cues guide eyes logically, turning passive viewers into active participants.
For workshops, print flows as handouts; for virtual calls, leverage hyperlinks within tables to jump to details - multimodal flexibility that keeps momentum alive.
Tailored Tips for Seamless Deployment
Begin by matching slide types to agenda beats: Use cycles for recurring themes, arrows for progressions. Calibrate text sizes for readability from afar, and test animations on slower machines. Collaborate via shared links, iterating on flows collaboratively - it's a process that fosters ownership.
A product team once used these for roadmap tables, aligning cross-functional input into a unified view that accelerated launches. Such stories highlight how targeted diagrams foster alignment.
Enhancing Your Presentation Arsenal
Works flawlessly with PowerPoint 2016+, integrating with Excel for live data pulls or Visio for advanced imports. Export to Google Slides if needed, preserving vector integrity.
It's more than slides - it's a catalyst for clearer thinking and bolder actions.
Empower your next meeting with structure. Download the Business Solutions PowerPoint Diagrams Template for $23 and solve with style.
Frequently Asked Questions
What types of diagrams are covered?
Cycles for loops, processes for sequences, flows for journeys, tables for data, and arrows for directions - all business essentials.
How customizable are the color schemes?
Fully - edit via the color theme picker to match any palette, with auto-updates across slides.
Can I add my own images to the slides?
Yes, drag images into placeholders or tables, resizing proportionally with smart guides.
Is it compatible with older PowerPoint versions?
Optimized for 2016+, but backward-compatible features ensure broad usability.
How do the animations work?
Subtle wipes and fades on paths; adjust timing in the Animation pane for pacing control.