Different Graphics PowerPoint Diagrams: Embed and Impress


Struggling to embed meaningful visuals in your PowerPoint? The Different Graphics PowerPoint diagrams template delivers 14 editable slides, a treasure trove of graphs and tables ready for integration. Targeted at analysts, teachers, and executives, it simplifies embedding diverse diagrams into presentations, enhancing clarity and professionalism. Change colors, reposition elements - these aren't rigid; they're adaptable tools that address common design frustrations. With .pptx compatibility across Windows and Mac, you gain quick access to polished graphics, cutting creation time while boosting audience comprehension. From quarterly reports to classroom lectures, experience the perks: data-driven stories that resonate, fostering better decisions and engagement.
Core Features Enhancing Your Workflow
Explore the template's robust offerings: 14 slides with editable diagrams, emphasizing graphs for trends and tables for structured data. Standout elements include smart connectors for dynamic links, fillable cells in tables, and gradient options for graphs. Easily embed into existing decks via copy-paste, with no quality loss. This surpasses PowerPoint's native tools by providing themed consistency, like neutral palettes for corporate use, customizable to vibrant schemes. Benefits manifest in efficiency; for example, a sales analyst could embed a table-graph combo to show quarterly performance, drawing from Gartner reports on visual data's 50% faster processing.
Slide-by-Slide Insights
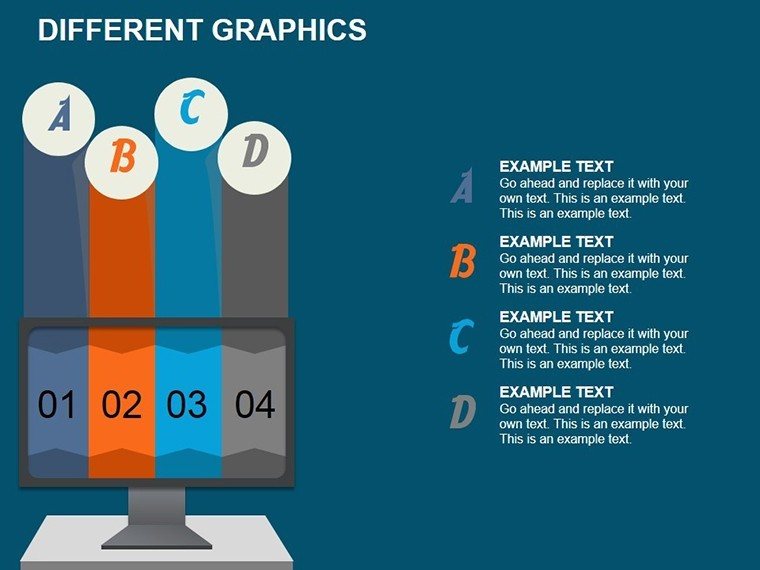
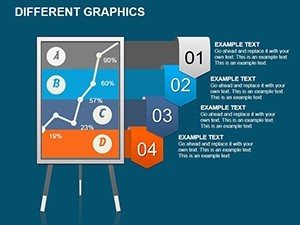
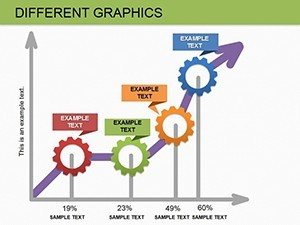
- Slide 1: Column Graph Comparator - Stacked columns for multi-category analysis.
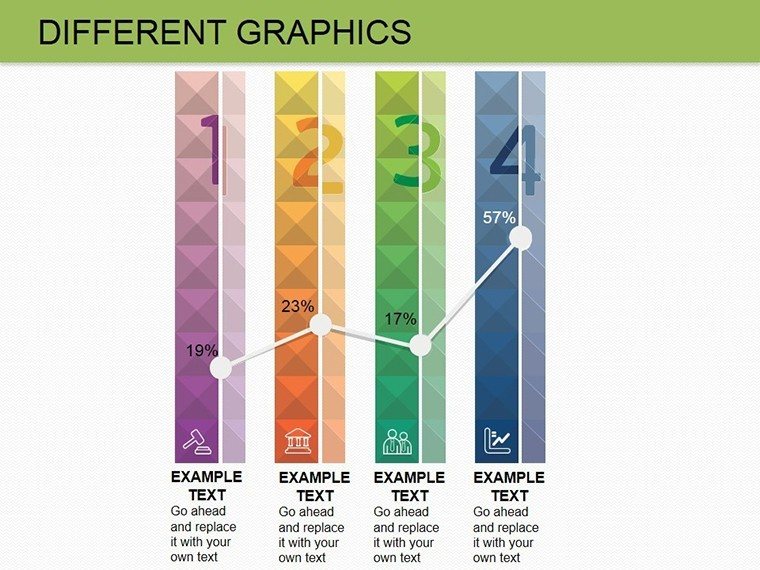
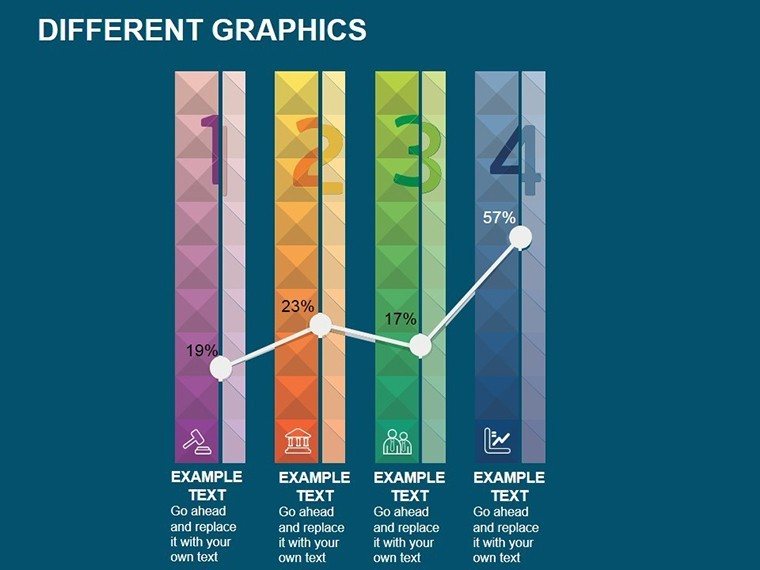
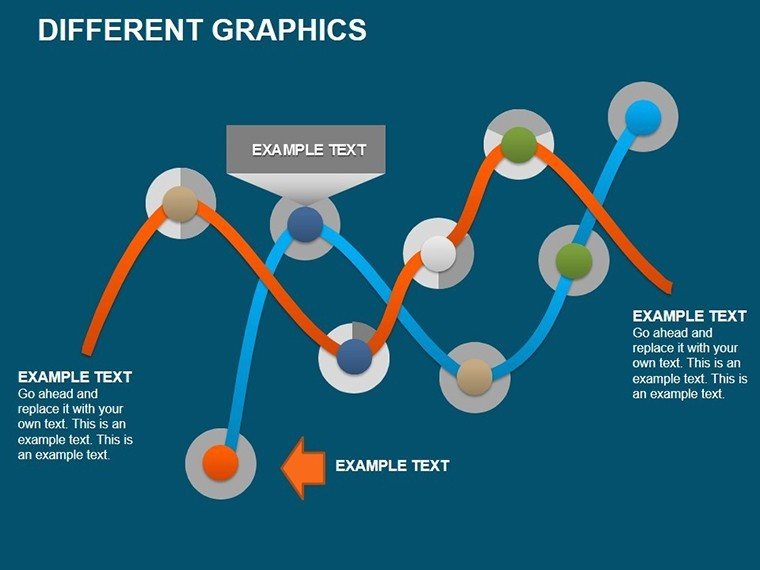
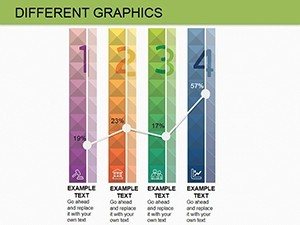
- Slide 2: Line and Bar Hybrid - Dual axes for layered insights.
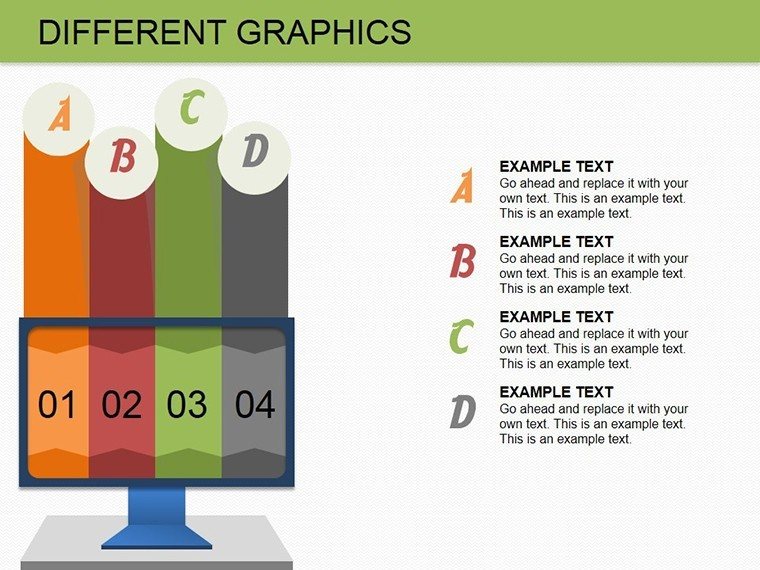
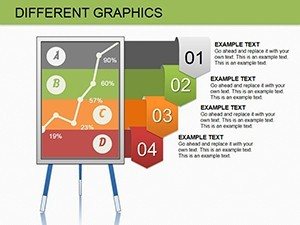
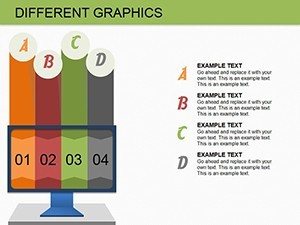
- Slide 3: Table with Embedded Chart - Data grid plus mini-graph for summaries.
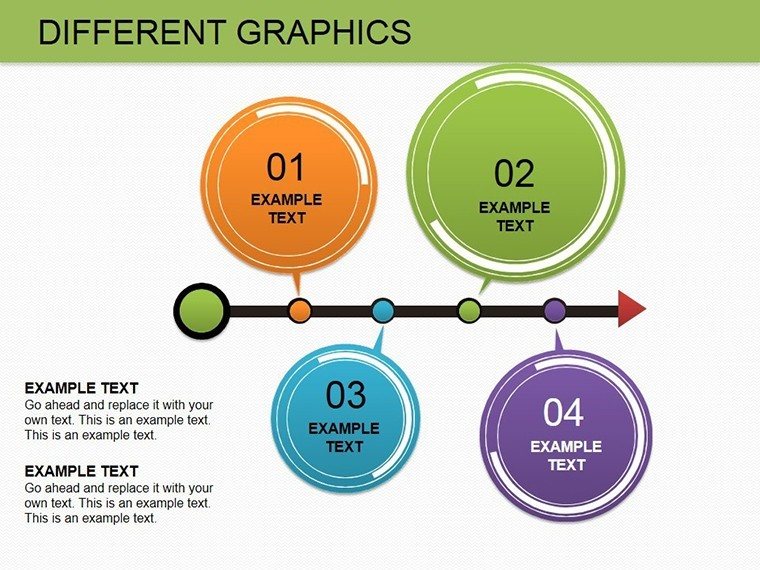
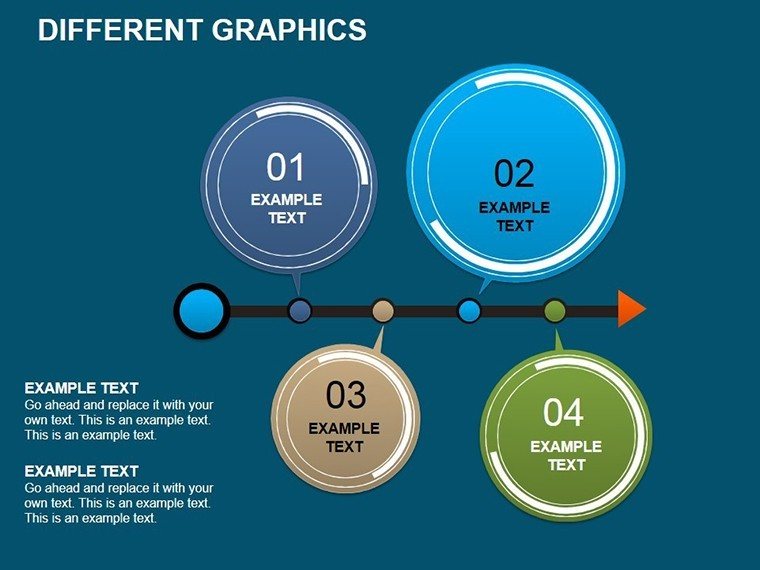
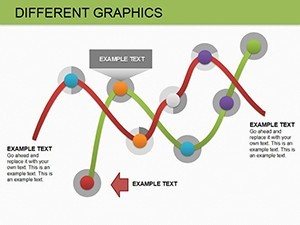
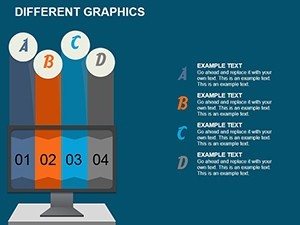
- Slide 4: Doughnut Distribution - Hollow circles for part-whole relations.
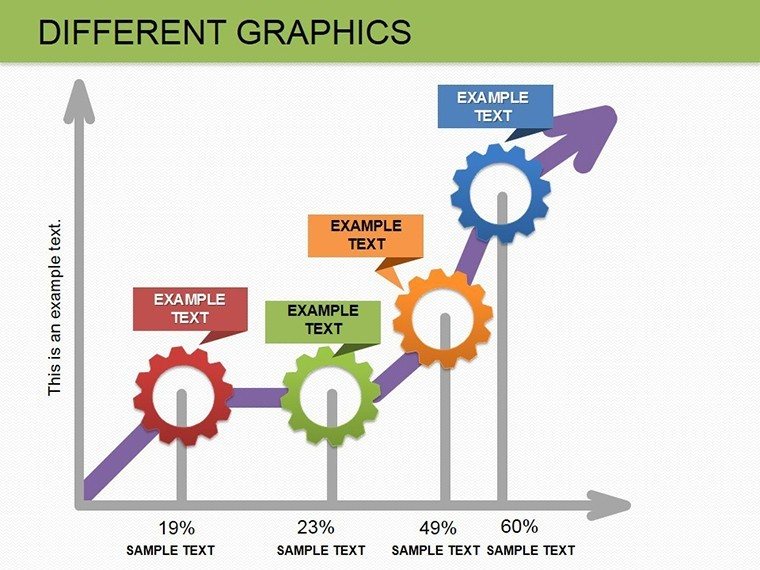
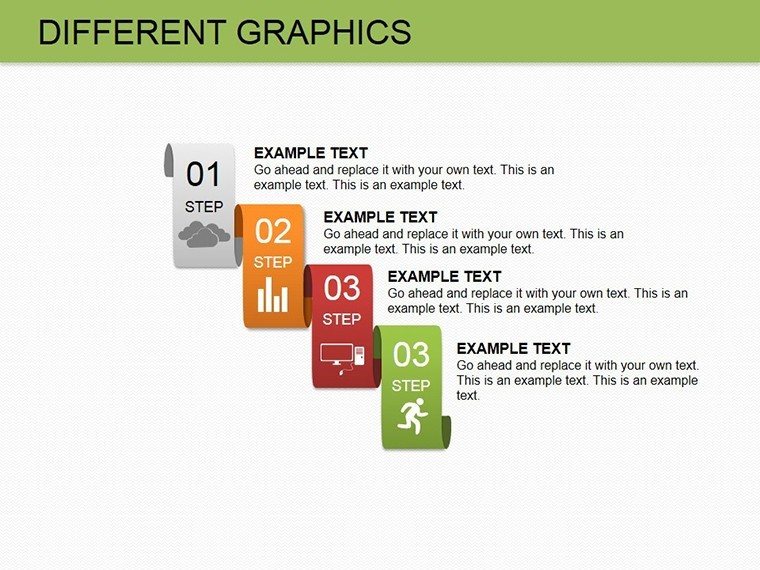
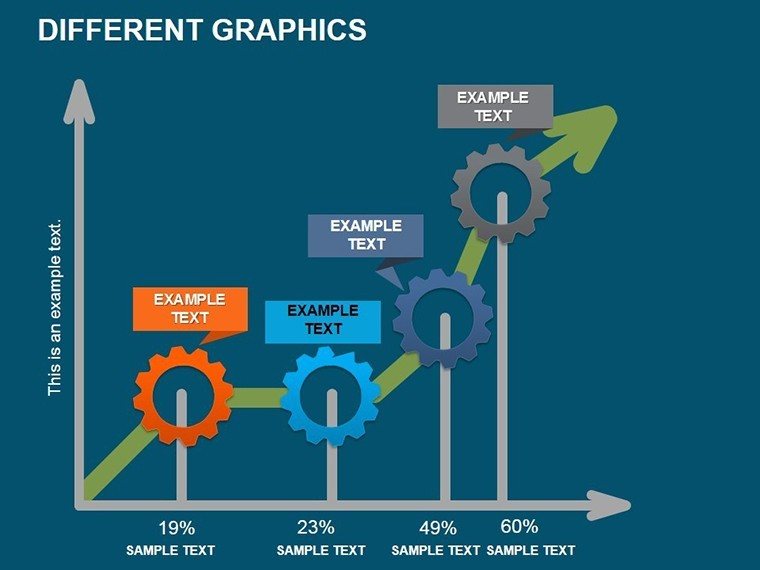
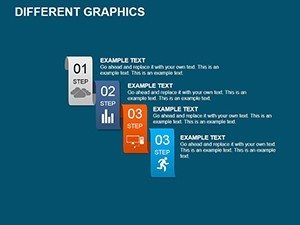
- Slide 5: Waterfall Progression - Steps showing increments/decrements.
- Slide 6: Pivot-Style Table - Dynamic fields for data manipulation.
- Slide 7: Histogram Frequency - Bars for distribution patterns.
- Slide 8: Matrix Table - Grids for comparisons like pros/cons.
- Slide 9: Combo Chart Master - Mix lines, bars, areas.
- Slide 10: KPI Dashboard Table - Metrics with conditional formatting.
- Slide 11: Pareto Principle Graph - 80/20 rule visuals.
- Slide 12: Calendar Table - Monthly layouts with embeddable events.
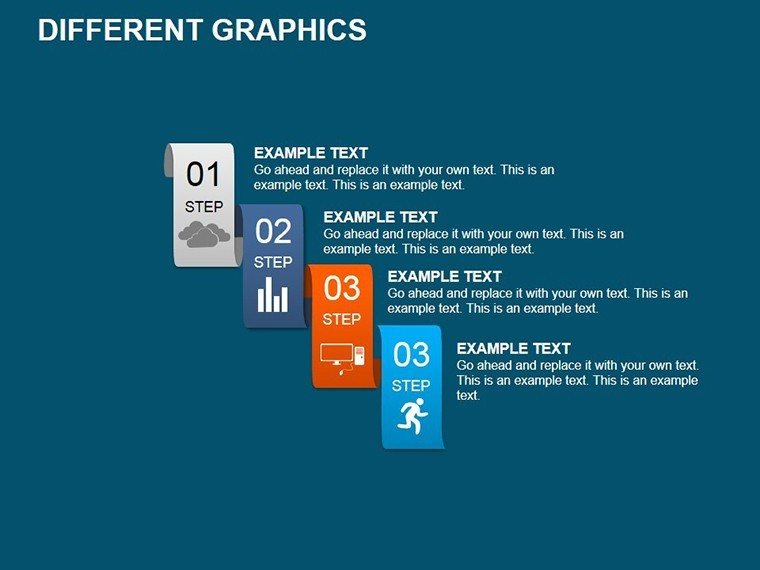
- Slide 13: Flowchart Table Integration - Processes linked to data tables.
- Slide 14: Blank Canvas Builder - Start fresh for custom embeds.
Embed Slide 3 in a report to juxtapose numbers and visuals seamlessly.
Dynamic Applications for Real Impact
Utilize across scenarios: In finance, embed waterfall graphs for budget breakdowns, as in a Forbes-featured case where visuals clarified variances. Teachers can integrate tables for lesson plans, making concepts accessible. For project managers, Pareto graphs highlight priorities. Outshining free alternatives, this offers embed ease with PowerPoint's data tools linkage. Tips: Use quick styles for theme matching, and animate embeds for phased reveals. Workflow: Drag into slide, edit data, position, and present - streamlined for success.
Embedding Tutorial Steps
- Import template into PowerPoint.
- Copy desired diagram, paste into your presentation.
- Update content: Fill tables, adjust graph scales.
- Reposition and resize as needed.
- Save and test in slideshow mode.
This resolves embedding woes, ensuring cohesive, professional outputs.
Distinctive Benefits and Assurance
This collection excels in utility, informed by data standards from sources like McKinsey. Value: Instant embeds, versatile for any theme, with category links for more. Reliability: Clean, editable files. CTA: Embed excellence - acquire today. It's essential for diagram-driven storytelling.
Embed these graphics, and watch your presentations transform from ordinary to outstanding.
Frequently Asked Questions
- Ease of embedding?
- Very simple - copy-paste with full editability.
- Works with PowerPoint Online?
- Yes, cloud-compatible for collaborative edits.
- Best for which data types?
- Quantitative like sales, qualitative like strategies.
- Animation support?
- Built-in for graphs and tables.
- Export formats?
- PPTX, PDF, images - versatile outputs.
- Scalable for large datasets?
- Yes, expandable tables and graphs.