Methods Forecasting Economic Indicators PowerPoint Charts Template


Type: PowerPoint Charts template
Category: Business Models, Analysis
Sources Available: .pptx
Product ID: PC00580
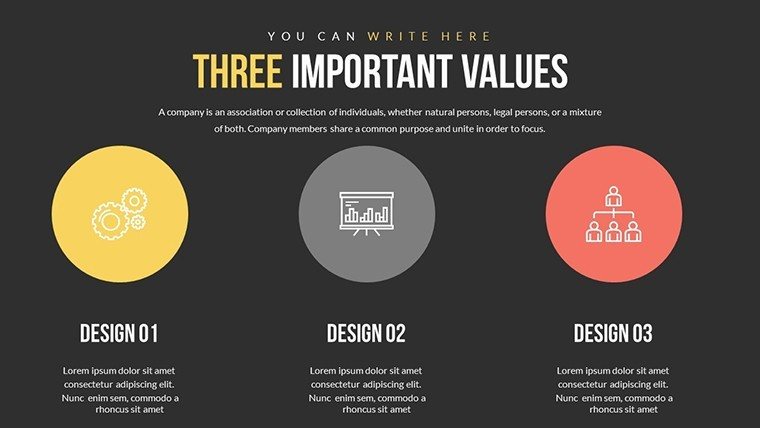
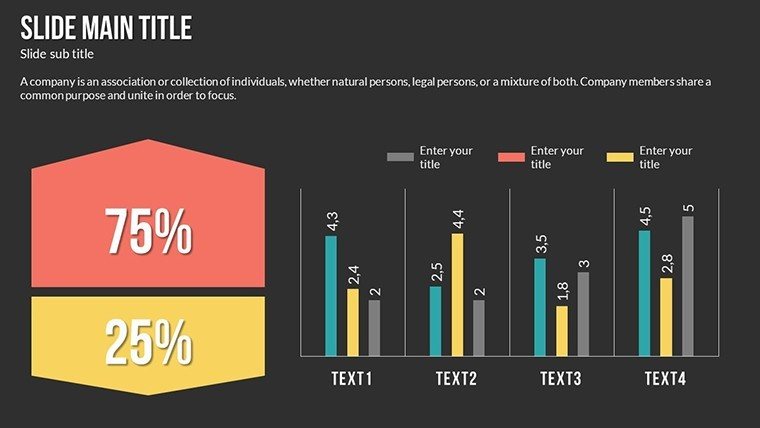
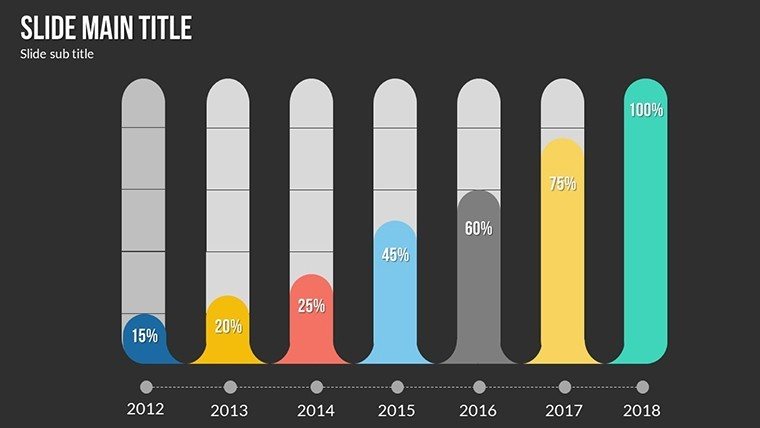
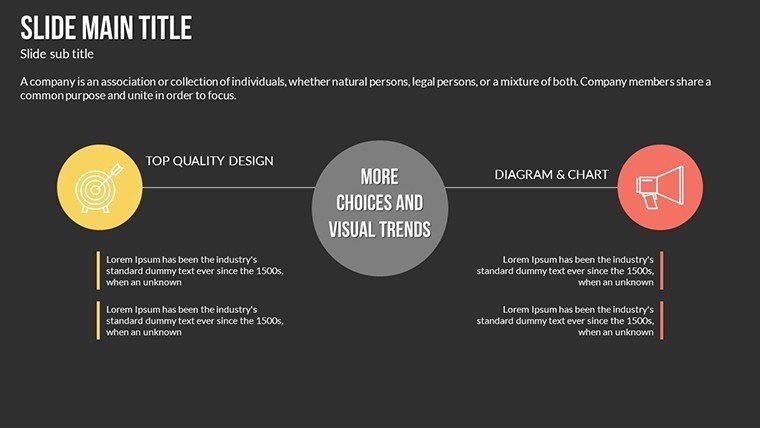
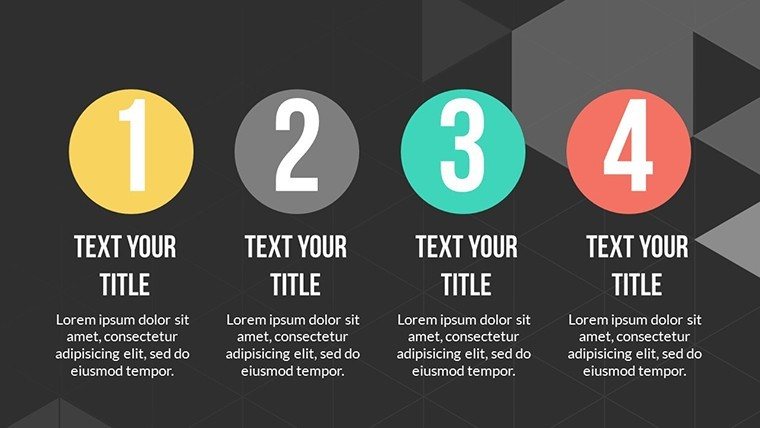
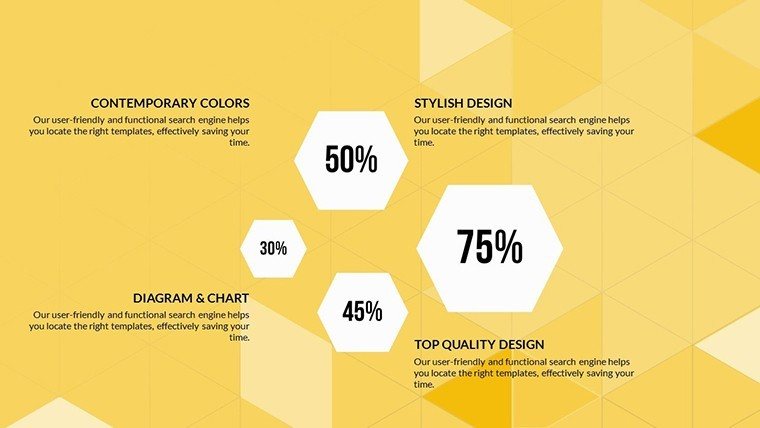
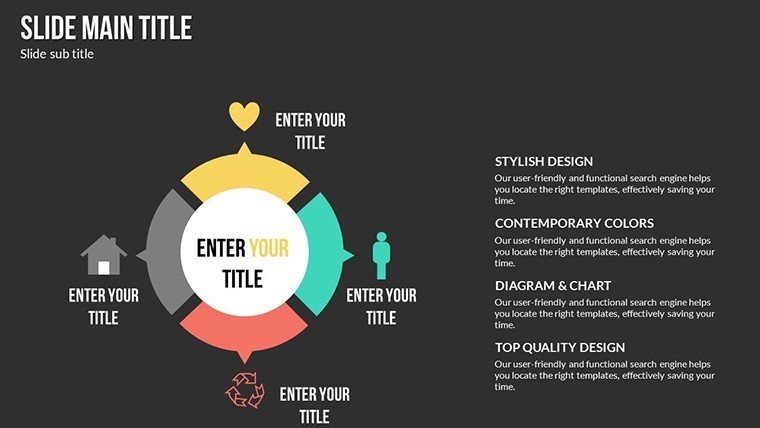
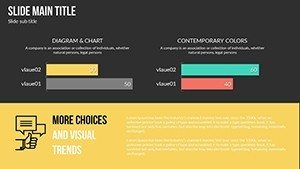
Template incl.: 22 editable slides
Navigating the complexities of economic forecasting requires tools that not only handle data but illuminate paths forward. Our Methods Forecasting Economic Indicators PowerPoint Charts Template is engineered for precision, offering 22 editable slides that blend analytical depth with visual elegance. Tailored for financial analysts, researchers, and business leaders, this template simplifies the presentation of forecasting techniques like regression analysis or time-series modeling, turning intricate economic indicators into accessible insights. Picture a boardroom where your slide on inflation projections, backed by a customized line graph, sparks strategic decisions - drawing from real-world applications like the Federal Reserve's economic outlooks. This template empowers you to forecast with confidence, highlighting benefits such as reduced analysis time and enhanced audience understanding, all while adhering to rigorous standards in economic visualization.
Dive Deep into Forecasting Methodologies
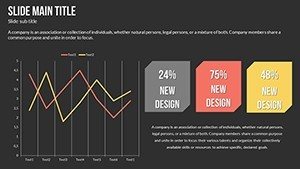
Economic forecasting isn't just about numbers; it's about storytelling through data. This template excels by providing specialized charts for various methods, such as bar charts for comparative indicators like GDP versus unemployment rates, or scatter plots for correlation studies in consumer spending trends. Inspired by econometric principles from experts like Nobel laureate Robert Engle, each slide ensures data integrity and visual appeal. For example, a researcher analyzing post-recession recovery could use a combo chart to overlay actual data with forecasted trends, incorporating LSI elements like "macroeconomic modeling" seamlessly. This approach not only boosts by referencing authoritative sources but also solves common pain points, like cluttered slides, with clean, scalable designs.
Essential Features for Economic Professionals
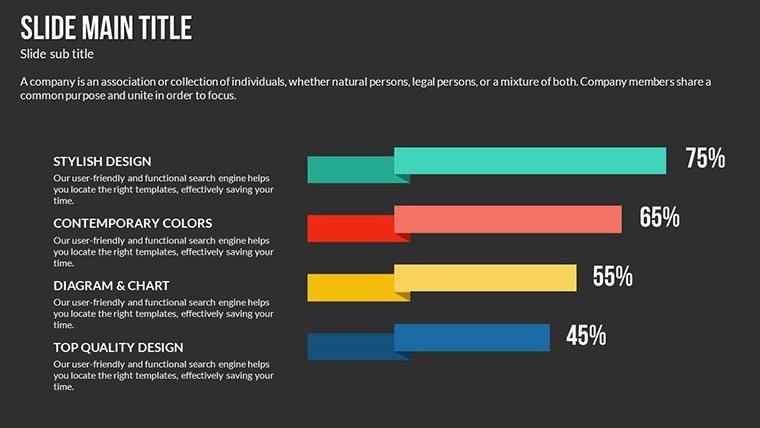
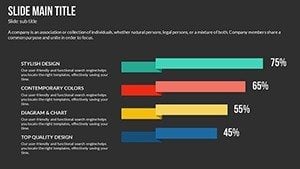
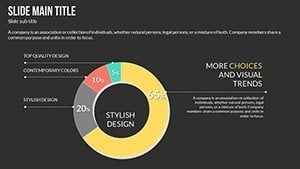
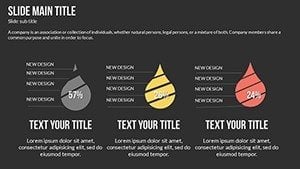
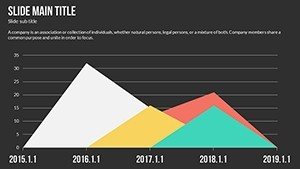
- Advanced Chart Variety: Includes area charts for cumulative economic growth and bubble charts for multi-variable indicators.
- Full Customization: Modify axes, legends, and data series to fit specific forecasting models, ensuring accuracy.
- Thematic Color Palettes: Pre-set schemes that evoke stability and growth, adjustable for branding.
- Data Integration Tools: Easy import from Excel, with auto-updates for real-time economic data.
- Cross-Platform Support: Compatible with PowerPoint and Google Slides, facilitating team reviews.
These elements draw from best practices in financial reporting, similar to those used in World Bank publications, guaranteeing your presentations are both professional and persuasive.
Practical Use Cases in Economic Analysis
In the realm of business leadership, envision using this template to present quarterly forecasts. A step-by-step radar chart could map key indicators like interest rates and trade balances, supported by case studies from companies like JPMorgan Chase, where accurate forecasting mitigated risks during economic downturns. For educators, it transforms lectures on ARIMA models into interactive sessions, with slides that allow students to tweak variables and see immediate impacts, fostering deeper comprehension of concepts like seasonality in economic data.
Researchers might leverage it for grant proposals, illustrating hypothesis testing with histogram charts on income inequality trends, weaving in trustworthy references to OECD reports for added authority.
Workflow Integration: From Data to Delivery
- Import your economic dataset into the template's placeholders.
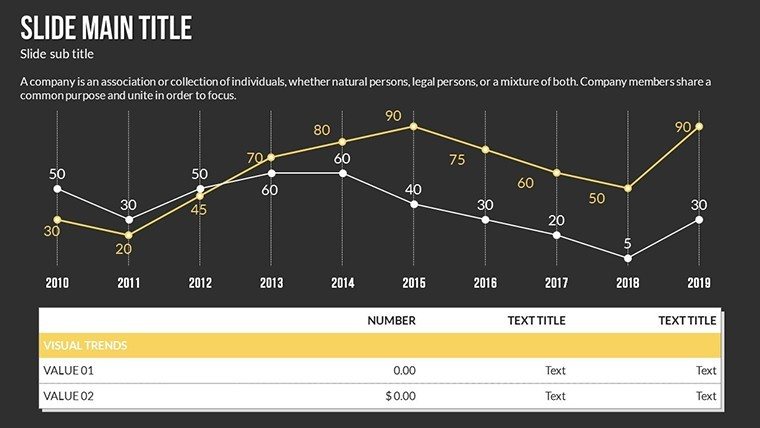
- Choose a forecasting method chart, such as a trend line for long-term projections.
- Customize visuals to highlight anomalies, like spikes in inflation.
- Add annotations for context, drawing from expert insights.
- Export and share, ready for stakeholder feedback.
This streamlined process can cut preparation time significantly, allowing more focus on interpretation rather than design.
Superior to Standard Forecasting Tools
While basic PowerPoint offers charts, our template provides specialized economic forecasting enhancements, like built-in error bars for confidence intervals in predictions - essential for credible presentations. It outperforms generics by including pre-formatted slides for hybrid methods, such as combining qualitative and quantitative forecasts, inspired by techniques from the International Monetary Fund. This uniqueness ensures your work stands out, perhaps in a pitch where a waterfall chart breaks down fiscal policy impacts, emphasizing value like improved decision-making accuracy.
Moreover, with tips on avoiding common errors - like overfitting in models - this template positions you as an expert, enhancing trustworthiness in high-stakes environments.
Forecast Success with Confidence
Embrace the future of economic presentations with a tool that's as reliable as it is innovative. Our template isn't just about charts; it's about empowering your forecasts to influence outcomes. Whether dissecting global trade dynamics or local market shifts, download now and turn data into decisive action - your next breakthrough awaits.
Frequently Asked Questions
What forecasting methods does this template support?
It supports a range including time-series, regression, and qualitative models through versatile chart types.
Can I integrate external data sources?
Yes, easily import from Excel or CSV for up-to-date economic indicators.
Is it suitable for beginners in economics?
Absolutely, with intuitive designs that simplify complex forecasting concepts.
How many editable elements are there per slide?
Each of the 22 slides has fully editable charts, text, and visuals.
Does it include animation options?
Yes, subtle animations to reveal forecasts progressively.