Social Networks for Business PowerPoint Charts


Type: PowerPoint Charts template
Category: Tables
Sources Available: .pptx
Product ID: PC00551
Template incl.: 21 editable slides
In the digital age, where connections drive commerce, mastering social networks for business is key to growth. Our Social Networks for Business PowerPoint Charts template equips you with 21 editable slides to graphically represent data dependencies and comparisons, turning social media metrics into actionable insights. Tailored for marketers, entrepreneurs, and digital strategists, it simplifies presenting platform performances, audience engagements, and ROI calculations, making your pitches as interconnected as the networks themselves.
With a focus on relational visuals, the template uses tables to map out follower growth or content virality, inspired by best practices from platforms like LinkedIn and Twitter. High-quality images and inscriptions ensure your message lands with impact, while full editability lets you infuse your brand's voice seamlessly.
Standout Features for Networked Success
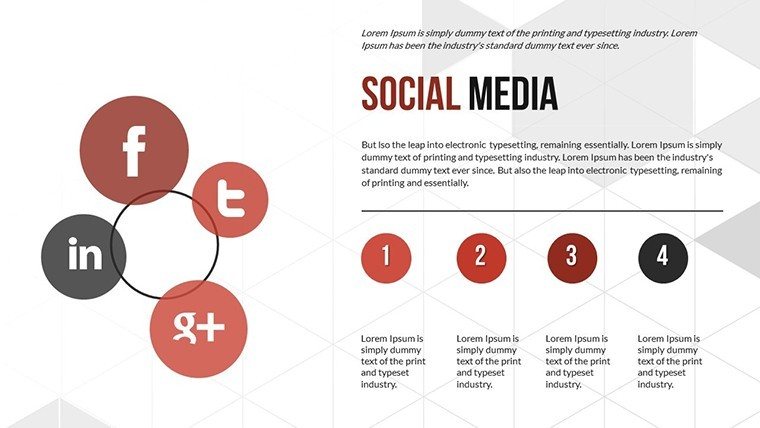
This template's power comes from its animation-rich design, allowing you to animate data flows that mimic social interactions. Change colors to reflect platform branding - blues for Facebook, reds for YouTube - and insert videos for demo purposes, expanding your presentation's reach.
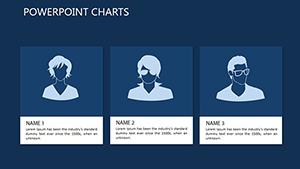
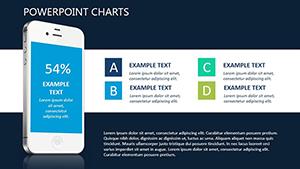
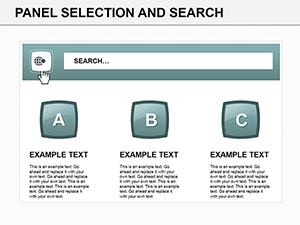
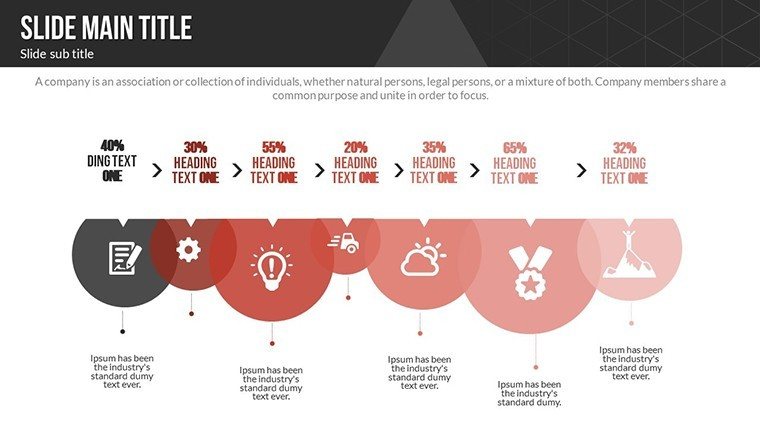
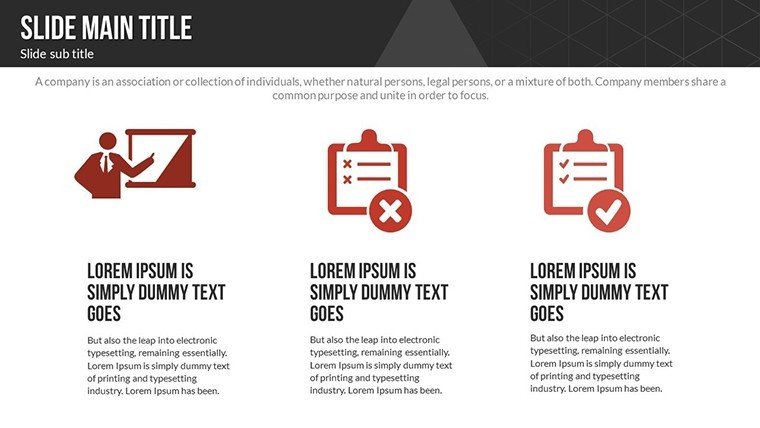
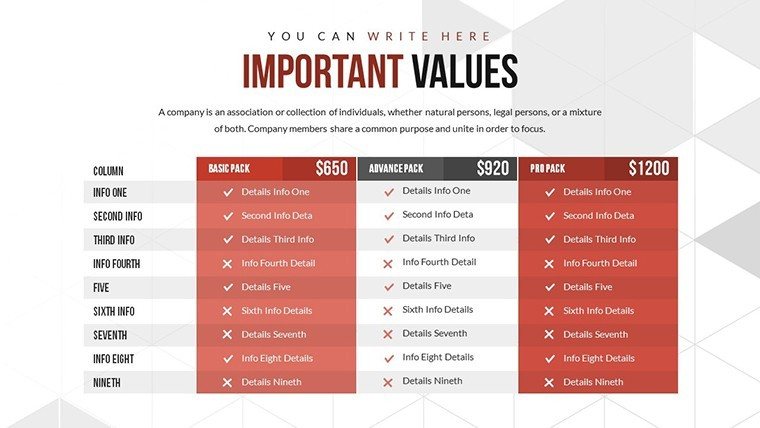
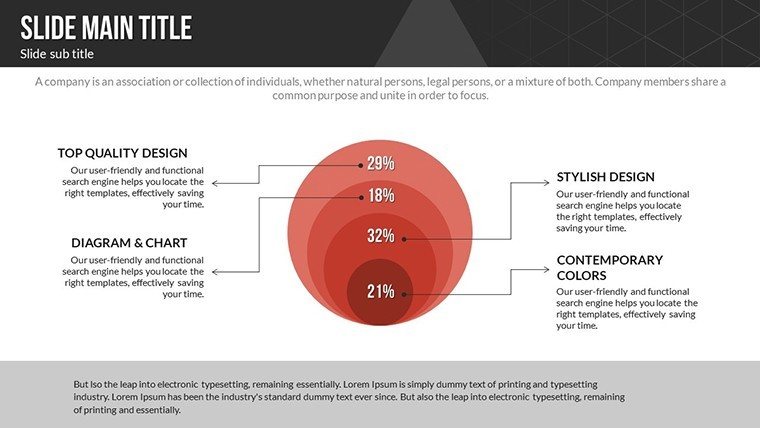
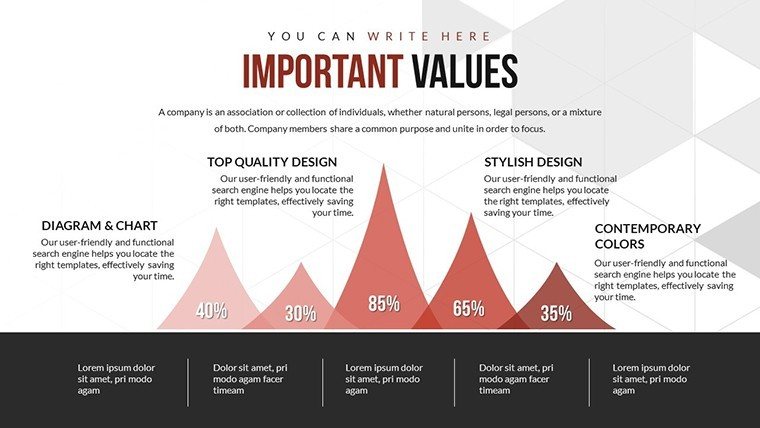
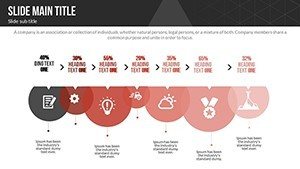
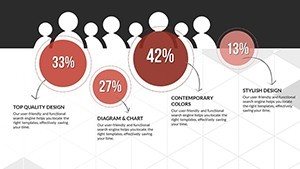
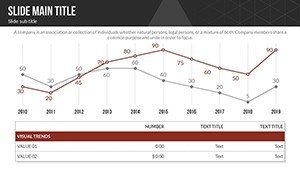
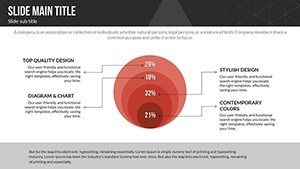
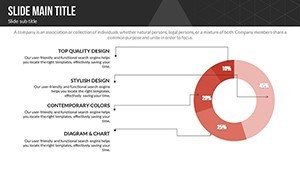
- Table-Based Charts: Compare metrics like engagement rates across channels, using grid layouts for clarity.
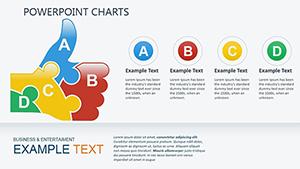
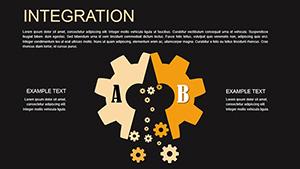
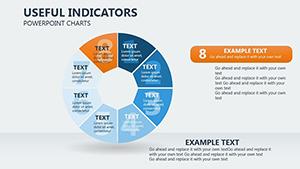
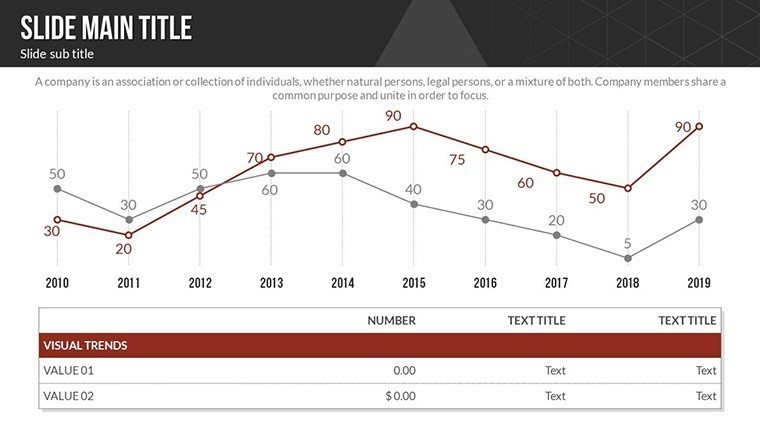
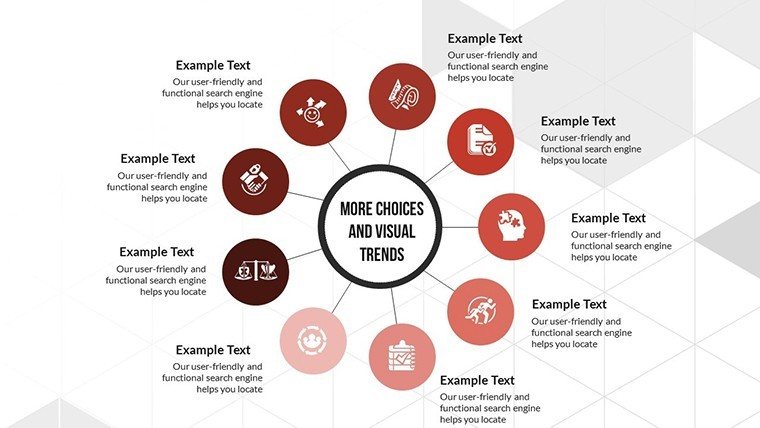
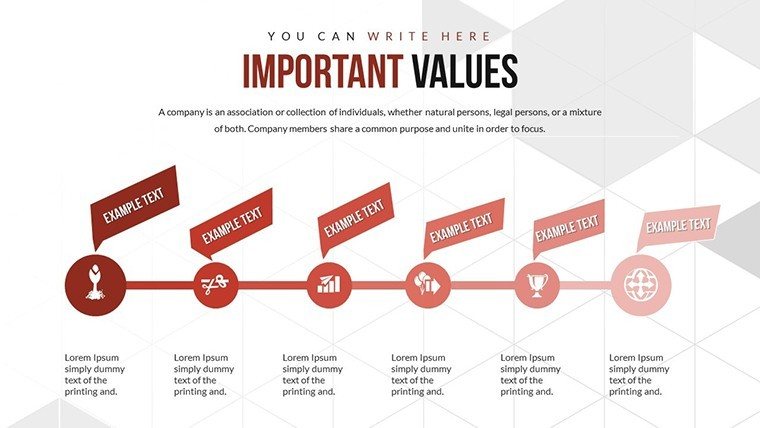
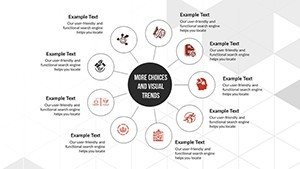
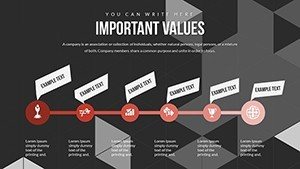
- Dependency Graphs: Show how one value influences another, such as ad spend versus conversions.
- Animation Effects: Custom sequences to reveal insights, keeping audiences hooked.
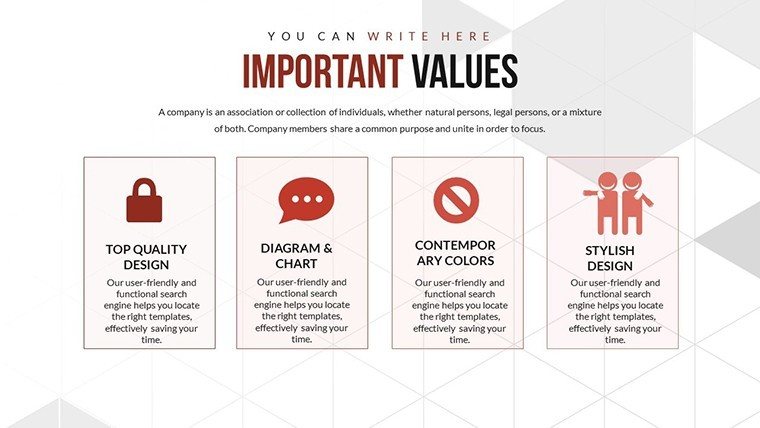
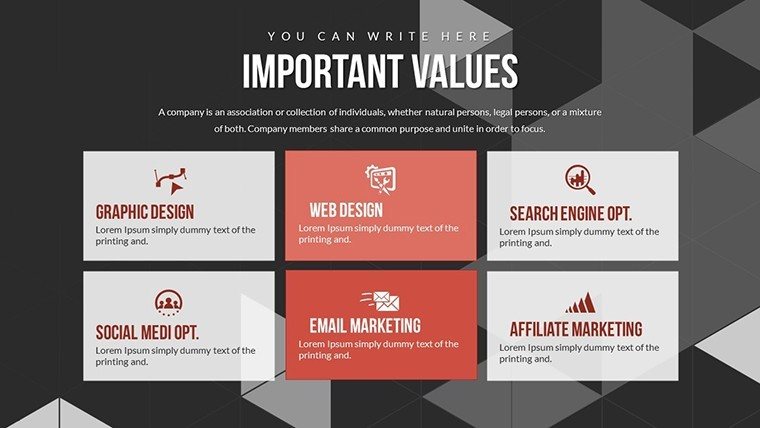
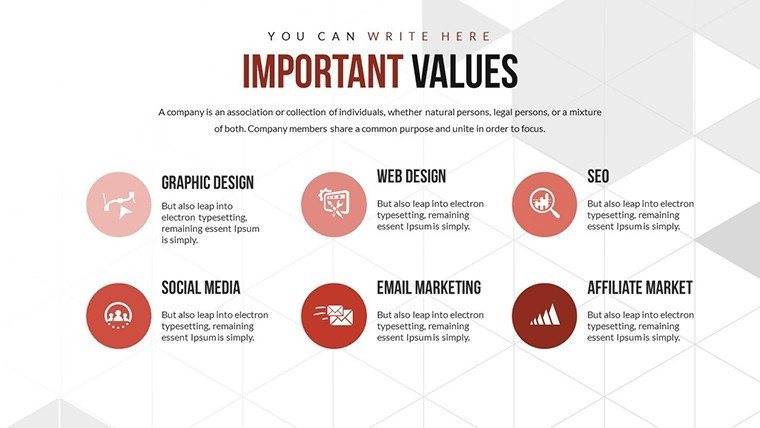
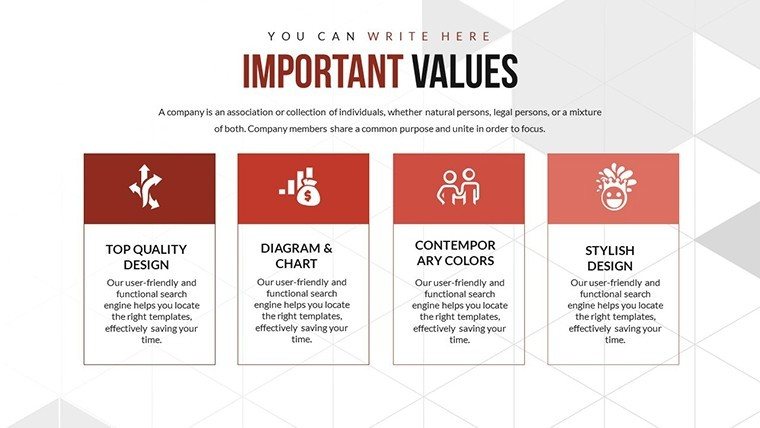
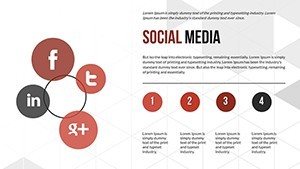
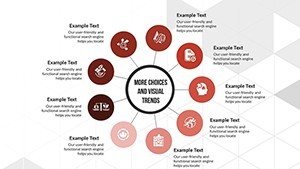
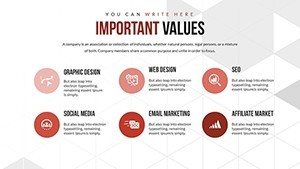
- Vector Icons: Social media symbols for intuitive navigation.
Drawing from HubSpot's inbound marketing methodologies, these features help avoid cluttered slides, focusing on value-driven content that boosts through expert-aligned visuals.
Applications in Digital Marketing Strategies
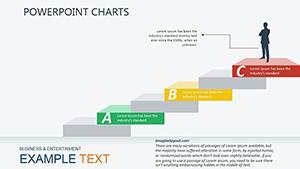
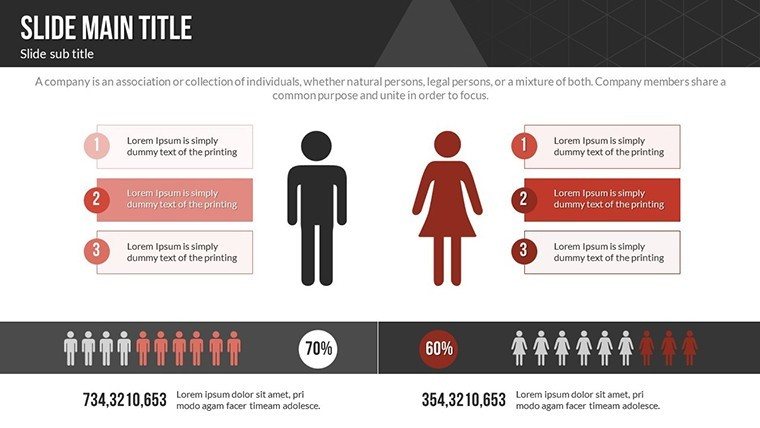
Picture crafting a social media audit for a client: Start with overview tables on Slide 3, detailing follower demographics, then use dependency charts on Slide 15 to link content types to engagement spikes. For startups, adapt for pitch decks showing network expansion plans, comparing organic versus paid growth.
In training sessions, educators can use it to teach social algorithms, with tables breaking down factors like post timing. This surpasses basic tools by offering business-specific LSI integrations, like "influencer collaborations" or "viral coefficients," naturally woven in.
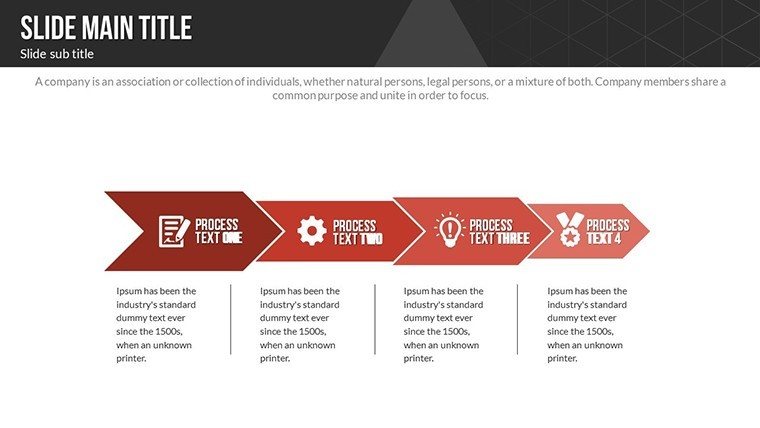
- Usage Workflow: Input data, customize tables, add animations for flow.
- Expert Tips: Cite sources like Social Media Examiner's reports for credibility.
- Core Benefits: Addresses comparison challenges, enabling faster strategy refinements.
A case from a digital agency: Using similar charts, they optimized a campaign, increasing leads by 35%, as per their analytics.
Connect Your Business Vision
This template bridges data and strategy, compatible on any computer. With JPG inclusions, sharing previews is simple.
Link up your success - download and start networking smarter today.
Frequently Asked Questions
- How do I customize the tables?
- Fully editable; adjust cells, colors, and text easily.
- Are animations included?
- Yes, custom effects for engaging reveals.
- Suitable for which businesses?
- Any leveraging social media, from e-commerce to B2B.
- What about compatibility?
- Works on PowerPoint and most computers.