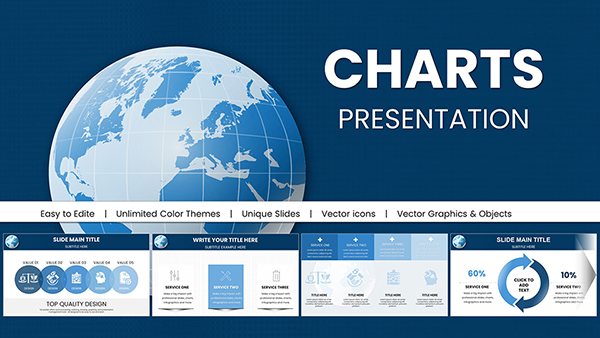
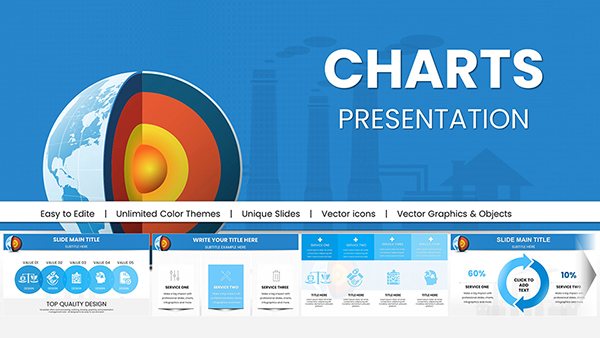
Interrelation PowerPoint Charts: Mapping Architectural Connections with Ease


Type: PowerPoint Charts template
Category: Business Models, Analysis
Sources Available: .pptx
Product ID: PC00543
Template incl.: 34 editable slides
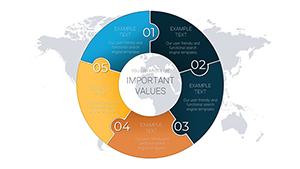
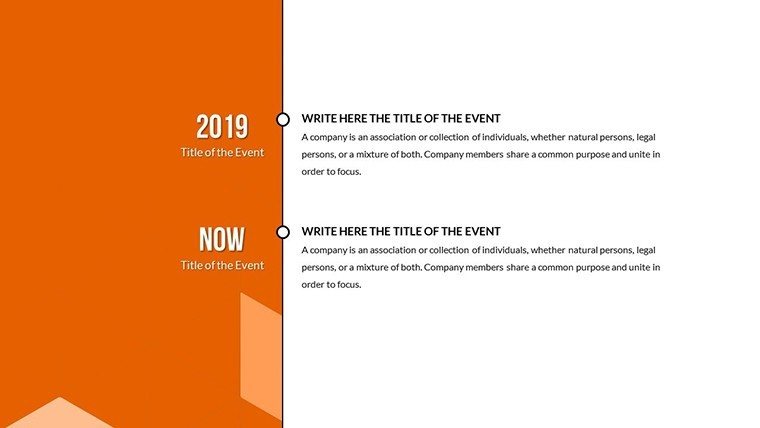
Architecture isn't just about bricks and blueprints; it's about the intricate web of relationships between elements like structural systems, environmental factors, and user flows. Our Interrelation PowerPoint Charts template empowers you to visualize these connections vividly, turning abstract ideas into actionable insights. Perfect for architects tackling multifaceted projects, this 24-slide collection includes flowcharts, network diagrams, and Venn overlaps, all fully editable for PowerPoint and Google Slides compatibility. Imagine streamlining a hospital design pitch by showing how patient pathways interlink with HVAC systems, adhering to AIA health facility guidelines. Priced at an accessible point, it features high-quality vectors, customizable animations, and seamless data integration, helping you communicate complexities without confusion. Whether in boardrooms or design studios, this tool fosters collaboration and innovation, drawing from real-world successes like the interconnected layouts in Foster + Partners' projects.
Why Interrelation Charts Transform Your Design Process
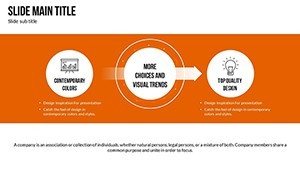
In today's collaborative architecture landscape, clarity in interdependencies can seal deals or spark breakthroughs. This template's versatile designs let you depict everything from site ecology interrelations to material supply chains. For example, in a sustainable skyscraper proposal, use network diagrams to illustrate how solar panels link with energy grids, boosting LEED scores. The user-friendly interface means no design degree needed - just drag, drop, and customize to fit your narrative.
Advantages shine in time savings: Pre-built elements cut creation time, letting you focus on refinement. Professional polish impresses, as seen in case studies where firms like Zaha Hadid Architects used similar visuals for parametric design explanations. Engage audiences with animated reveals that unfold connections step-by-step, making even dense data digestible.
Essential Features for Architectural Mastery
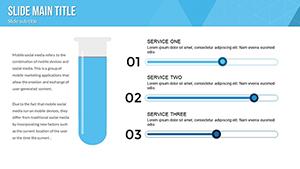
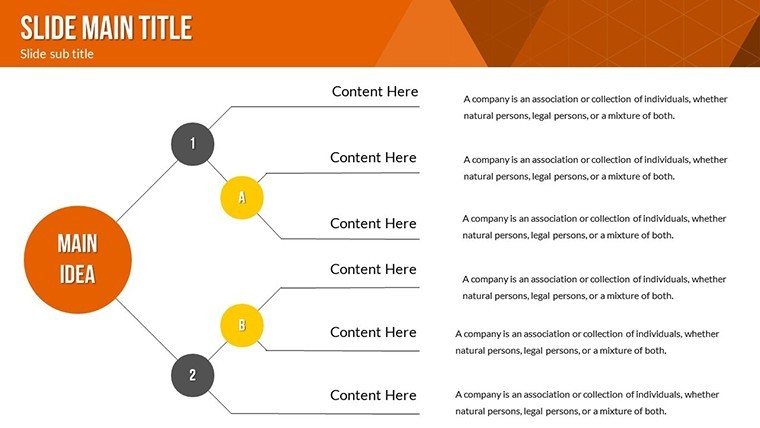
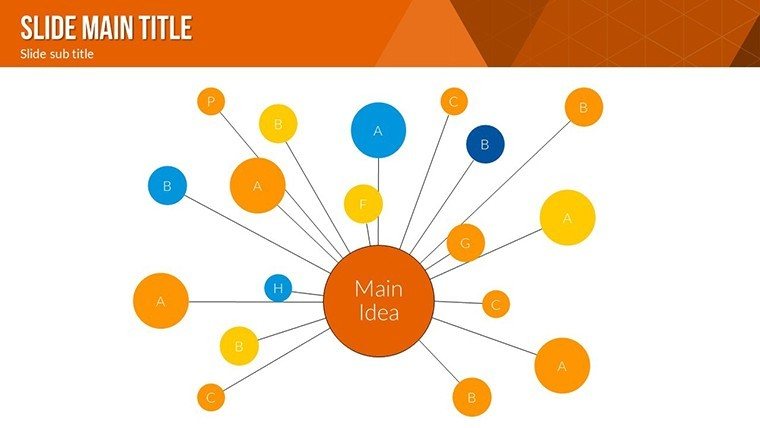
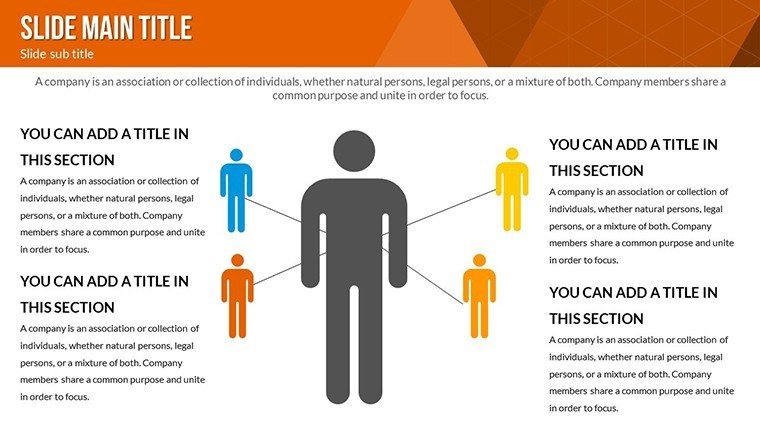
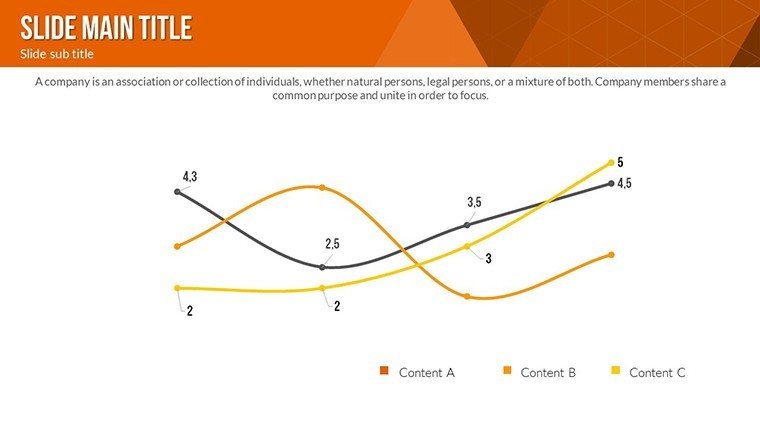
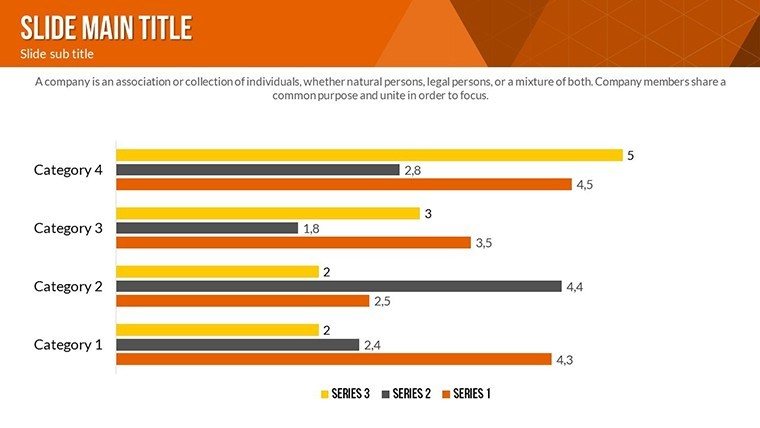
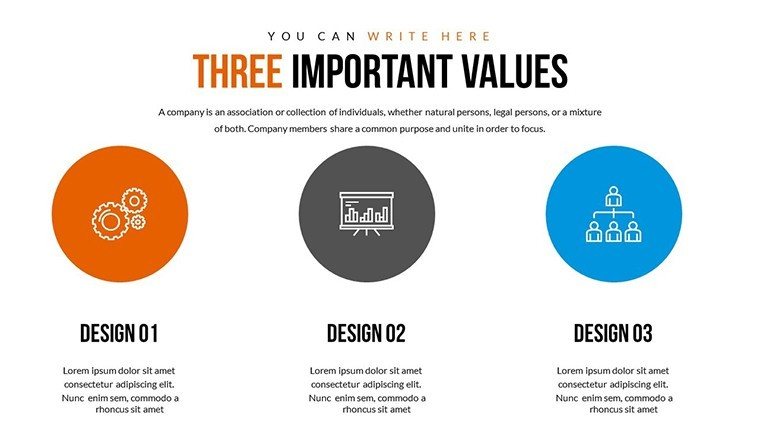
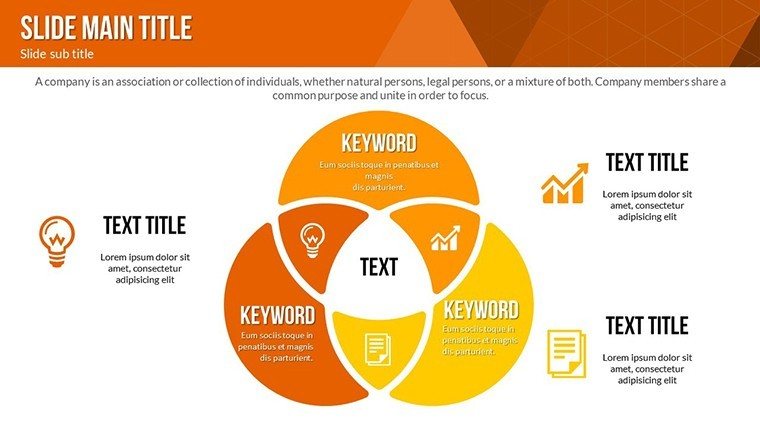
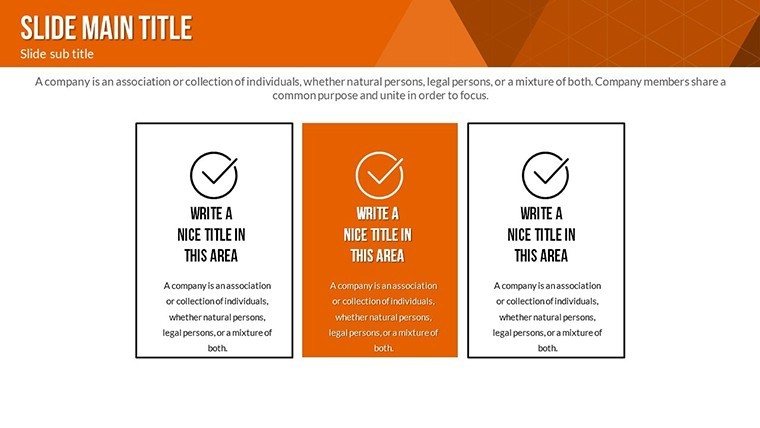
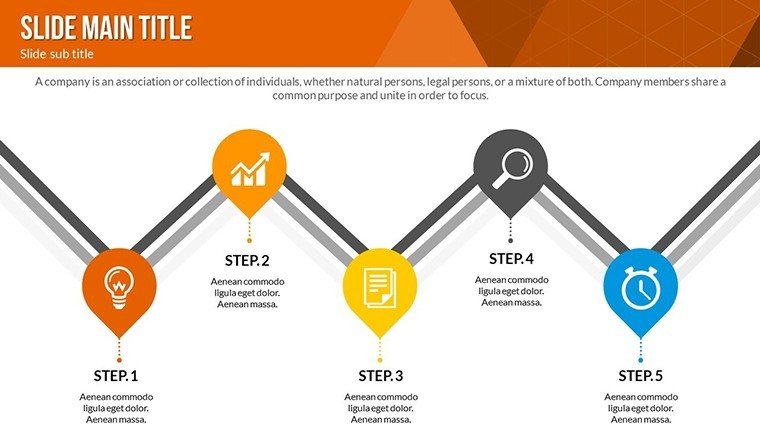
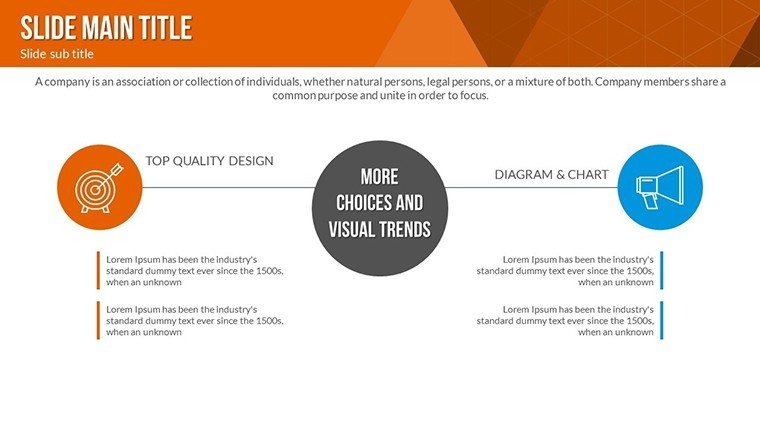
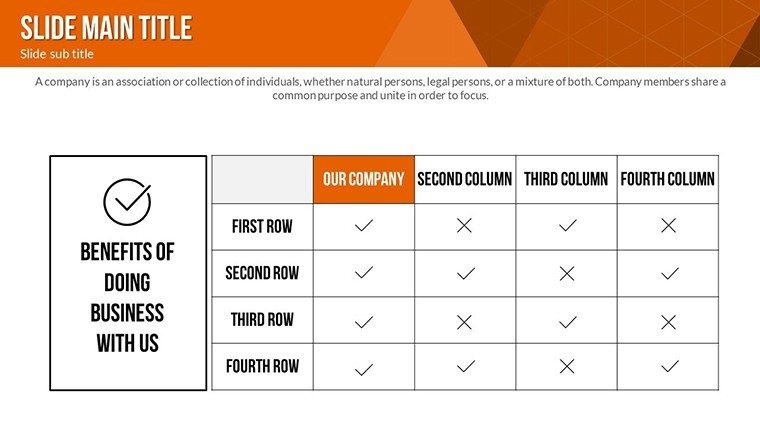
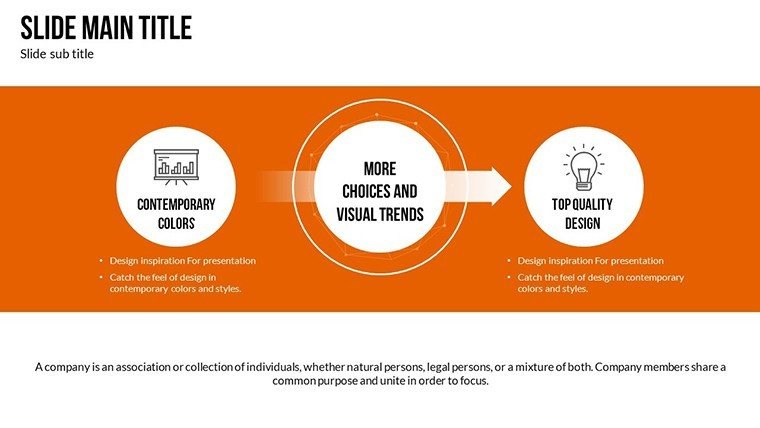
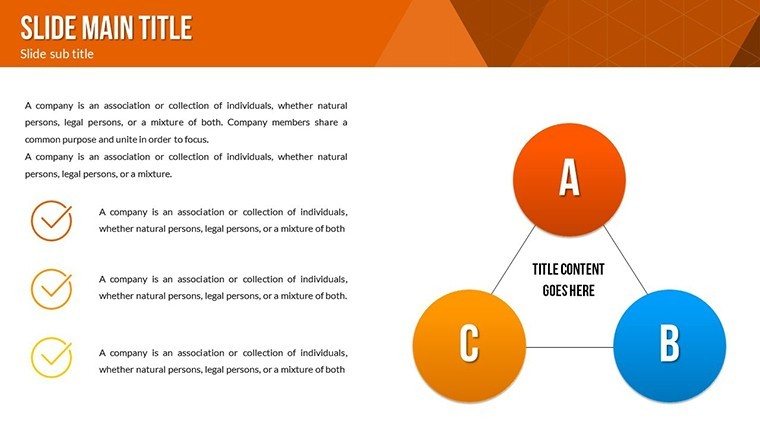
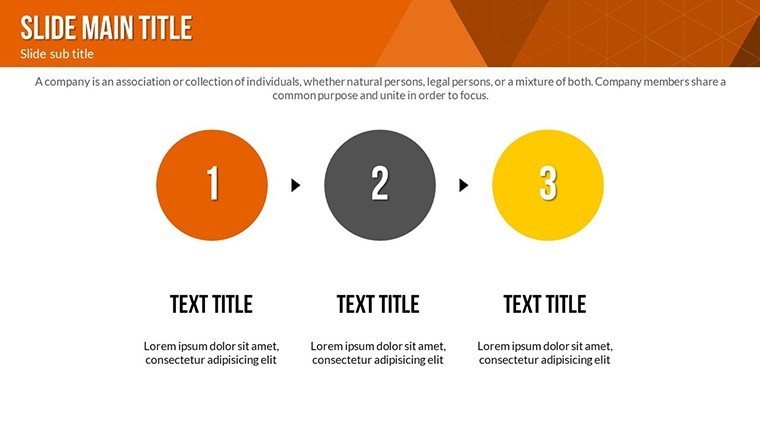
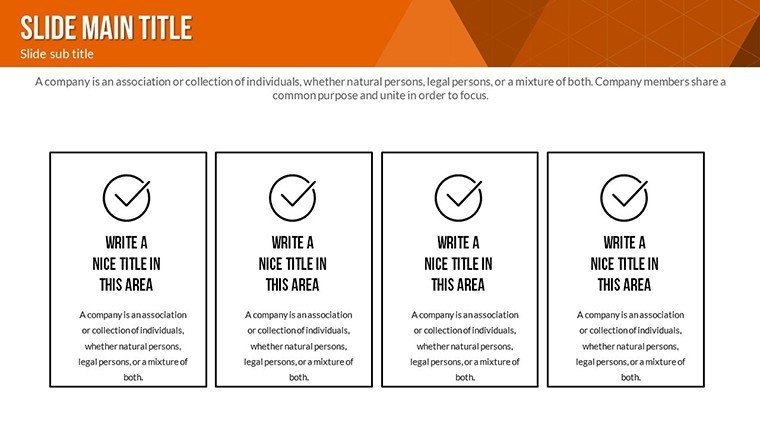
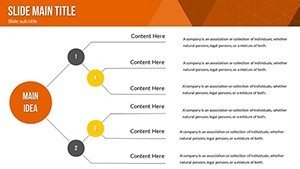
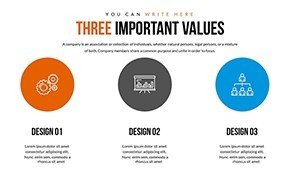
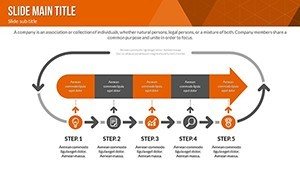
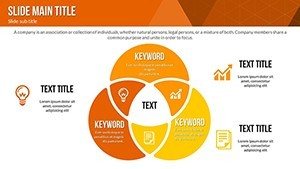
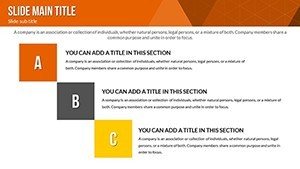
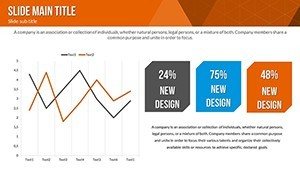
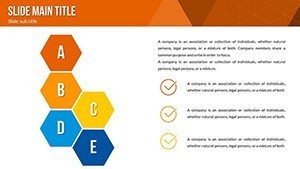
- Diverse Chart Types: Flowcharts for process interlinks, Venn for overlapping zones like public-private spaces in urban designs.
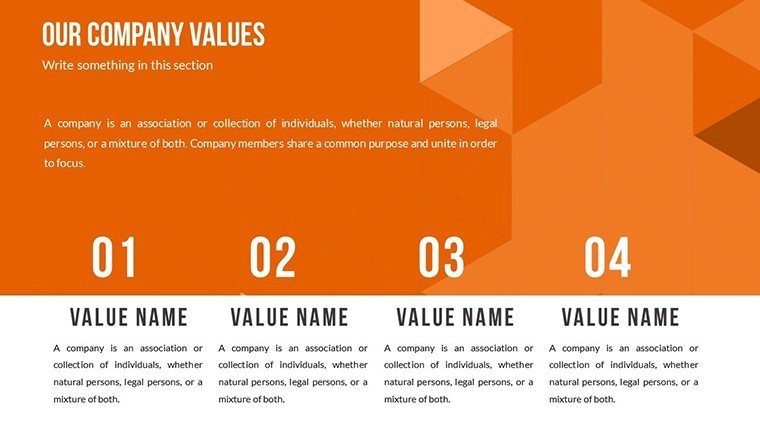
- Brand Customization: Match fonts and colors to your firm's identity, ensuring consistency in RFP submissions.
- High-Resolution Vectors: Scale without loss for large-format prints or digital shares.
- Animation Tools: Add transitions to simulate system interactions, like water flow in landscape architecture.
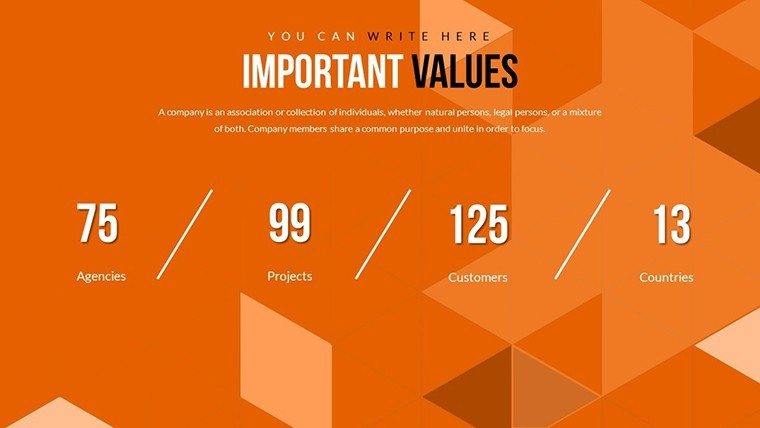
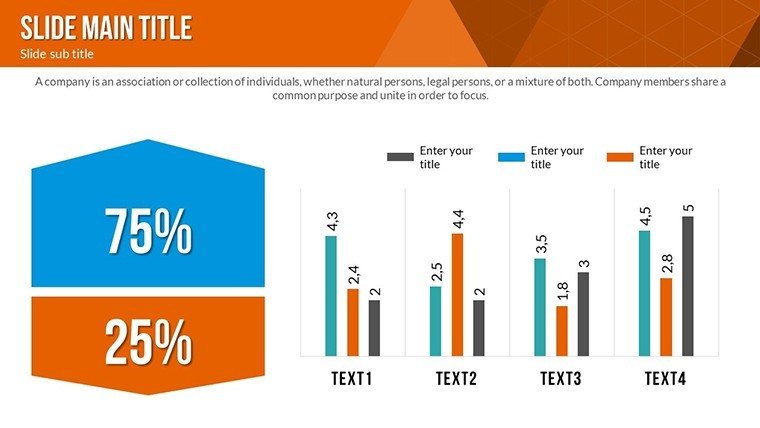
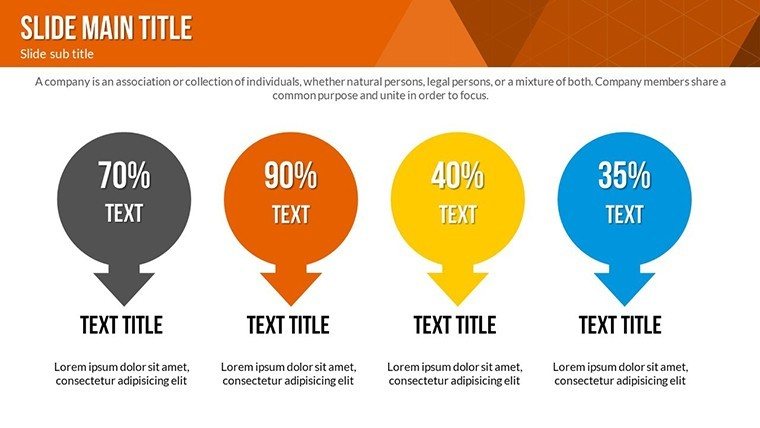
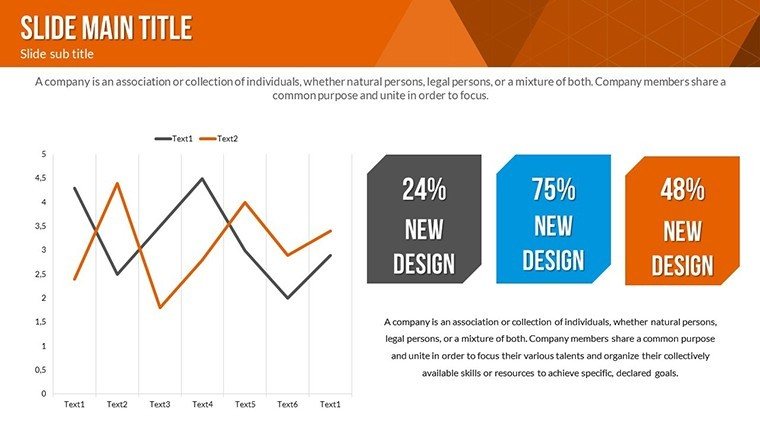
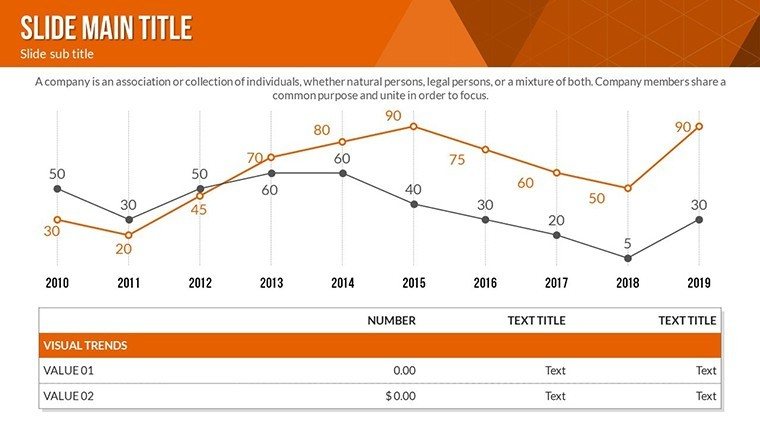
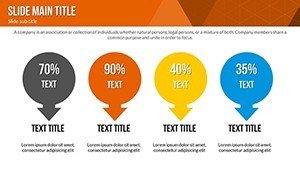
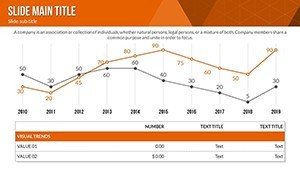
- Data Input Ease: Placeholder texts for quick swaps with metrics from Rhino or SketchUp exports.
Unlike standard PowerPoint options, which falter on complexity, this template handles multi-layered interrelations effortlessly, incorporating LSI like "system integration visuals" naturally.
Targeted Use Cases in the Field
Business architects benefit by charting organizational interrelations in adaptive reuse projects. Educators illustrate concept links in classrooms, enhancing student grasp of holistic design. Researchers map hypothesis interdependencies in studies on resilient structures post-disasters.
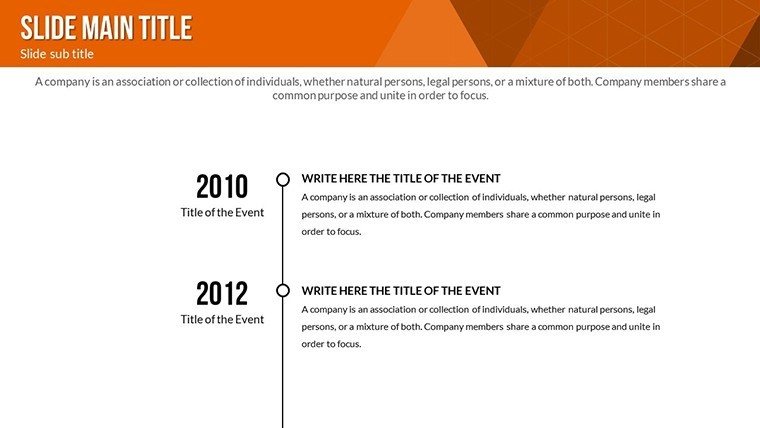
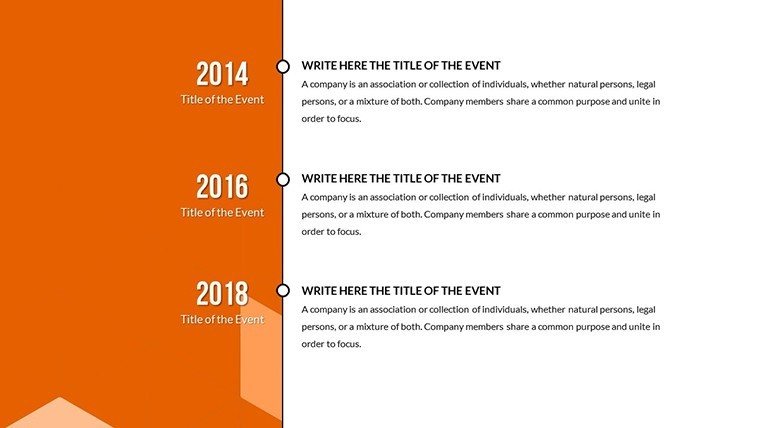
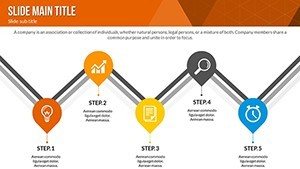
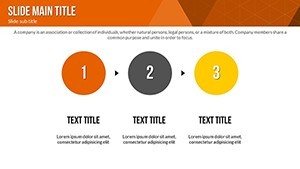
A practical workflow: Choose a diagram, say a cycle for lifecycle assessments. Input data - e.g., interrelations between cost and durability. Customize aesthetics for thematic alignment, then animate for emphasis. This approach has helped teams in New York reduce miscommunications in mixed-use developments by 30%.
Pro Tips for Seamless Integration
- Start with core connections: Identify primary interlinks before adding details to avoid clutter.
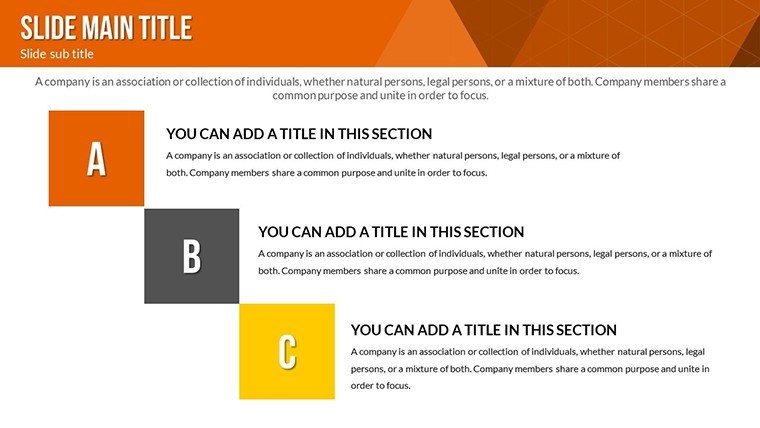
- Layer information: Use hierarchies to build from simple to complex, mirroring architectural iterations.
- Incorporate feedback loops: Add cycles for iterative processes like client revisions.
- Link to resources: Embed hyperlinks to AIA docs for authoritative backing.
- Test interactivity: Preview in slideshow mode to ensure smooth navigation.
In a London bridge project, interrelation charts clarified stakeholder roles, accelerating approvals. This template isn't a mere add-on; it's a catalyst for clearer, more collaborative architecture.
Who Needs This Interrelation Toolkit?
From solo practitioners to large firms, anyone dealing with interconnected designs. It supports hybrid workflows, compatible across platforms, and at a budget-friendly price, it's essential for staying competitive.
Elevate your interrelation storytelling - grab this template and connect the dots in your next architectural venture.
Frequently Asked Questions
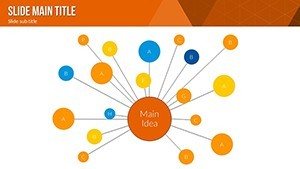
What chart types are best for system interlinks? Network and flowcharts excel for showing dependencies in building systems.
Can I add my own data easily? Yes, placeholders make swapping in custom metrics straightforward.
Is animation customizable? Absolutely, adjust timings and effects to fit your pace.
Does it work on older PowerPoint versions? Compatible with 2010 and later, plus Google Slides.
How does it handle complex networks? Vector-based for unlimited nodes without quality loss.
Are there export options? Yes, to PDF, JPG, or video for versatile sharing.