Dynamic PowerPoint Charts - Presentation Template


Ignite your presentations with the Dynamic PowerPoint Charts Template, a powerhouse of 23 editable slides dedicated to flow and analysis visuals. Crafted for those who demand movement in their messaging, this tool turns static data into fluid stories, whether you're a marketer dissecting campaign flows or an educator explaining process analyses. Picture seamless bar graphs illustrating sales momentum or pie charts breaking down analytical insights with precision. It tackles the tedium of rigid templates by providing drag-and-drop customization, ensuring your content flows naturally and captivates from start to finish. Embrace this for pitches that persuade, lectures that linger, and proposals that propel your ideas forward in any field.
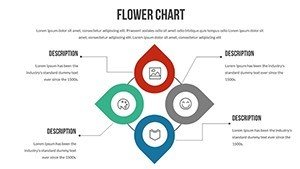
Flow and Analysis at Your Fingertips
Explore charts that emphasize progression and scrutiny, setting this apart with intuitive edits for colors and layouts. Inspired by flow theory from psychologists like Mihaly Csikszentmihalyi, it enhances engagement through visual rhythm.
Core Features for Dynamic Impact
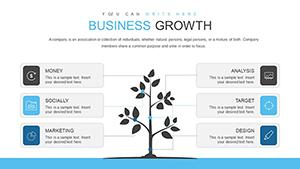
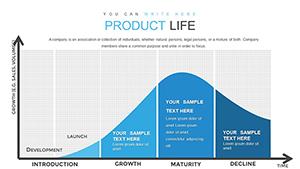
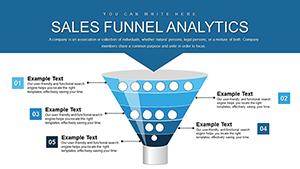
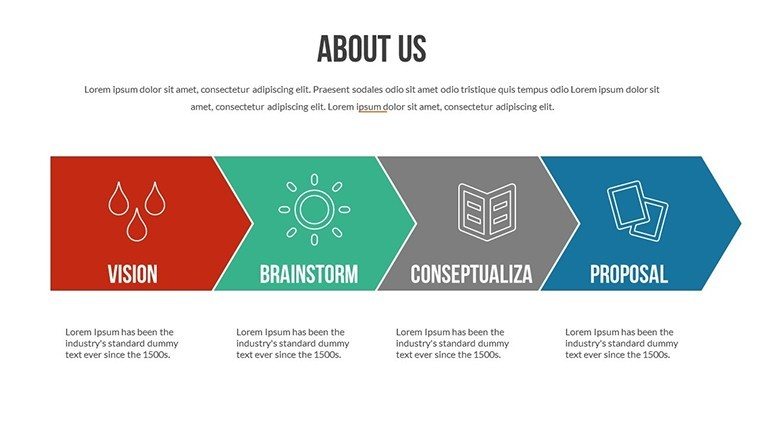
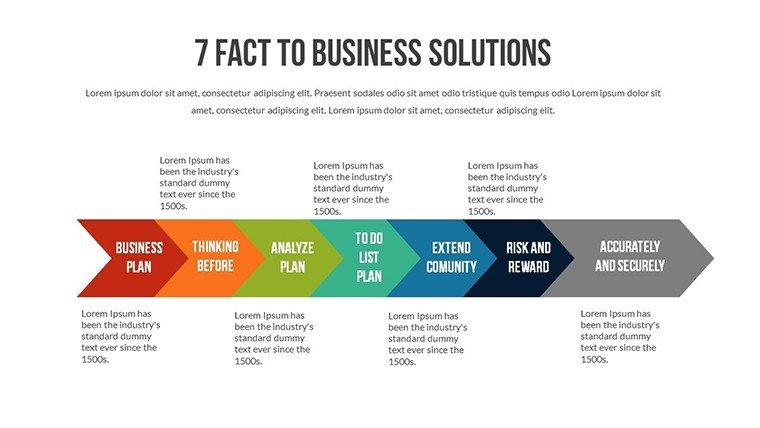
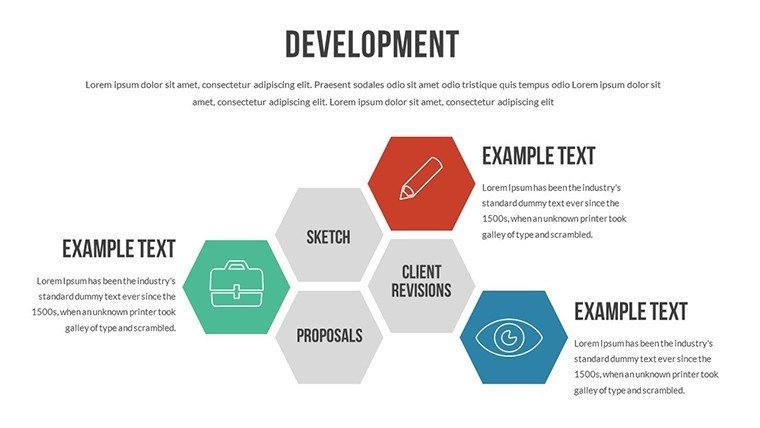
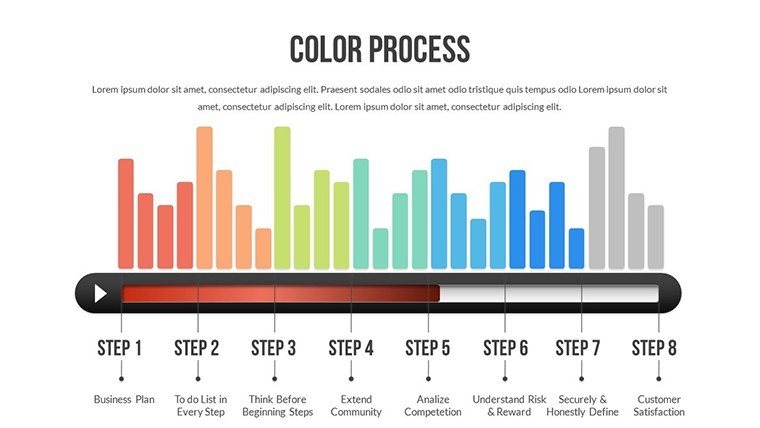
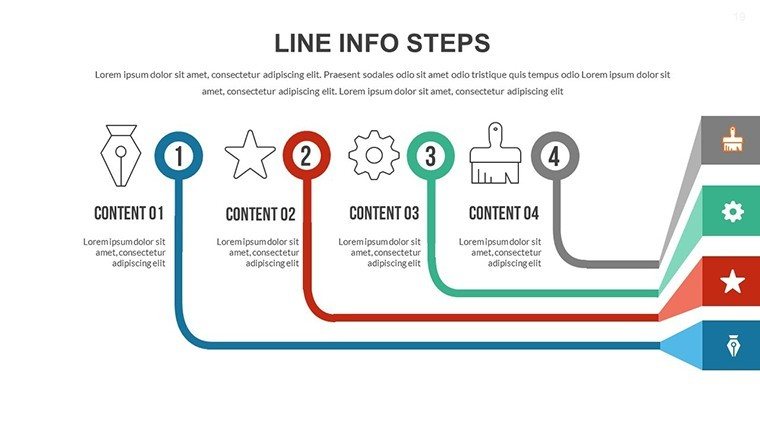
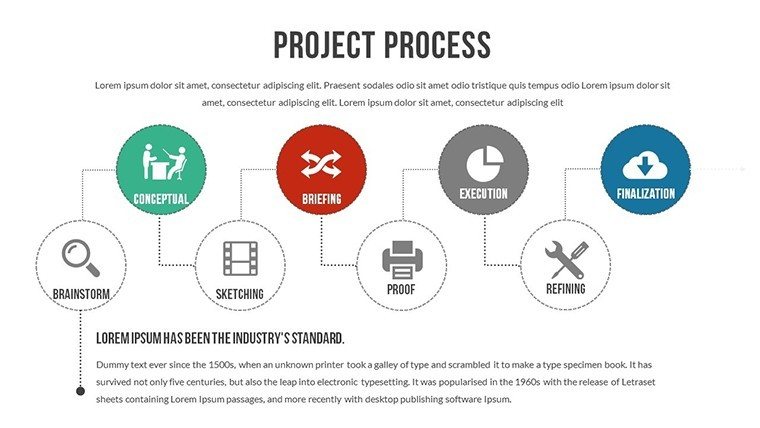
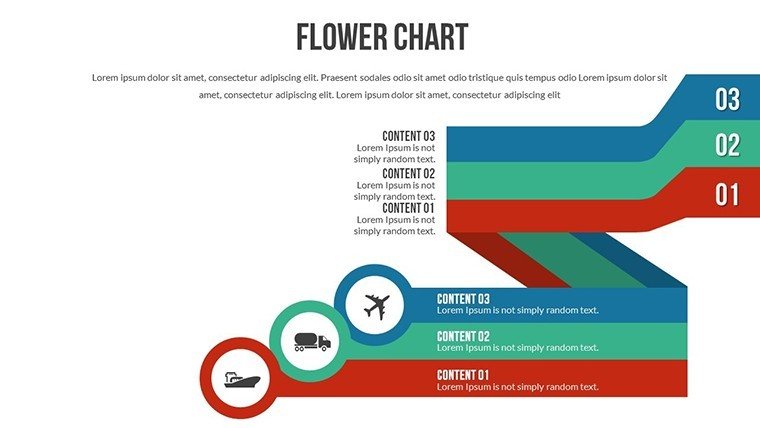
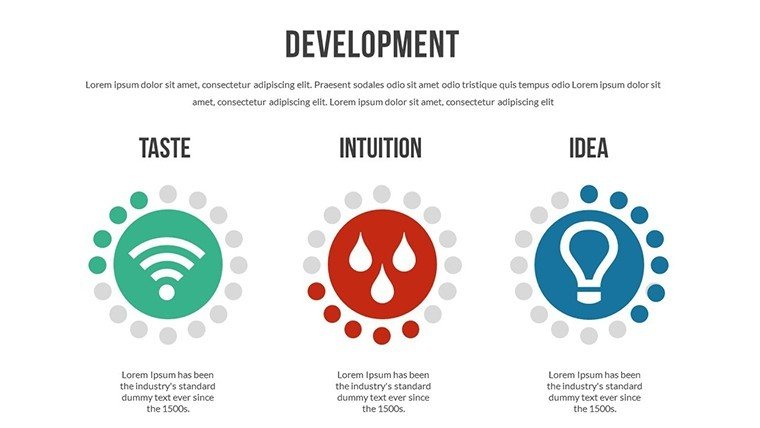
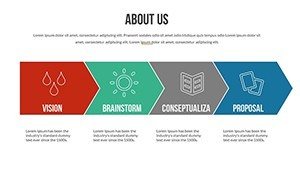
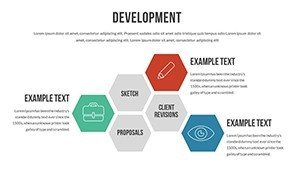
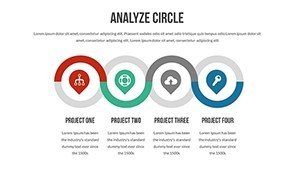
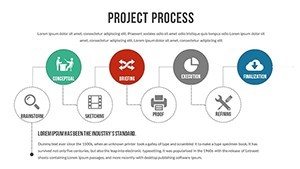
- Flow Diagrams: Map processes with smooth transitions.
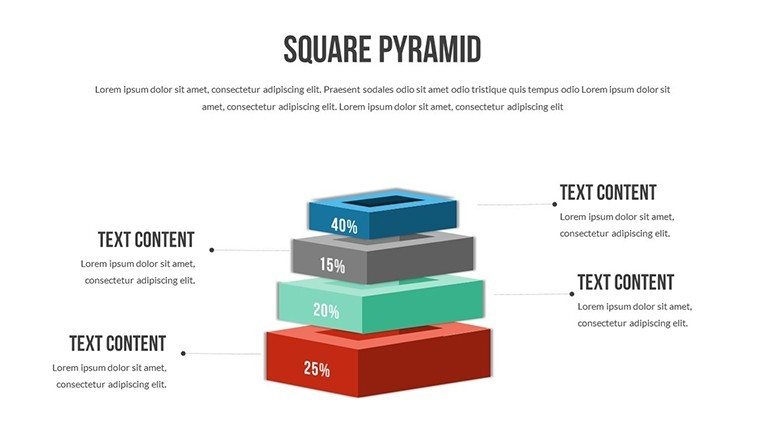
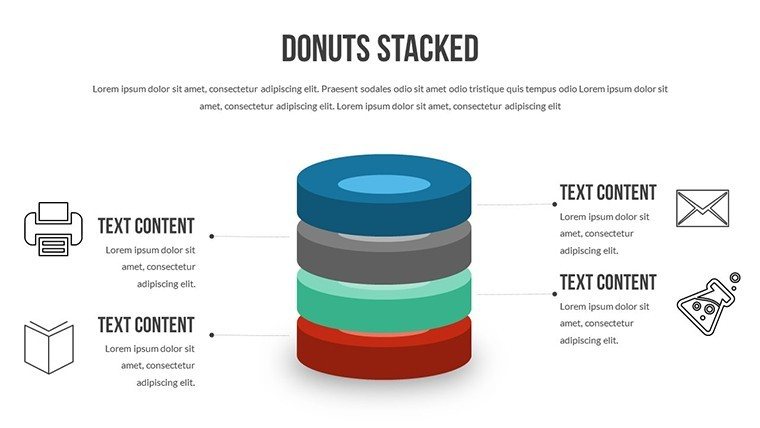
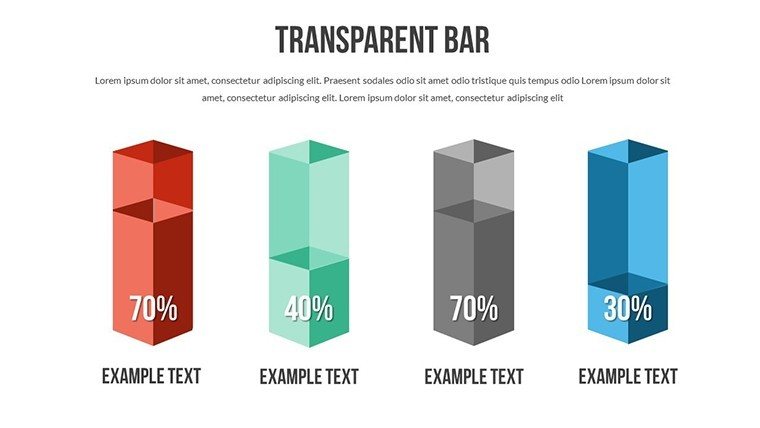
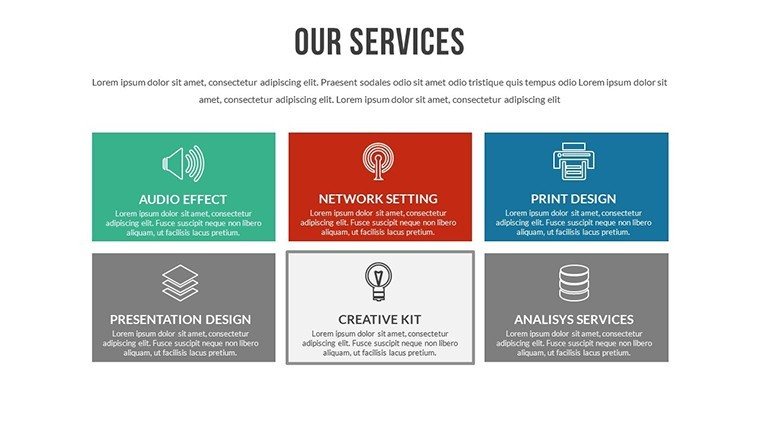
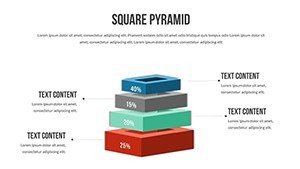
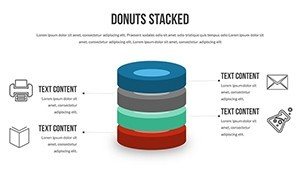
- Analysis Charts: Bar and pie for in-depth data breakdown.
- Drag-and-Drop Ease: Quick rearrangements for custom fits.
- Branding Options: Align with your style seamlessly.
- Multi-Platform: PowerPoint and Google Slides ready.
A business analyst might use it to chart workflow efficiencies, echoing Forbes insights on data-driven decisions.
Versatile Applications for Real Results
From sales flows in pitches to analytical reviews in education, this template adapts. Marketers can visualize campaign journeys, creatives showcase design processes.
Start by importing data, customize flow elements, add animations - outperforming basics with enhanced coherence, per Gartner studies.
Integration Steps
- Open and select a slide.
- Populate with your analysis data.
- Adjust for dynamic visuals.
- Animate key flows.
- Deliver with flair.
This creates compelling narratives effortlessly.
Elevate with Proven Dynamics
Trust its foundation in analytical best practices; a startup used similar to analyze market flows, gaining traction.
Harness dynamic charts today - download and flow!
Frequently Asked Questions
What makes the charts dynamic?
Animations and flow designs bring data to life.
Suitable for educators?
Yes, perfect for teaching analytical processes.
Customization level?
Full edits on colors, layouts, and elements.
Slide count?
23 editable slides for flow and analysis.
Compatible software?
PowerPoint and Google Slides.