Promo code "00LAYOUTS"
Professional Analytics PowerPoint Charts Template: Master Data Storytelling
Type: PowerPoint Charts template
Category: Analysis
Sources Available: .pptx
Product ID: PC00523
Template incl.: 24 editable slides
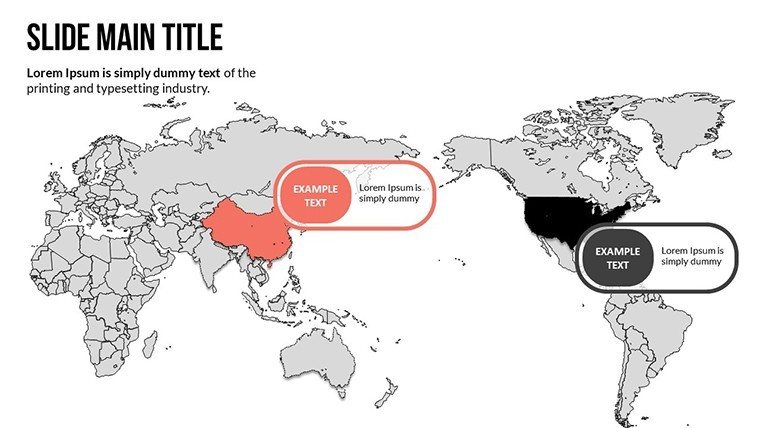
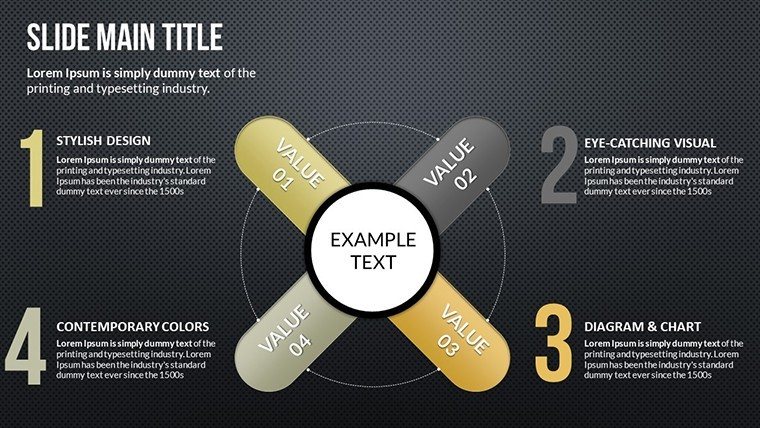
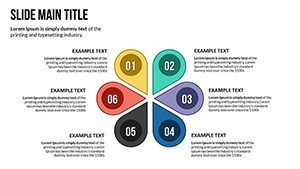
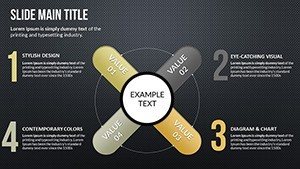
In an era where data drives decisions, presenting analytics effectively can make or break your professional edge. Our Professional Analytics PowerPoint Charts Template steps in as your ally, offering 24 editable slides packed with versatile tools to visualize insights. Tailored for data analysts, marketers, and executives, it transforms raw numbers into clear, compelling narratives. Whether dissecting quarterly metrics or forecasting trends, this template ensures your presentations are not just informative but influential. With high-quality visuals and easy customizations, you'll save time while enhancing clarity - think of turning a spreadsheet nightmare into a visual feast that captivates stakeholders, inspired by data visualization pioneers like Hans Rosling for global impact.
Exploring Advanced Chart Varieties and Customizations
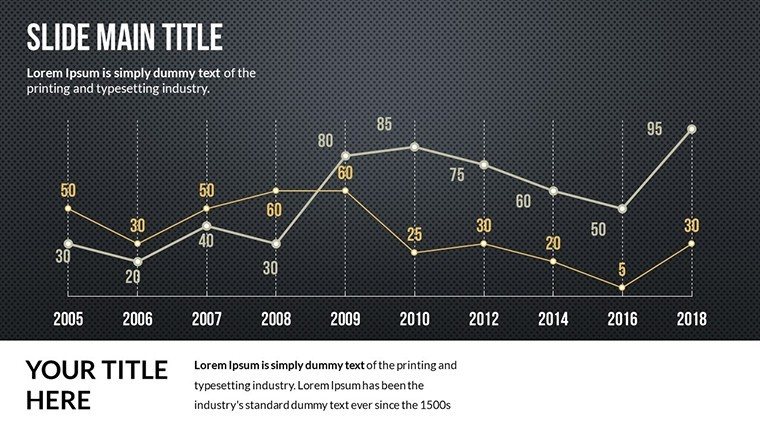
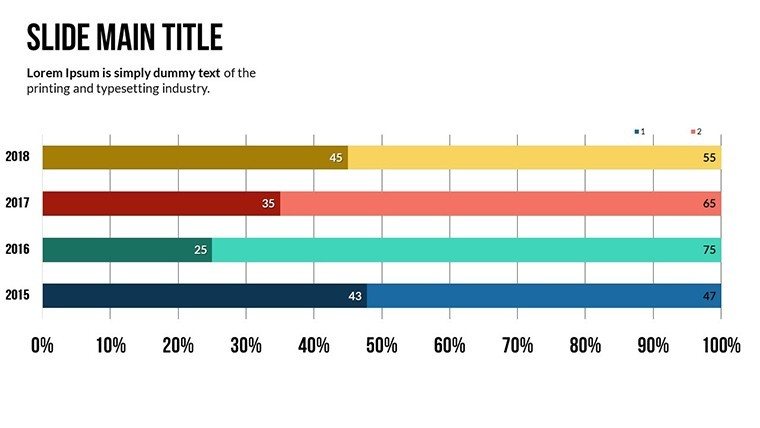
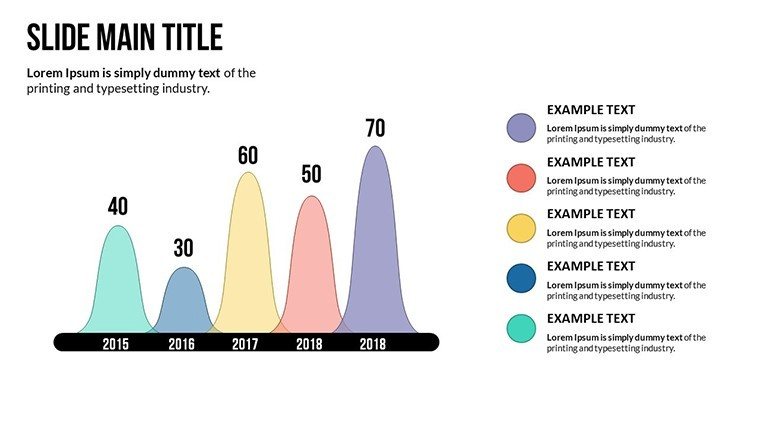
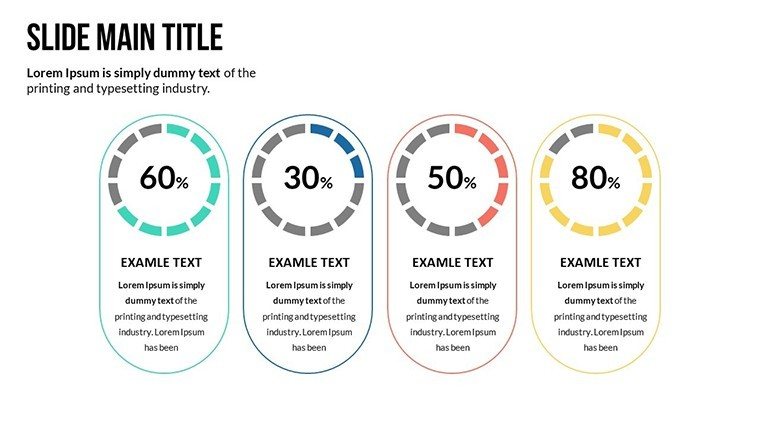
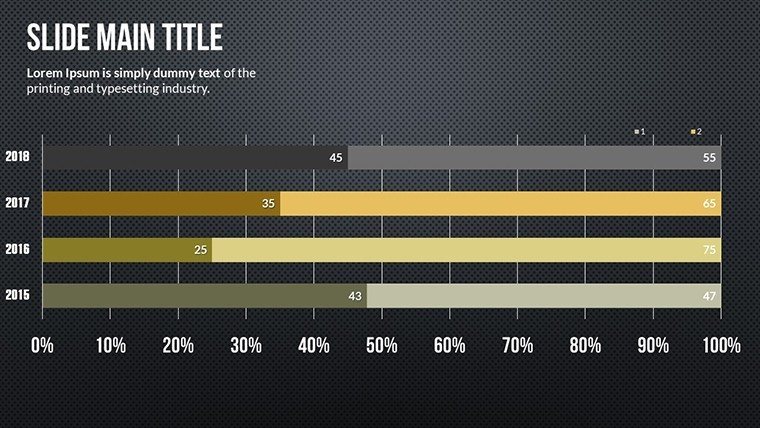
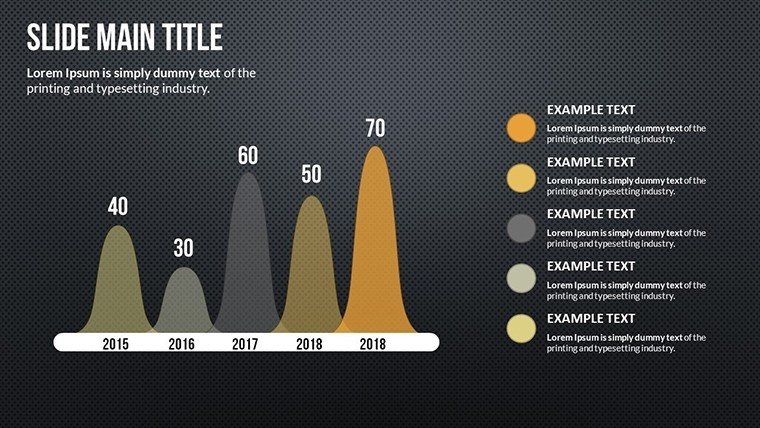
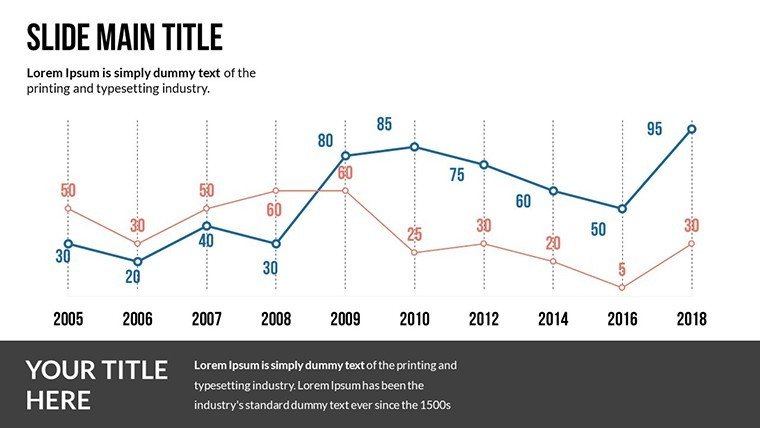
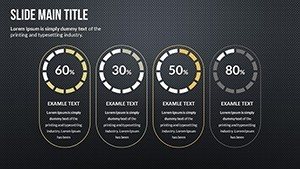
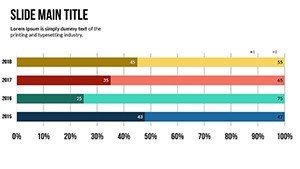
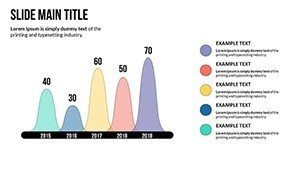
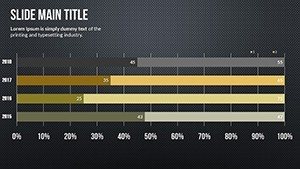
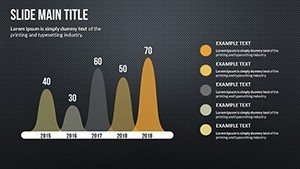
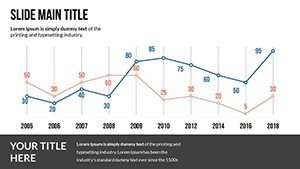
This template's strength lies in its diverse chart arsenal. From bar graphs ideal for comparative analysis - such as benchmarking sales across teams - to line charts tracking performance over time, each slide is built for precision. Pie charts simplify proportions, like market share breakdowns, while scatter plots reveal correlations, perhaps between ad spend and conversions. All are fully customizable: Alter axes, legends, and data series with a few clicks, ensuring alignment with your branding guidelines.
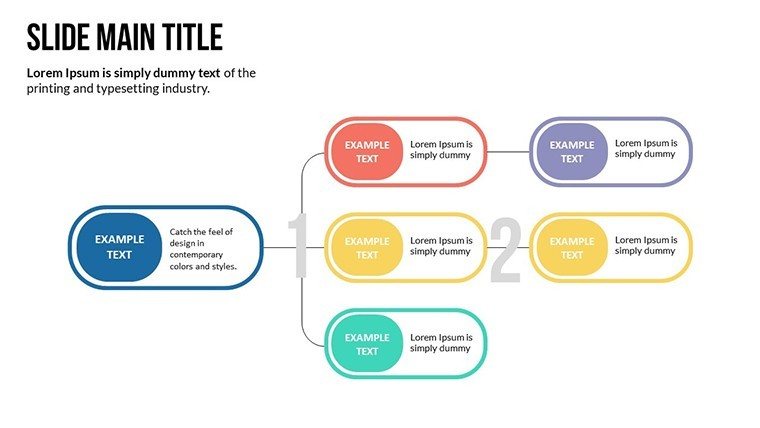
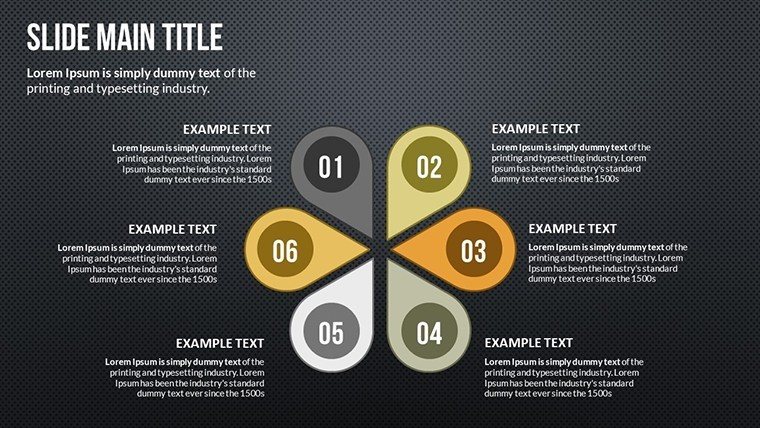
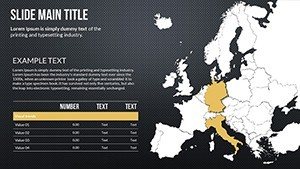
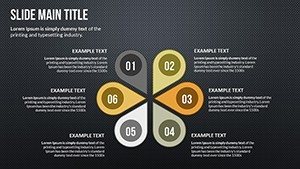
Beyond basics, infographic elements like icons for data points (e.g., upward arrows for growth) add flair without clutter. Data tables integrate seamlessly for those needing raw figures alongside visuals. In academic settings, researchers use similar setups to present findings at conferences, citing sources like APA for structured reporting. This template mirrors that professionalism, enabling you to embed formulas or links for interactive depth.
Use Cases in Action: From Reports to Forecasts
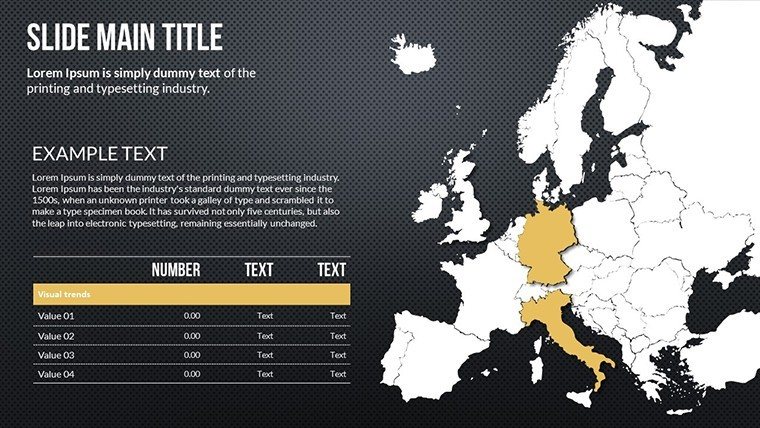
Consider a quarterly business review: Open with a dashboard slide aggregating KPIs via combined charts, providing an at-a-glance overview. Drill down into sales data with stacked columns, highlighting regional contributions - maybe showing Europe's 40% surge. Marketing reports thrive with pie charts on campaign ROI, drawing from tools like Google Analytics for real metrics. For financial forecasts, area charts project revenues, incorporating scenarios like best-case vs. baseline, as in IMF economic models.
Academic presentations benefit too: Simplify research with bubble charts sizing variables by importance, making complex studies accessible. In all cases, the template fosters engagement, reducing misinterpretation risks and promoting data-driven cultures, much like in McKinsey reports where visuals clarify strategies.
Optimizing Your Analytics Workflow
Compatibility with PowerPoint ensures smooth operation, with Google Slides support for cloud-based work. Custom features allow animation sequencing - reveal data points progressively to build suspense. Versus generic charts, this offers superior quality, with anti-aliasing for crisp displays on large screens. A pro tip: Use color theory; blues for trust in financial slides, per psychological studies from Color Psychology journals.
In a real example, a fintech firm revamped their investor decks using analogous templates, seeing a 25% uptick in funding interest due to clearer projections. Overcome challenges like data overload by leveraging the template's modular design - group related charts on one slide for cohesion.
Tackling Complex Data Challenges Head-On
For intricate datasets, heat maps (via color gradients in tables) highlight patterns, ideal for risk assessments. Bubble charts add a third dimension, like sizing by volume in supply chain analyses. These tools address common pitfalls, ensuring presentations are credible and persuasive.
Extend usability by integrating with Excel for live data links, keeping slides current. This dynamic approach suits fast-paced environments, where timely insights win.
Elevating Your Data Expertise
This template isn't just slides - it's a step toward mastery in analytics communication. By blending functionality with aesthetics, it positions you as an authority, ready to influence outcomes.
Seize the advantage: Download now and turn data into your superpower.
Frequently Asked Questions
What chart types are available?
Includes bar, line, pie, scatter, and more for comprehensive data visualization.
How editable is the template?
Fully customizable, from colors and fonts to data inputs and styles.
Does it work with older PowerPoint versions?
Yes, compatible with recent and legacy versions for broad accessibility.
Ideal for which professionals?
Data analysts, marketers, executives, and academics presenting insights.
Number of slides included?
24 editable slides with high-quality visuals and tools.
Can I add interactive elements?
Yes, supports animations and hyperlinks for engaging presentations.

