Infographic Process PowerPoint Charts - Ready to Present | ImagineLayout


18 Diagrams Across Layouts: Full Contents
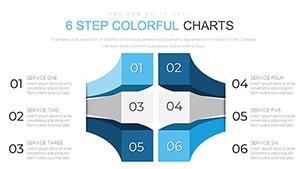
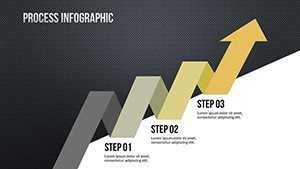
18 editable slides supply arrow analysis tools and graph types in one download.
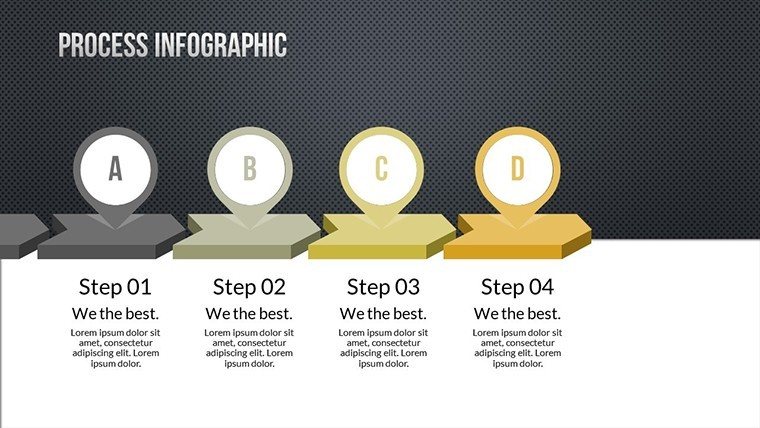
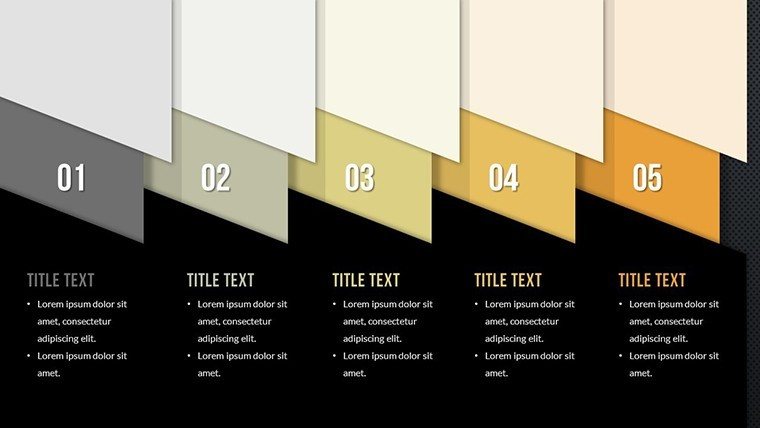
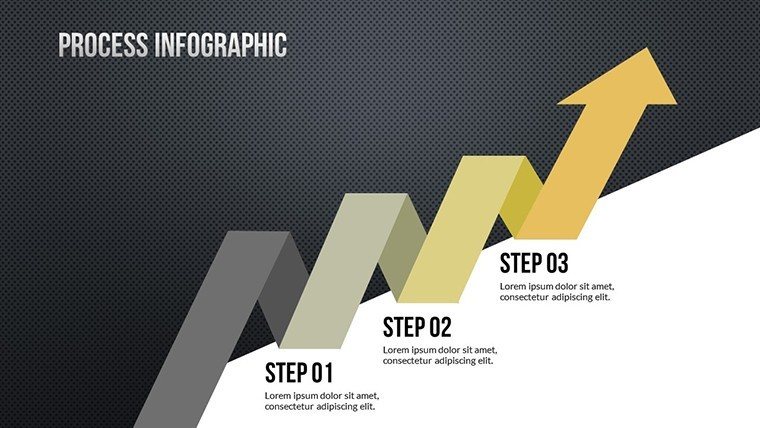
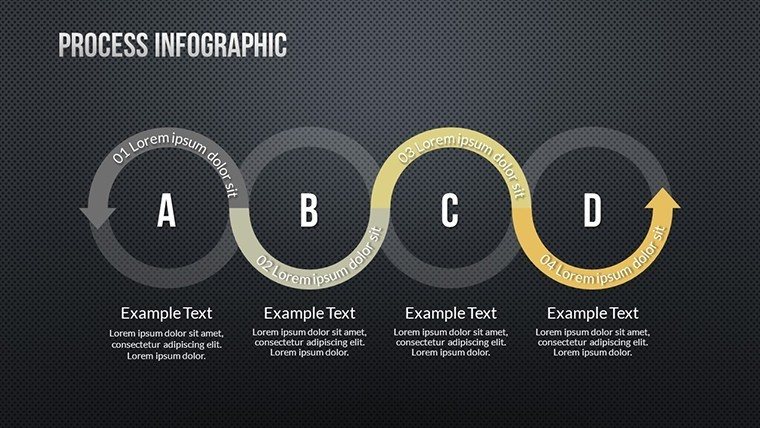
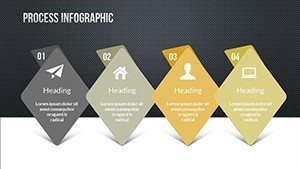
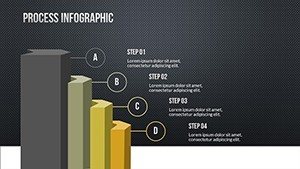
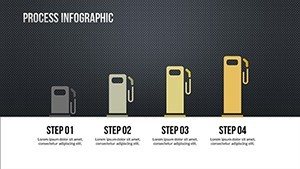
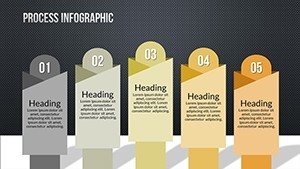
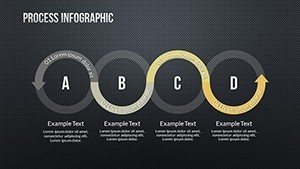
These diagram types simplify complex sequences so audiences retain information through clear zone segmentation.
Unlike basic sets this one integrates infographic elements with arrow connectors. One specific visual characteristic is arrow-based zone segmentation. It works best for quarterly briefings because the functional aesthetics demonstrate expertise over plain neighbors. The single purchase covers the full 18 slides with no free tier specified on the page.
At a Glance
| Feature | Details |
|---|---|
| Slides / diagrams included | 18 full editable charts focused on infographic processes |
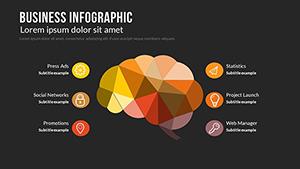
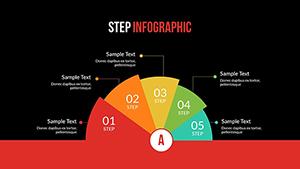
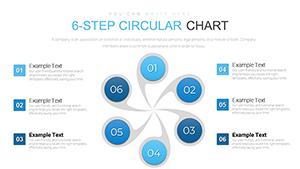
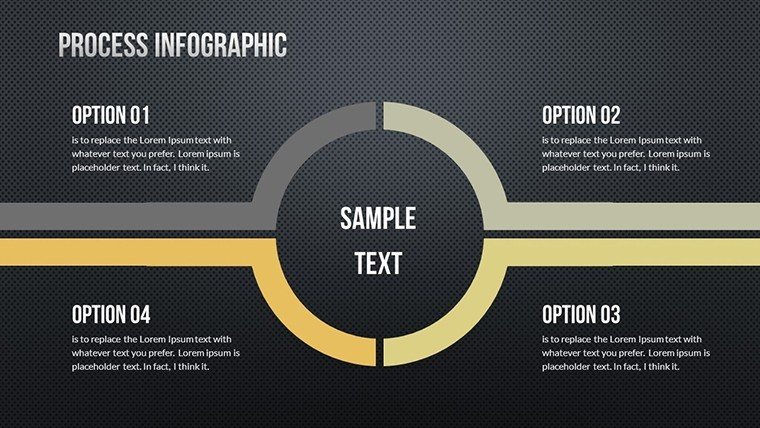
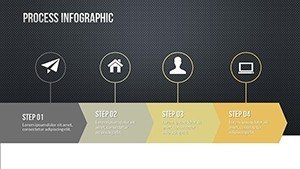
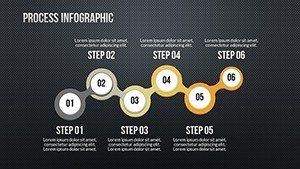
| Diagram categories | arrow sequences analysis tools diverse graphs |
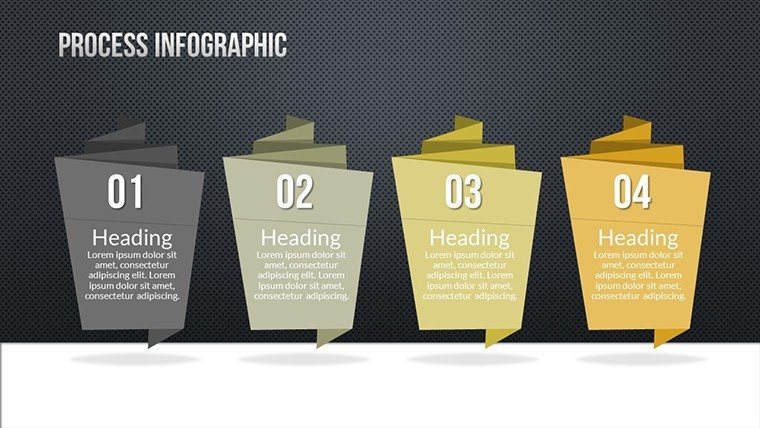
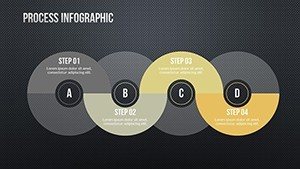
| Editable shapes | diagram segments resize and recolor independently |
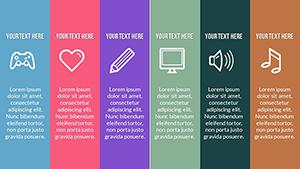
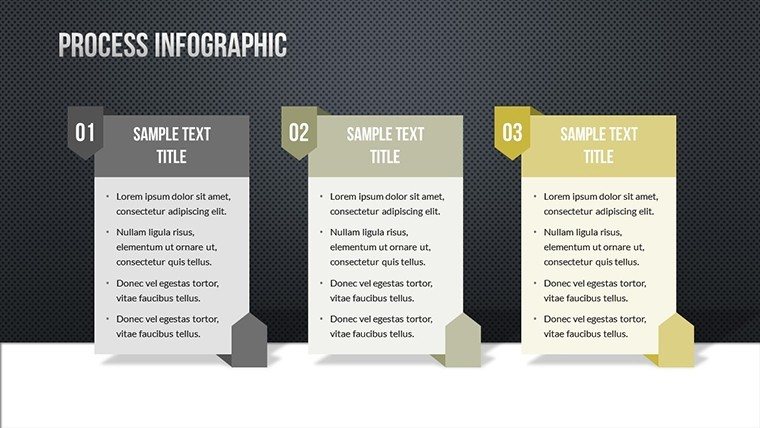
| Text placeholders | labels update without unlocking grouped elements |
| Color theme adjustments | compatible with PowerPoint slide master palette |
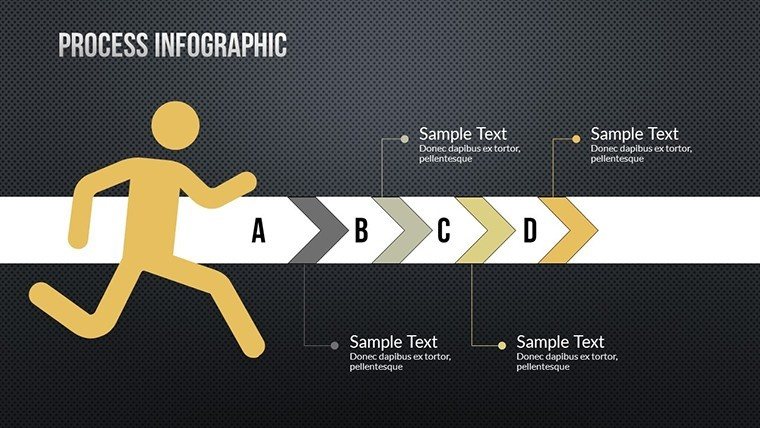
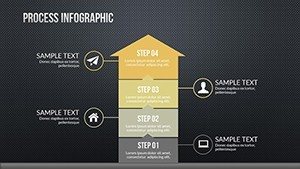
| Diagram connectors | arrows and lines adjustable in direction and weight |
From Strategy Decks to Boardroom Pitches
Financial Analyst in Quarterly Briefings
A financial analyst in the banking industry maps supply chains for quarterly briefings reusing the infographic slides across five sessions by swapping color schemes cutting preparation from three hours to 45 minutes.
Marketing Team Lead in Client Proposals
A marketing team lead in the agency sector illustrates strategic plans reusing the same file across three client proposals by adjusting arrow connectors.
Download the 18-slide set now to start your next process mapping
Customization in 5 Steps
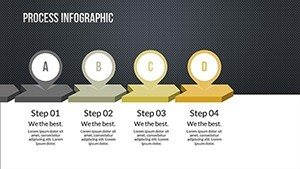
Step 1 - Open the .pptx file in PowerPoint (1 minute)
Launch Microsoft PowerPoint 2016 or later.
Step 2 - Replace placeholder text with your content (3 minutes)
Update labels across all charts.
Step 3 - Adjust brand colors via the slide master (2 minutes)
Apply color theme adjustments.
Step 4 - Edit diagram labels and connectors (4 minutes)
Resize segments and change flow direction.
Step 5 - Export as PPTX or PDF (1 minute)
Save for distribution. Editing difficulty Moderate.
The Cost of Not Using a Template
Building equivalent slides from scratch requires four hours and advanced design skill.
Common issues include mismatched layout composition and unclear information spacing that confuse audiences during client proposals.
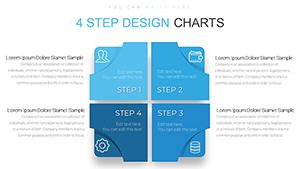
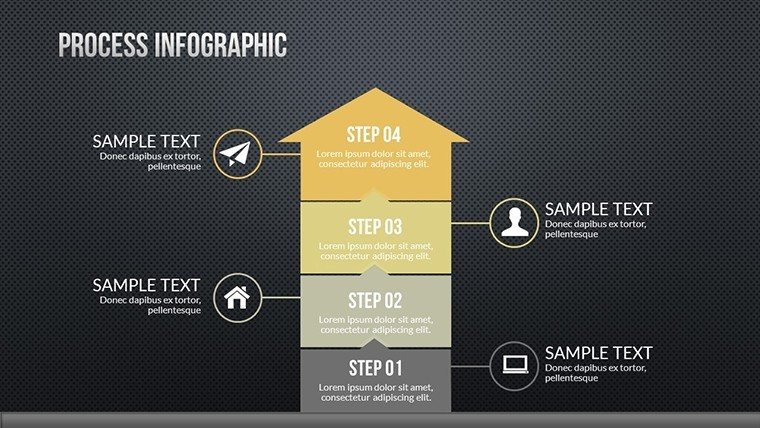
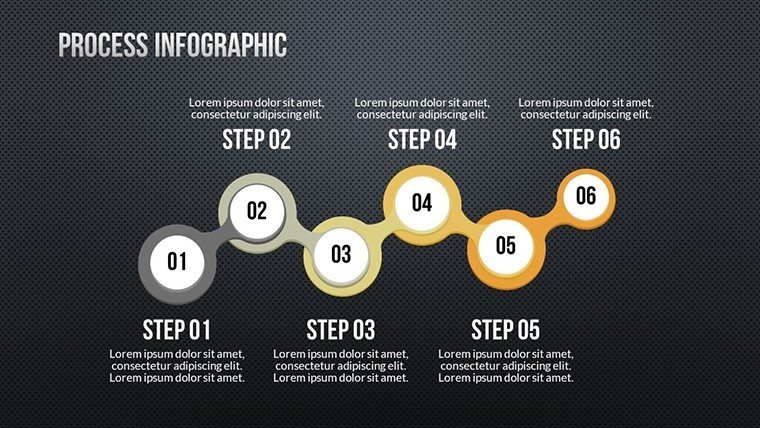
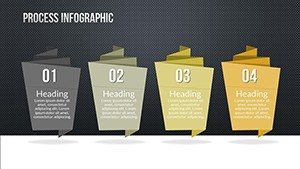
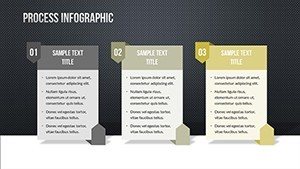
Many presentations place labels directly inside diagram shapes. That approach works on a laptop screen but becomes harder to read on a projection screen. This layout places labels outside the shapes connected by thin lines - maintaining readability during live meetings without adding editing complexity.
Get the Infographic Process Charts and present with confidence
Which PowerPoint versions does this template support?
The template opens in PowerPoint 2016 2019 2021 and Microsoft 365 on both Windows and Mac. Compatibility testing shows full functionality in the latest versions. Older versions before 2016 may experience minor layout shifts but core editable shapes remain intact. Always verify your version before purchase to ensure smooth editing.
How do I change the color scheme?
Open the slide master view in PowerPoint. Select the color palette section and replace the theme colors with your brand values. All charts update automatically across the 18 slides. Save the master and return to normal view to confirm the color theme adjustments applied correctly.
What does the license permit for client work?
The license allows use in internal business presentations and paid client work. You may deliver the edited PPTX to clients as part of a project. Resale or sublicensing of the original file is not permitted. Redistribution of the unmodified template violates the terms.
Is there a free version and what does the paid include?
No free tier is listed on the page. The paid download provides the complete set of 18 editable slides with all diagram categories and connectors. Purchase grants immediate access to every layout and master. There are no additional files or restrictions beyond the license.
What file formats are provided and how to open them?
The file is supplied as .pptx. Open it directly in any supported PowerPoint version. No conversion is needed. Export options include PDF for distribution after editing the editable shapes and text placeholders.
Does it support animations?
Built-in animations appear on diagram connectors and phase reveals. Remove or modify them through the animations pane in PowerPoint. This keeps flow direction intact while allowing custom timing for strategy meetings. Test playback before final export.