Animations Components PowerPoint Chart Presentation


When managing projects or analyzing data, clarity in communication can make or break success. Our Animations Components PowerPoint Charts template addresses this by providing 16 editable slides focused on tree and arrow structures, perfect for illustrating hierarchies, sequences, and interactions. Tailored for project managers, software developers, and business strategists, this template turns abstract concepts into visual narratives. Picture mapping out a software architecture with tree diagrams that branch out dependencies, or using arrows to sequence process flows in a team briefing. It simplifies complex plans, helping teams align on deadlines and resources, ultimately driving efficiency and reducing miscommunications.
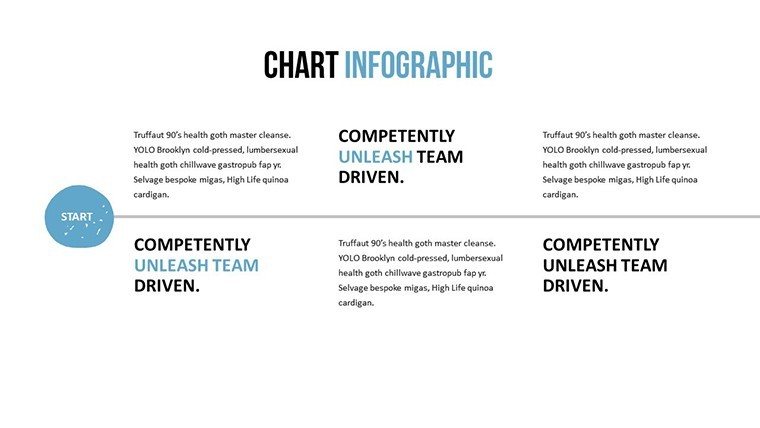
Exploring Tree and Arrow Chart Innovations
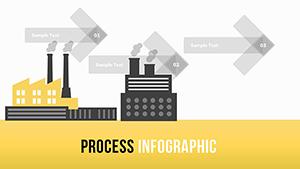
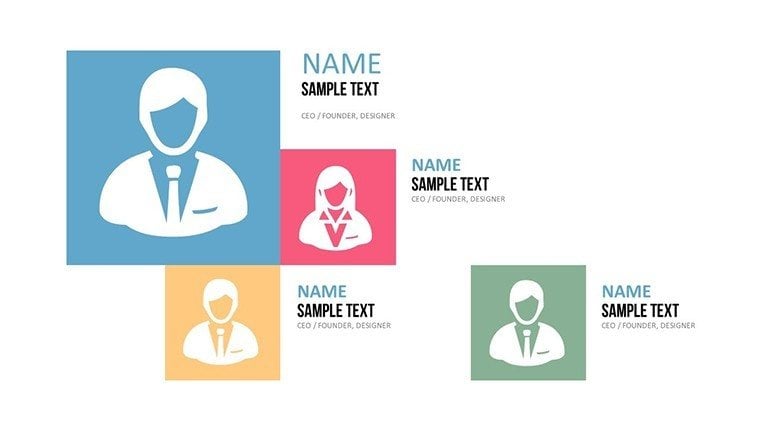
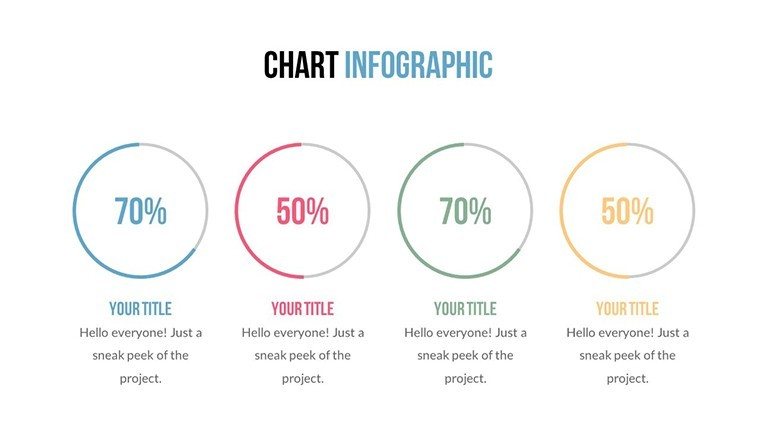
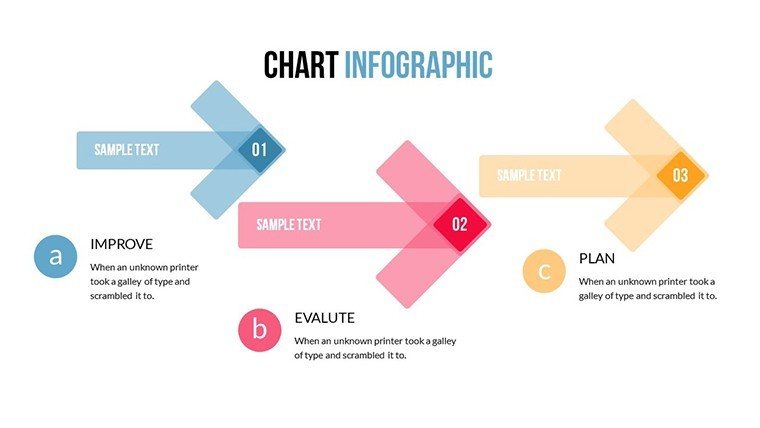
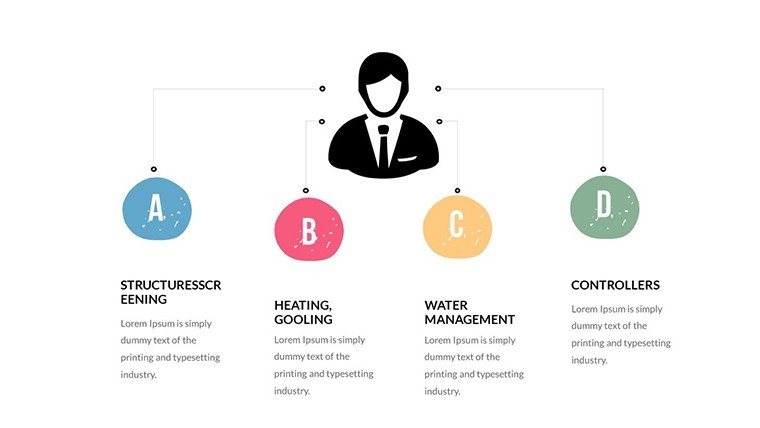
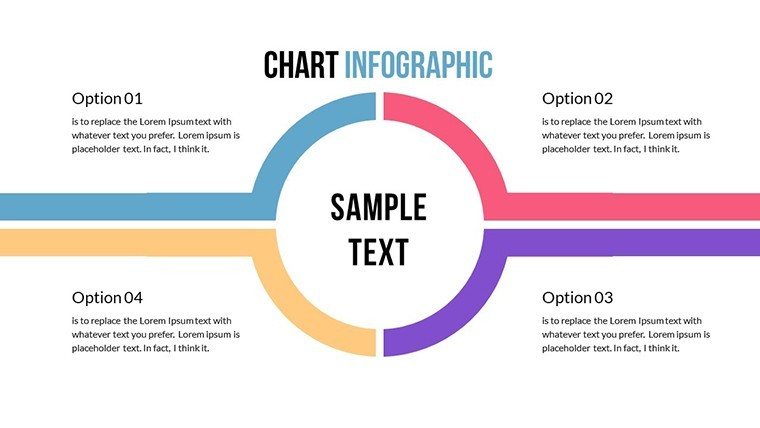
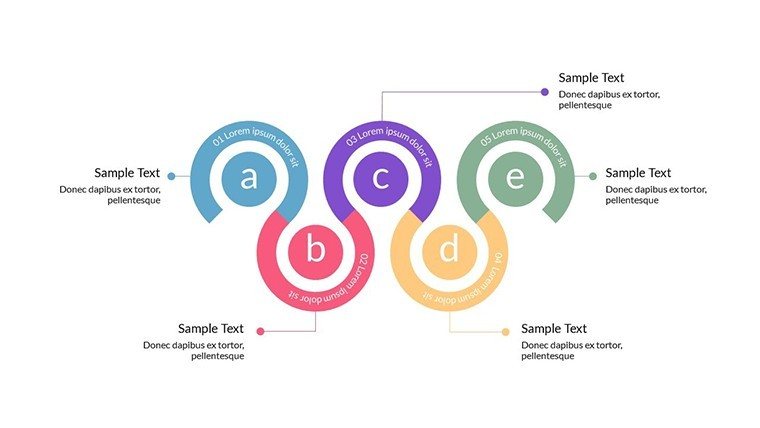
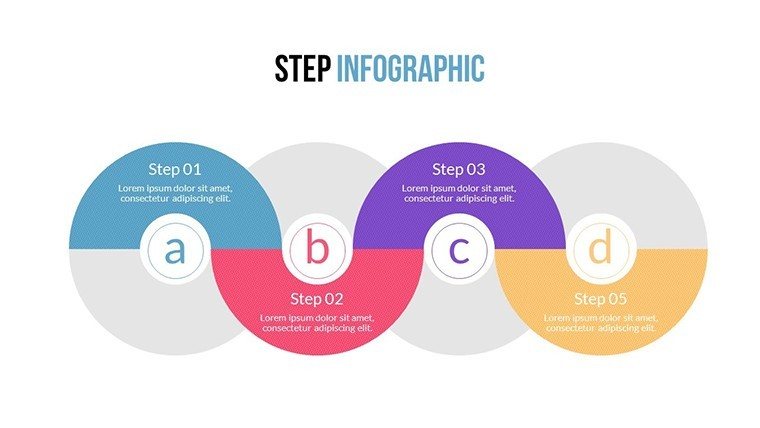
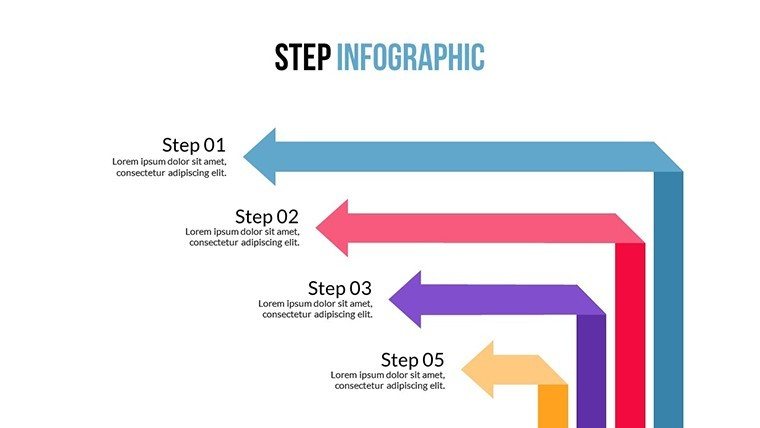
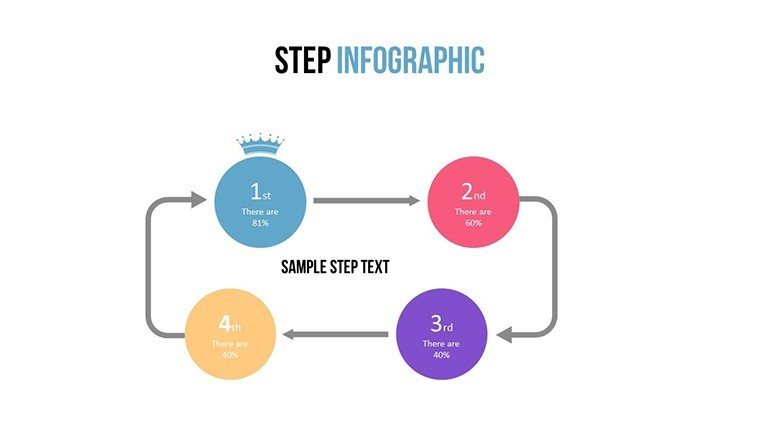
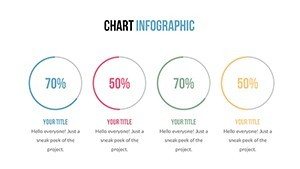
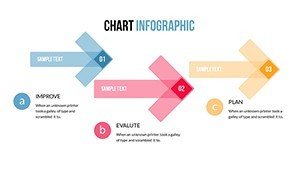
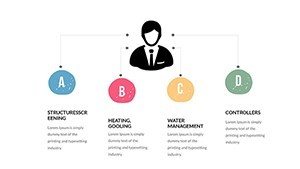
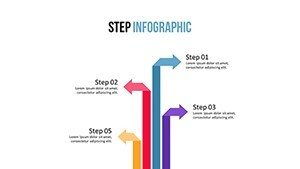
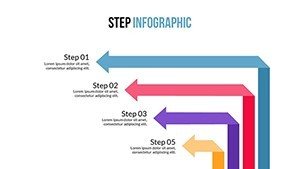
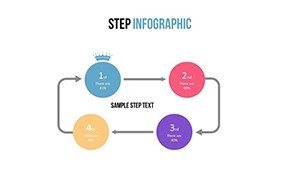
The tree designs excel in depicting hierarchical relationships, such as organizational structures or decision trees in risk assessments. For example, in IT, use them to outline system components, showing how modules interact for better debugging. Arrow charts, meanwhile, guide the eye through processes, ideal for timelines or workflow diagrams. Each slide supports animations, allowing elements to appear sequentially, which keeps audiences focused and enhances understanding. Editability extends to shapes, colors, and text, ensuring alignment with your project's aesthetics. High-quality vectors maintain sharpness, even when scaled for posters or digital displays.
Practical Use Cases in Project Management
In practice, this template shines in agile environments. A scrum master might use tree slides to visualize sprint backlogs, categorizing tasks by priority and assignee. Real-life application: A consulting firm employed arrow charts to map client onboarding processes, reducing setup time by 30% through clearer steps. For data scientists, arrows can represent algorithm flows, making presentations to non-technical stakeholders more accessible. Integrate with tools like Microsoft Project for data syncing, or add custom animations for emphasis on critical paths.
Implementing the Template Step by Step
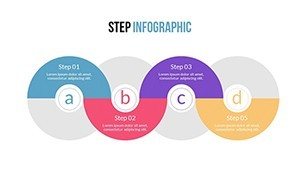
- Choose a tree or arrow slide based on your data structure - trees for branches, arrows for directions.
- Populate with content: Drag and drop elements to build your diagram.
- Apply animations: Set entrances and exits to reveal information progressively.
- Customize visuals: Match arrows to brand colors or adjust tree nodes for depth.
- Review interactions: Simulate the presentation to ensure smooth flow.
- Share or present: Export to PDF for handouts or run live for discussions.
This method, inspired by project management best practices from PMI, ensures your charts not only display data but facilitate actionable insights.
Superior to Standard Chart Options
Unlike basic PowerPoint arrows or org charts, this template includes pre-animated components that save setup time and add professionalism. Standard tools often lack fluidity in animations, leading to clunky transitions, whereas here, everything is optimized for engagement. For analysts, this means focusing on interpretation rather than design. Compatibility with older PowerPoint versions and easy export to Google Slides broadens usability.
Expert Tips for Dynamic Presentations
- Layer animations wisely: Avoid overload by timing reveals to match your narration.
- Use arrows for causality: Show cause-effect in business models for persuasive arguments.
- Scale trees dynamically: Expand or collapse branches for interactive Q&A sessions.
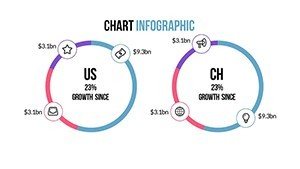
- Incorporate metrics: Embed KPIs in nodes to quantify hierarchies.
- Ensure responsiveness: Test on various devices for consistent viewing.
Drawing from animation principles used in UX design, these strategies elevate your charts from static to storytelling tools.
Embracing this template means empowering your team with visuals that clarify and motivate. From identifying bottlenecks in processes to celebrating milestones in trees of achievements, it's a game-changer. Seize the opportunity to enhance your presentations - download the Animations Components PowerPoint Charts today and watch your ideas flow seamlessly.
FAQ
How do the animations work in this template?
Animations are pre-set on components, allowing sequential reveals; customize via PowerPoint's animation pane for timing and effects.
Is it suitable for non-technical users?
Absolutely, the intuitive interface makes editing straightforward, with drag-and-drop for trees and arrows.
Can I add more animations?
Yes, PowerPoint's built-in tools let you layer additional effects on any element.
What file types are supported?
Primarily .pptx, with easy conversion to other formats like PDF.
Are there examples included?
The template features sample data in slides to guide your customizations.
How many levels in tree charts?
Up to five levels standard, but expandable by duplicating nodes.