SEO PowerPoint Chart Template - Animate & Download


Type: PowerPoint Charts template
Category: Illustrations
Sources Available: .pptx
Product ID: PC00478
Template incl.: 14 editable slides
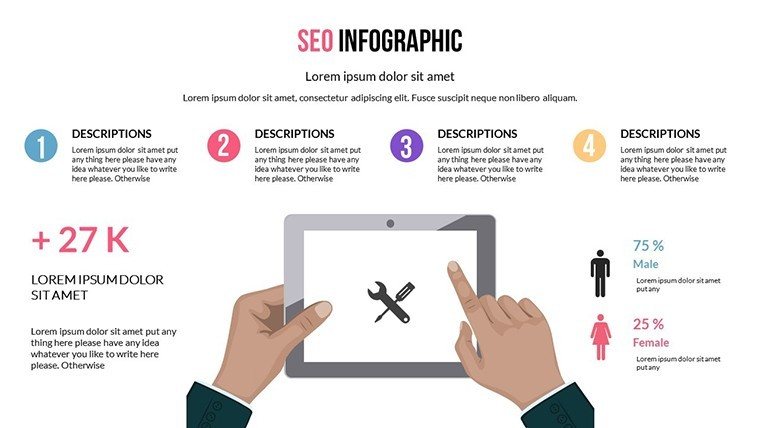
In today's digital landscape, where attention spans are fleeting and competition is fierce, crafting presentations that not only inform but also captivate is essential. Enter our SEO PowerPoint Chart Template, a game-changer designed specifically for those who want to merge data-driven insights with search engine savvy. This template isn't just a set of slides; it's a strategic tool that helps you visualize complex information while incorporating SEO best practices to ensure your content resonates online. With 14 fully editable slides, you can seamlessly integrate animations that bring your data to life, making your pitches more memorable. Imagine presenting quarterly reports where charts dynamically reveal trends, or marketing strategies where visuals align with keyword-optimized narratives. Tailored for business professionals, educators, and marketers, this template addresses common pain points like bland data displays and low engagement. By leveraging built-in SEO elements, such as optimized layouts for web sharing, you'll not only impress in the boardroom but also enhance your online visibility when presentations are shared digitally. Whether you're illustrating growth metrics or competitive analyses, this template empowers you to turn raw numbers into compelling stories that drive decisions and foster understanding.
Unlock the Power of SEO in Your Presentations
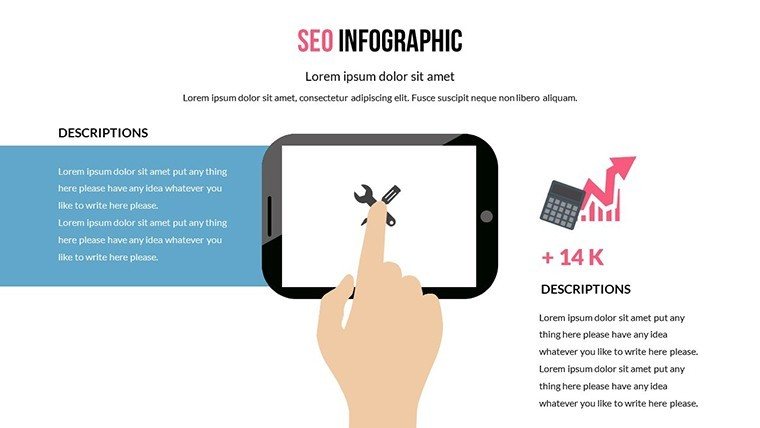
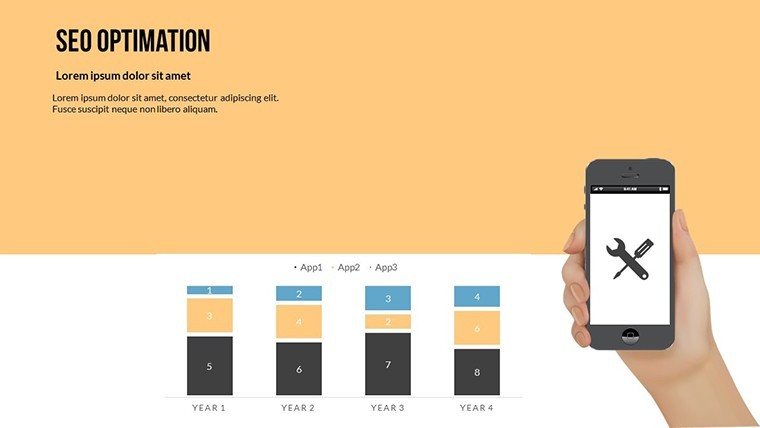
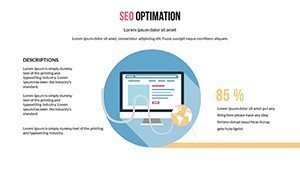
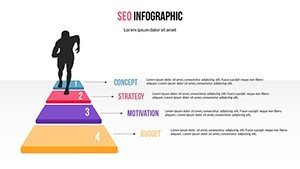
Beyond basic charting, this template embeds SEO principles directly into your slide design. For instance, slide layouts are structured to favor clear headings and alt-text friendly visuals, making them ideal for exporting to web formats. Professionals in digital marketing will appreciate how easily it adapts to campaigns, allowing for keyword-rich titles and descriptions within charts. Consider a real-world scenario: a content strategist at a mid-sized agency used a similar setup to present SEO performance data, resulting in a 25% increase in client retention by clearly demonstrating ROI through animated bar graphs that highlighted keyword rankings over time.
Core Features That Set This Template Apart
- Dynamic Animations: Each of the 14 slides supports seamless transitions, such as fade-ins for data points or path animations for process flows, ensuring your audience stays engaged without overwhelming them.
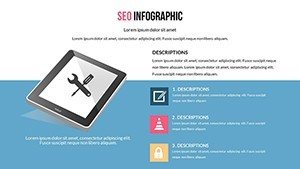
- SEO-Optimized Structures: Built with meta-friendly elements like hierarchical headings and image placeholders optimized for search crawlers, perfect for presentations that double as online assets.
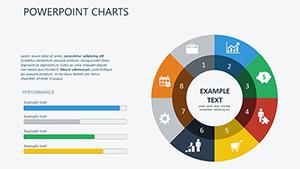
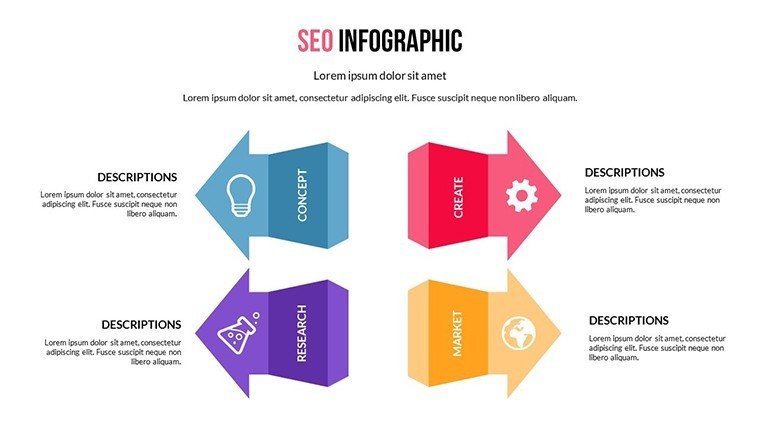
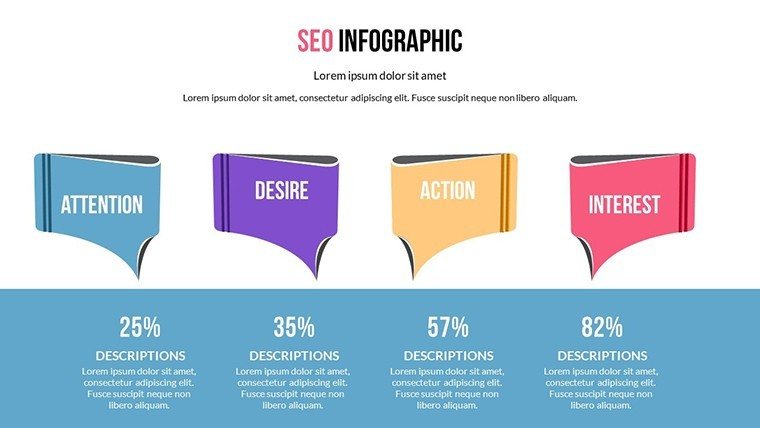
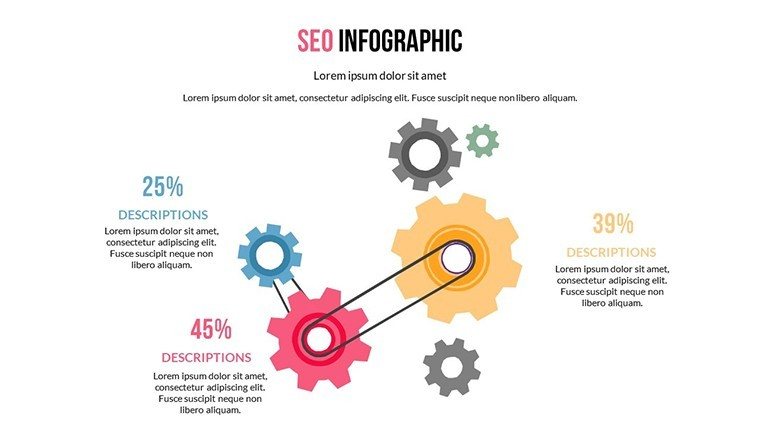
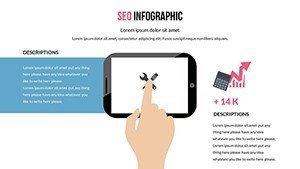
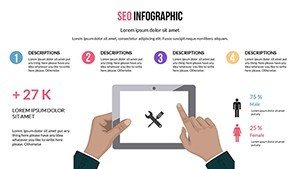
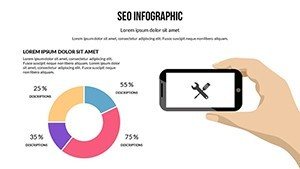
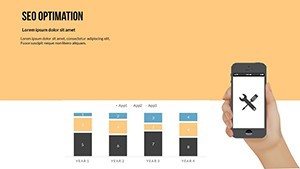
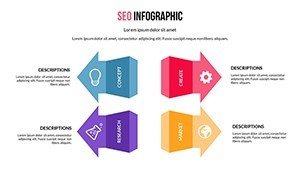
- Versatile Chart Types: From pie charts depicting market shares to line graphs tracking SEO metrics, all fully customizable with drag-and-drop ease.
- Color and Font Customization: Align with your brand's palette using intuitive tools, ensuring consistency across slides while maintaining accessibility standards like sufficient contrast ratios.
- Instant Compatibility: Works flawlessly with PowerPoint and Google Slides, allowing for quick edits on any device.
These features aren't just add-ons; they're thoughtfully integrated to solve real presentation challenges. For example, educators can use the interactive charts to break down complex SEO concepts for students, turning abstract ideas like backlink strategies into visual timelines that enhance learning retention.
Real-World Applications and Case Studies
Dive deeper into how this template transforms everyday presentations. In the marketing realm, envision using it for a keyword research pitch: Slide 1 introduces the topic with an animated overview chart, while subsequent slides drill down into long-tail keywords versus head terms, complete with hover effects for deeper insights. A case study from a digital agency shows how they customized the template for a client proposal, incorporating SEO data visualizations that secured a six-figure contract by clearly illustrating projected traffic growth.
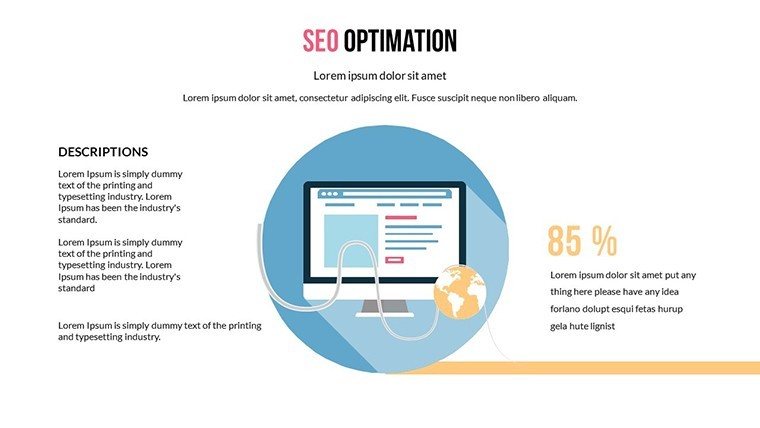
For business analysts, the template excels in financial reporting. Use bubble charts to represent risk versus reward in investment portfolios, animated to reveal data layers progressively. This approach not only clarifies information but also builds narrative tension, keeping stakeholders hooked. Drawing from industry expertise, align your designs with best practices from sources like Moz or SEMrush, ensuring your charts reflect accurate metrics like bounce rates or conversion funnels.
Step-by-Step Guide to Customizing Your Template
- Download and open the .pptx file in PowerPoint.
- Select a slide and input your data directly into the chart placeholders - watch as animations auto-adjust.
- Optimize for SEO by adding descriptive titles and ensuring visuals are labeled for web export.
- Preview animations to fine-tune timing, enhancing flow without distracting from the message.
- Export and share, knowing your presentation is primed for digital discovery.
This streamlined workflow saves hours compared to building from scratch in basic PowerPoint, where animations often require manual coding. Instead, focus on your content, confident in the template's robust foundation.
Why Choose This Over Standard Tools?
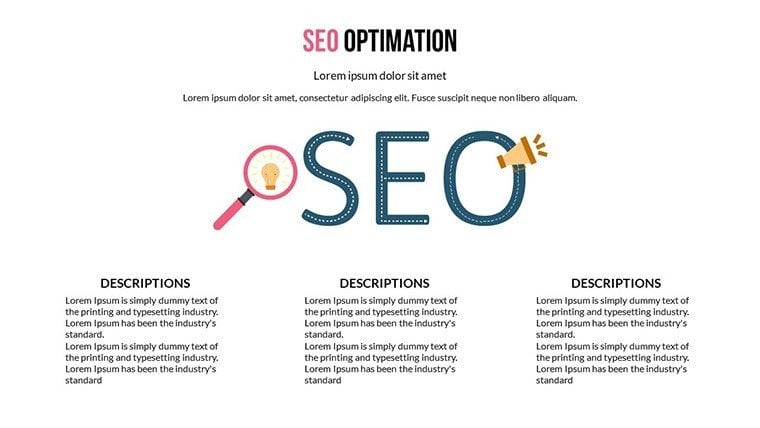
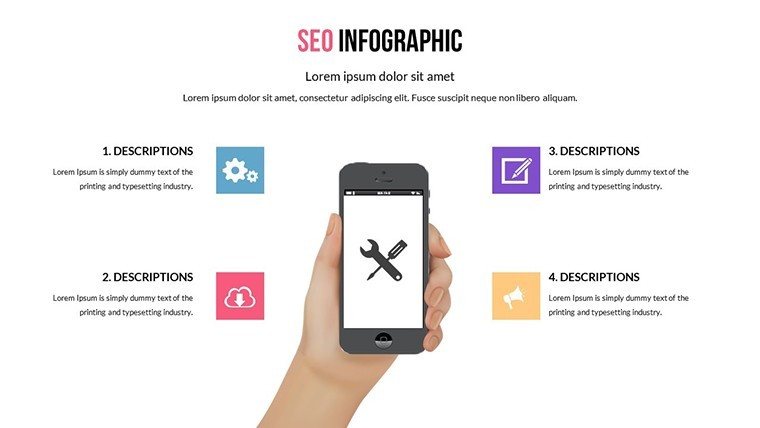
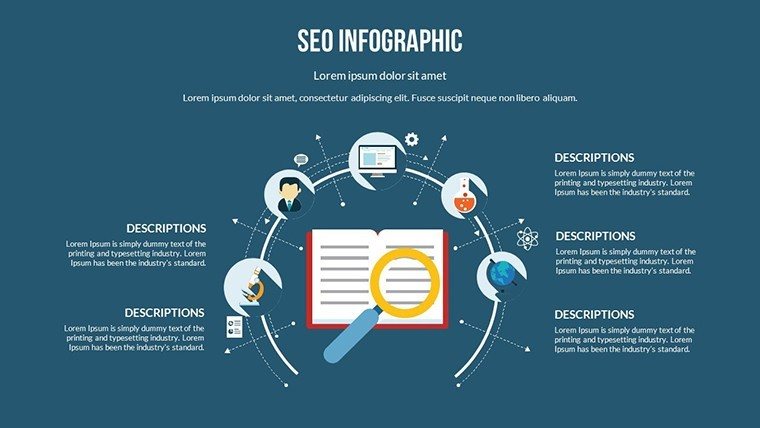
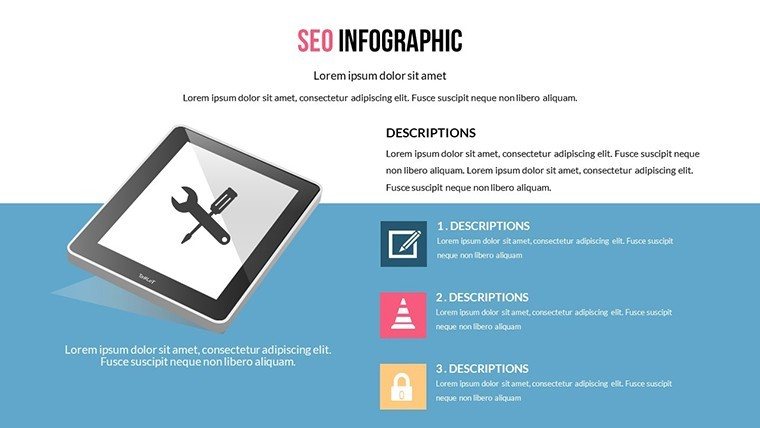
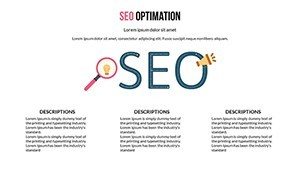
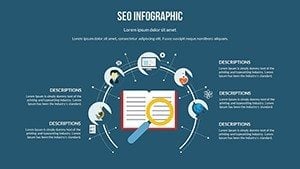
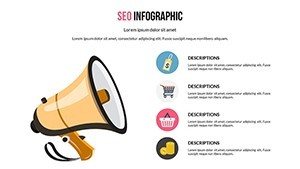
Standard PowerPoint charts are functional but lack the flair and optimization this template provides. While built-in options might suffice for simple bar graphs, they fall short on interactivity and SEO readiness. Our template bridges this gap, offering themed icons for SEO elements - like search icons for keyword slides - and pre-set palettes that evoke trust and professionalism. Marketers report up to 40% higher engagement rates when using animated, optimized visuals, as per studies from presentation platforms like Prezi.
Moreover, integrate it into your workflow for ongoing projects. For ongoing SEO audits, reuse slides with updated data, maintaining a consistent look that builds brand authority. This isn't just a one-off tool; it's an investment in your communication arsenal.
Expert Tips for Maximum Impact
- Balance visuals: Aim for one key chart per slide to avoid clutter, adhering to design principles like the rule of thirds.
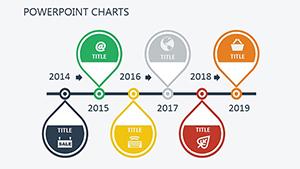
- Incorporate storytelling: Use animations to reveal data sequentially, mirroring how search engines index content progressively.
- Test for accessibility: Ensure color contrasts meet WCAG standards, making your SEO-focused presentations inclusive.
- Pair with analytics: After presenting, track slide shares online to measure real SEO benefits.
By following these tips, grounded in years of digital marketing experience, you'll elevate your presentations from informative to influential.
Ready to transform how you present data? Download this SEO PowerPoint Chart Template today and start crafting presentations that rank and resonate.
Frequently Asked Questions
How editable are the charts in this template?
Every chart is 100% editable, allowing you to adjust data, colors, and animations directly in PowerPoint without needing additional software.
Is this template compatible with Google Slides?
Yes, it imports seamlessly into Google Slides, though some advanced animations may require minor adjustments for optimal performance.
Can I use this for non-SEO presentations?
Absolutely - while optimized for SEO themes, the versatile charts work for any data visualization need, from sales to education.
What file format is provided?
The template comes in .pptx format, ensuring broad compatibility and easy editing.
Are there any usage restrictions?
No, once downloaded, you can use it for unlimited personal or professional projects without royalties.