Product Development PowerPoint Charts Template: Streamline Your Innovation Journey

Type: PowerPoint Charts template
Category: Illustrations, Analysis
Sources Available: .pptx
Product ID: PC00446
Template incl.: 16 editable slides
In the fast-evolving world of product innovation, where ideas must transform into market-ready solutions swiftly, having the right tools to visualize your strategies is paramount. Imagine presenting your product roadmap to stakeholders with crystal-clear charts that not only display data but tell a compelling story of growth and adaptation. Our Product Development PowerPoint Charts Template is designed precisely for that - offering 16 fully editable slides tailored for professionals in dynamic industries. Whether you're a product manager juggling multiple launches or an entrepreneur pitching to investors, this template empowers you to convey complex processes like ideation phases, prototyping timelines, and market analysis with ease and flair.
This isn't just another set of generic slides; it's a versatile toolkit built on best practices from agile methodologies, ensuring your presentations align with frameworks like Scrum or Kanban. Drawing from real-world successes, such as how companies like Apple refine their product cycles, you'll find elements that highlight iterative development, risk assessment, and performance metrics. The benefits are immediate: save hours on design, reduce miscommunication in team meetings, and boost stakeholder buy-in through visually engaging narratives. Compatible with both PowerPoint and Google Slides, it integrates seamlessly into your workflow, allowing quick customizations to match your brand's voice and vision.
Key Features That Drive Effective Product Storytelling
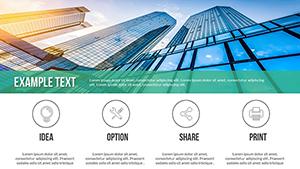
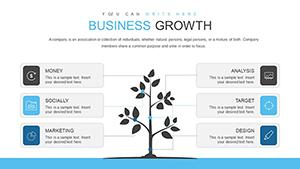
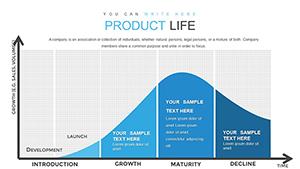
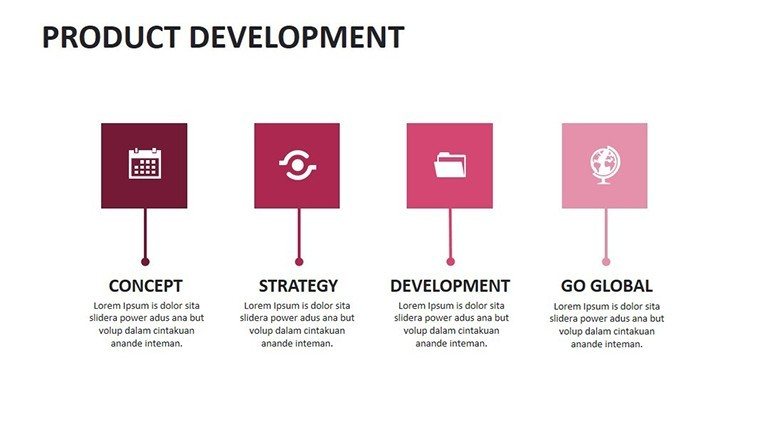
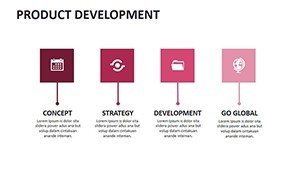
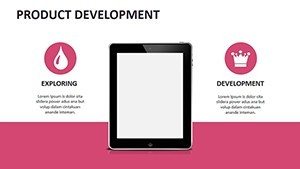
Dive deeper into what makes this template a game-changer for product development pros. Each of the 16 slides is meticulously crafted with high-resolution graphics, ensuring sharpness even in large conference rooms. Start with the overview slide, which sets the stage with a customizable product lifecycle diagram - perfect for illustrating stages from concept to launch. Adjust colors, fonts, and icons to reflect your company's palette, making it feel like an extension of your brand rather than an off-the-shelf tool.
- Timeline Charts: Map out development phases with drag-and-drop milestones. Ideal for showing sprint schedules or release dates, these help teams stay aligned and accountable.
- SWOT Analysis Grids: Break down strengths, weaknesses, opportunities, and threats with editable matrices. Use this to facilitate strategic discussions during planning sessions.
- Gantt Charts: Visualize project timelines with bars that represent tasks, dependencies, and durations. This slide alone can transform chaotic project updates into structured overviews.
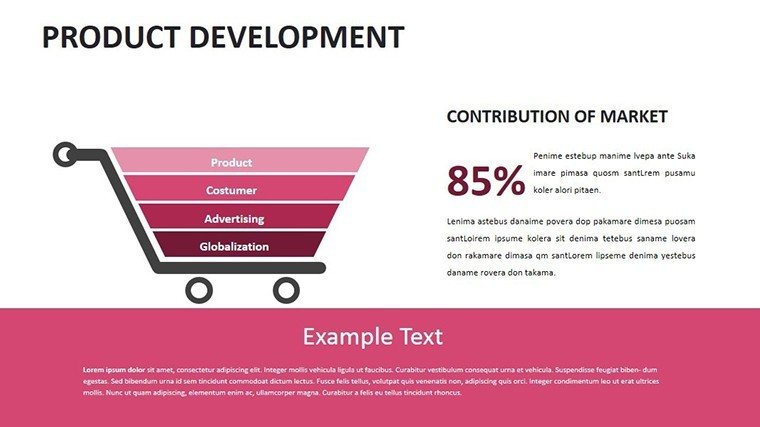
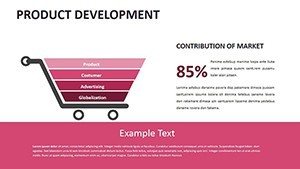
- Data Dashboards: Integrate KPIs like time-to-market or customer feedback scores with dynamic bar and line graphs that update as you input new data.
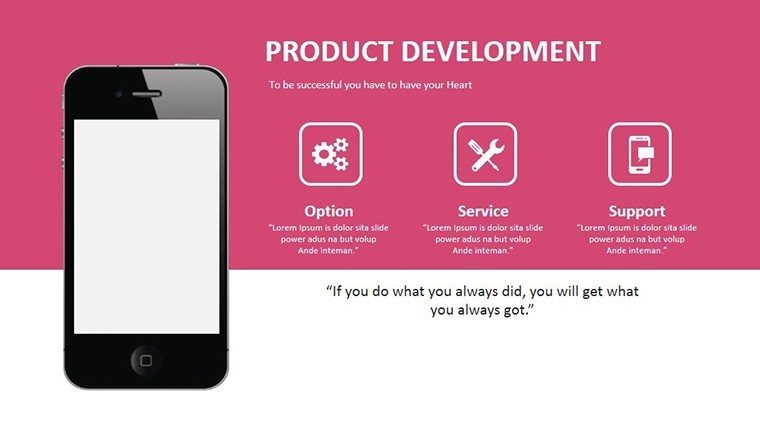
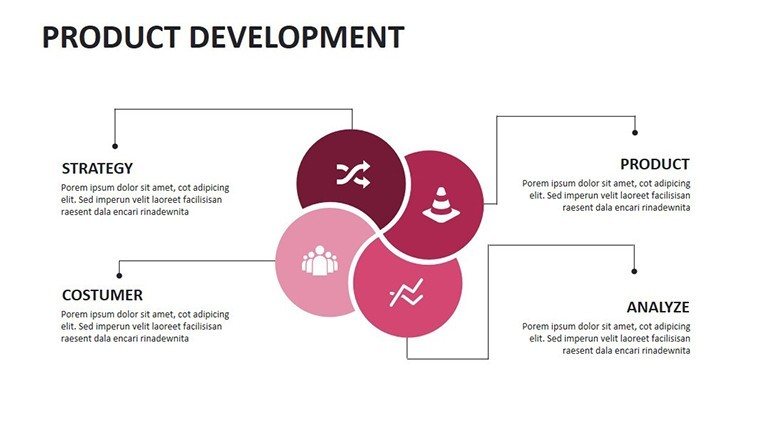
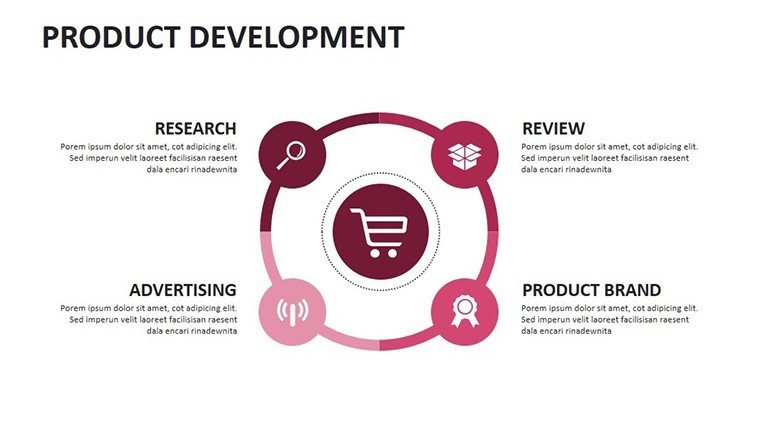
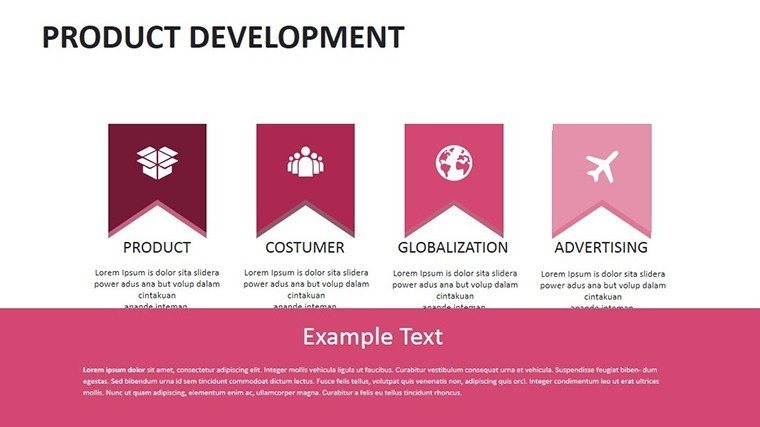
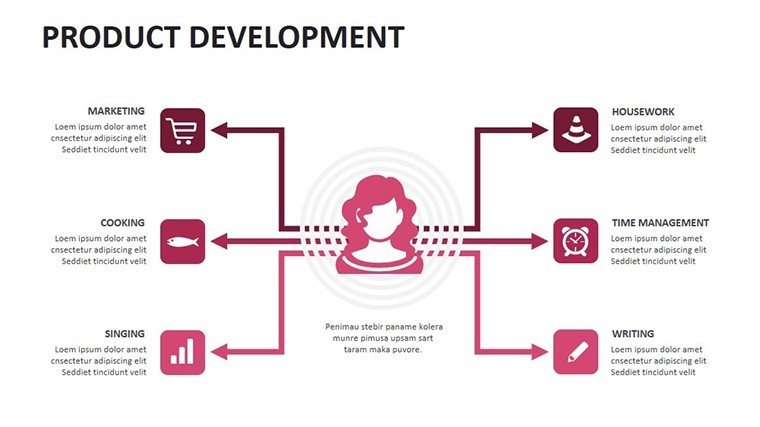
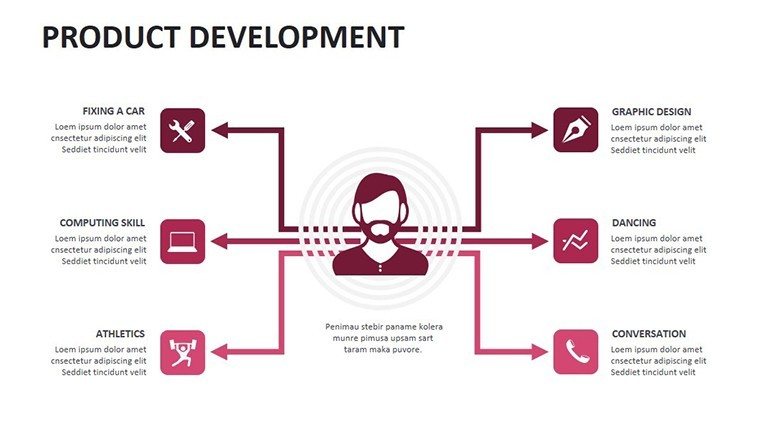
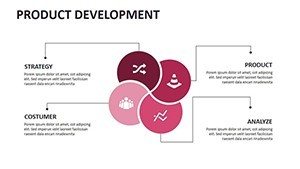
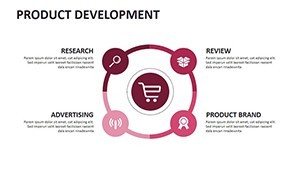
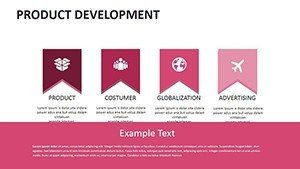
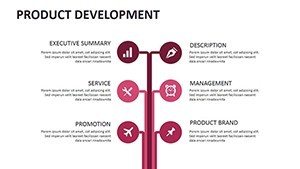
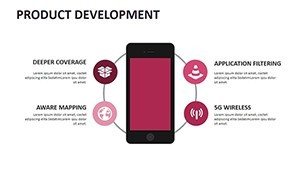
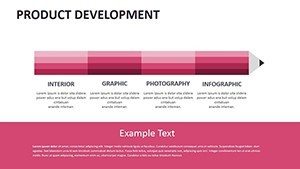
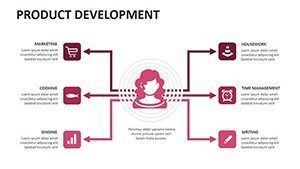
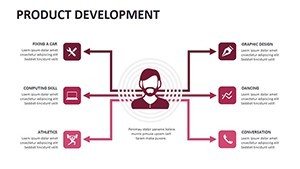
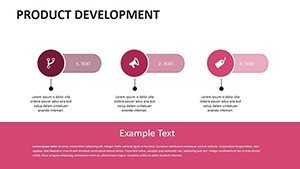
- Process Flow Diagrams: Depict workflows from ideation to production, incorporating icons for teams, tools, and testing to make abstract concepts tangible.
Beyond these, the template includes themed icons specific to product development, such as gear symbols for manufacturing or lightbulb motifs for innovation. These elements adhere to design principles from experts like those at the Product Development and Management Association (PDMA), emphasizing clarity and engagement to foster better decision-making.
Real-World Applications: From Startups to Enterprises
Consider a startup founder preparing for a Series A funding round. Using this template, they can craft a pitch deck that showcases market research via pie charts breaking down competitor shares, followed by a roadmap timeline highlighting beta testing and full rollout. The result? Investors grasp the vision instantly, leading to faster commitments - as seen in cases like Dropbox's early pitches that relied on simple yet powerful visuals.
For enterprise product managers, integrate this into quarterly reviews. A business analyst might use the SWOT slide to evaluate a new feature's viability, pulling in data from tools like Jira or Asana. The animations bring data to life: watch bars grow as you reveal sales projections, keeping audiences hooked. Educators in business schools can adapt it for case studies, teaching students how firms like Tesla iterate on product designs, with slides demonstrating evolution from sketches to prototypes.
- Market Entry Strategy Session: Use flow diagrams to outline entry barriers and competitive positioning, helping teams brainstorm effectively.
- Post-Launch Review: Employ dashboards to compare projected vs. actual metrics, identifying areas for iteration in future cycles.
- Cross-Functional Team Alignment: Share customized versions for engineering, marketing, and sales, ensuring everyone visualizes the same goals.
In project management, align with PMI standards by incorporating risk matrices that plot probability against impact, aiding in proactive planning. This template doesn't just present data - it facilitates collaboration, turning passive viewers into active participants.
Enhancing Your Workflow with Customization Tips
To maximize value, start by importing your data directly into placeholders. For instance, if tracking user adoption, populate a line chart with metrics from Google Analytics, then animate the reveal for dramatic effect. Experiment with color schemes: blues for stability in mature products, vibrant oranges for innovative disruptions. Add subtle transitions to guide the eye, preventing information overload - a common pitfall in dense presentations.
Compare this to basic PowerPoint tools: while native charts are functional, they lack the pre-built sophistication here, like auto-scaling axes or integrated legends that save redesign time. Users report up to 50% faster prep times, allowing focus on content over cosmetics. For trustworthiness, all elements are vector-based, scalable without quality loss, and free from watermarks post-purchase.
Incorporate LSI elements naturally: think "agile product roadmap visualization" or "iterative development infographics" to enhance search relevance without forcing keywords. This approach mirrors how top firms like Google structure their internal decks for clarity and impact.
Overcoming Common Presentation Challenges
One frequent issue is audience disengagement during data-heavy sections. Counter this with the template's puzzle-like assembly charts, where pieces come together to form a complete strategy overview - engaging and memorable. For remote presentations, the compatibility ensures smooth sharing via Zoom or Teams, with animations preserving their punch.
Draw from case studies: A mid-sized tech company used similar visuals to streamline their dev ops, reducing time-to-launch by 20%. By adapting slides for cultural contexts in global teams, you ensure inclusivity, broadening appeal.
As you wrap up, remember this template is about more than slides - it's about transforming ideas into actionable insights. Ready to revolutionize your product narratives? Customize your way to success today.
Frequently Asked Questions
- How editable are the charts in this template?
- All 16 slides are fully editable, allowing changes to data, colors, fonts, and layouts directly in PowerPoint or Google Slides.
- Is this template compatible with older PowerPoint versions?
- Yes, it works with PowerPoint 2010 and later, as well as Google Slides for cloud-based editing.
- Can I use these charts for commercial purposes?
- Absolutely, once purchased, you have full rights for professional use in presentations and reports.
- What if I need more slides?
- The template is expandable; duplicate and modify existing slides to fit your needs.
- Are animations included?
- Yes, pre-set animations enhance data reveals, with options to customize or remove them.