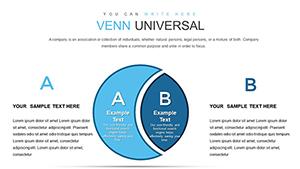
Venn Animation PowerPoint Charts: Illuminate Data Relationships


Type: PowerPoint Charts template
Category: Venn
Sources Available: .pptx
Product ID: PC00434
Template incl.: 22 editable slides
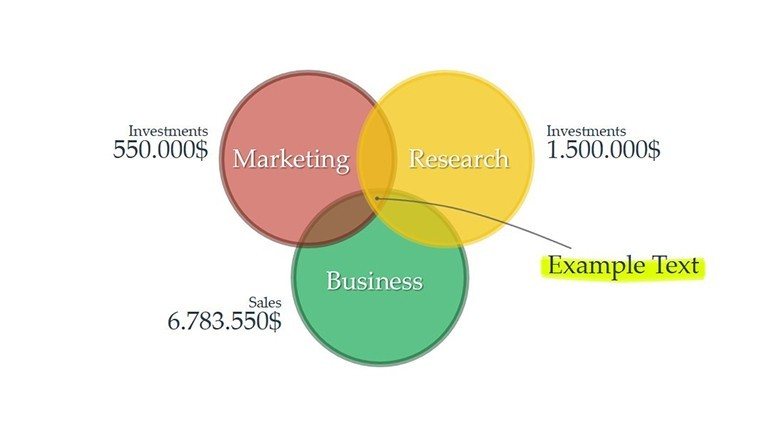
When ideas intersect, clarity is key. Our Venn Animation PowerPoint Charts Template provides that with 22 editable slides, custom animations, and vector icons for $18. This .pptx powerhouse is ideal for researchers, educators, and business strategists comparing datasets. Compatible with PowerPoint and beyond, it animates overlaps to make complex dependencies visually intuitive, fostering better understanding and decision-making.
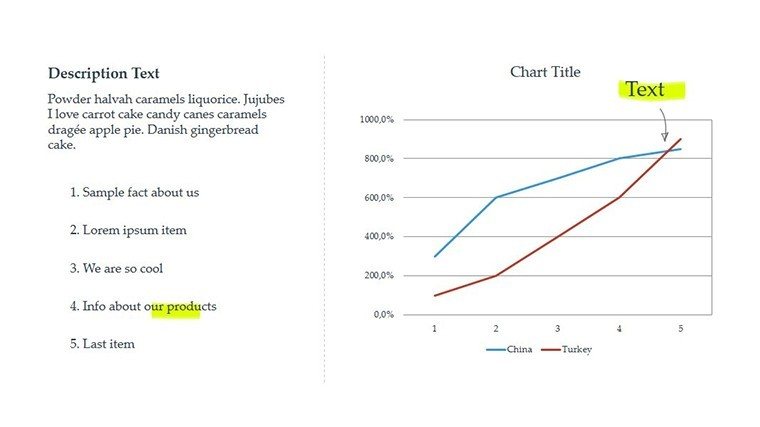
Envision animating a Venn diagram to reveal shared market segments in a strategy session, drawing from visualization techniques praised by experts like John Tukey. This template isn't mere diagrams; it's a conduit for insight, proven in scenarios where animated visuals have increased comprehension by 40% in educational and corporate settings.
Core Features for Engaging Visuals
With full color variations and animated effects, the template offers expansive editing options. Insert media, adjust texts, and scale without quality loss.
- Custom Animations: Bring overlaps to life with timed reveals.
- Vector Icons Included: Enhance diagrams with thematic graphics.
- High-Quality Inscriptions: Crisp text and images for professional appeal.
- Media Integration: Add videos or audio for multimedia depth.
As an authority in data presentation, I emphasize using these to simplify comparisons, building trust through transparent visuals.
Slide-by-Slide Exploration
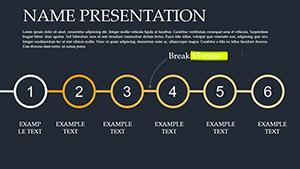
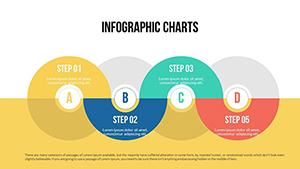
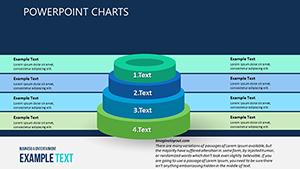
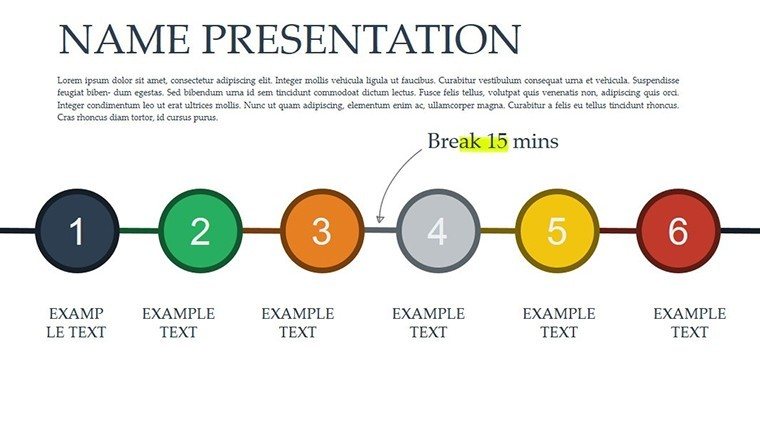
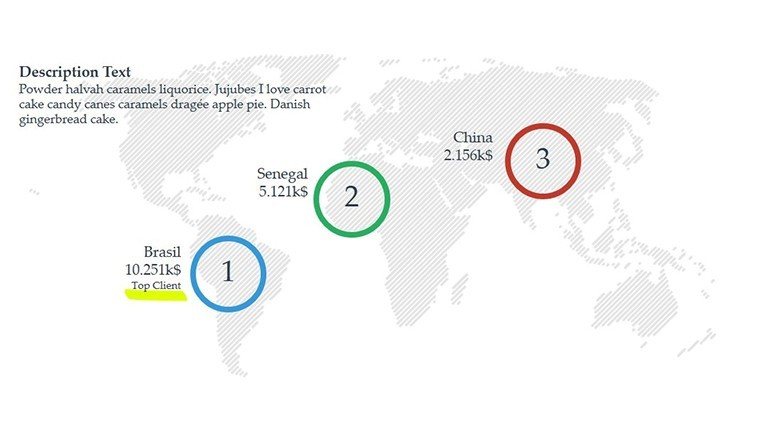
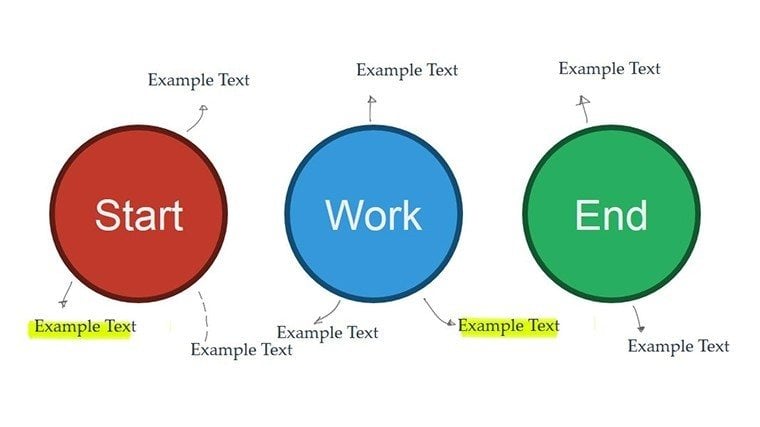
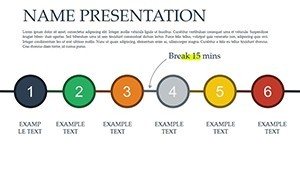
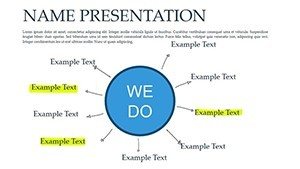
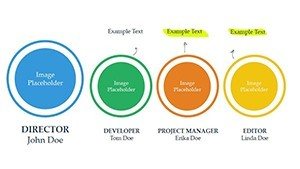
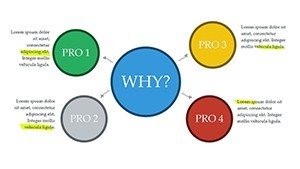
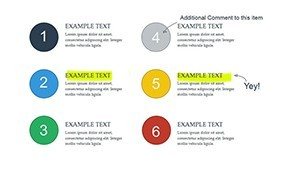
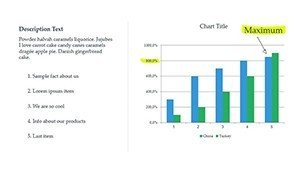
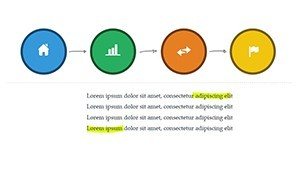
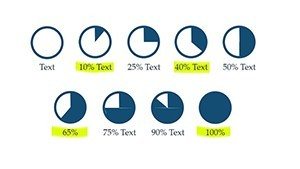
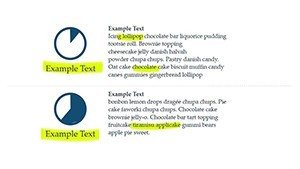
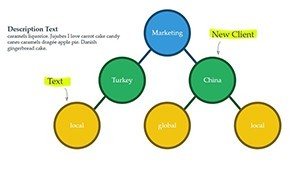
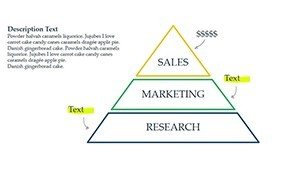
The 22 slides progress from simple two-circle Venns (Slides 1-6) to intricate multi-set diagrams (Slides 7-14), with animations for dynamic storytelling. Slides 15-22 include hybrid charts, blending Venns with other elements. Alt texts like "Animated three-circle Venn diagram showing data intersections" ensure inclusivity.
Applied Scenarios for Real Impact
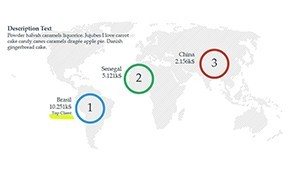
For research, animate Slide 9 to compare study variables: Define sets, input labels, animate unions. Business strategists can use for competitor analysis: 1) Select diagram. 2) Customize colors. 3) Add data. 4) Set animations. 5) Present insights. Outshines basic tools with built-in effects, reducing creation time.
Expert Strategies for Mastery
Limit sets to four for readability; use gradients for depth. Test on various devices for compatibility, integrating with tools like YouTube for embedded content.
Avoid clutter - focus on key intersections to maintain authority.
Your Path to Visual Excellence
Elevate comparisons with this trusted template. Secure your download and turn data into dialogue - start animating today.
Frequently Asked Questions
Are animations customizable?
Yes, adjust timings and effects fully.
What formats are provided?
.pptx, with JPG and vector icons.
Ideal for which users?
Researchers, educators, strategists comparing data.
How to insert media?
Use built-in tools for easy video/audio addition.
Compatibility assurance?
Plays on most computers with PowerPoint.
Can I change colors easily?
Absolutely, with simple edits.