Change Management PPT Charts - Editable PPTX | ImagineLayout


Files and Formats Included
One PPTX file contains the full set.
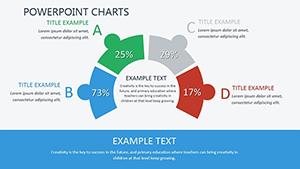
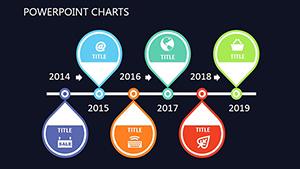
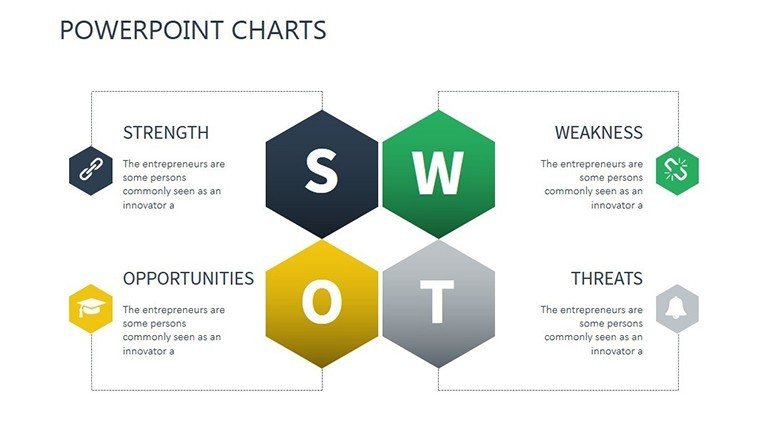
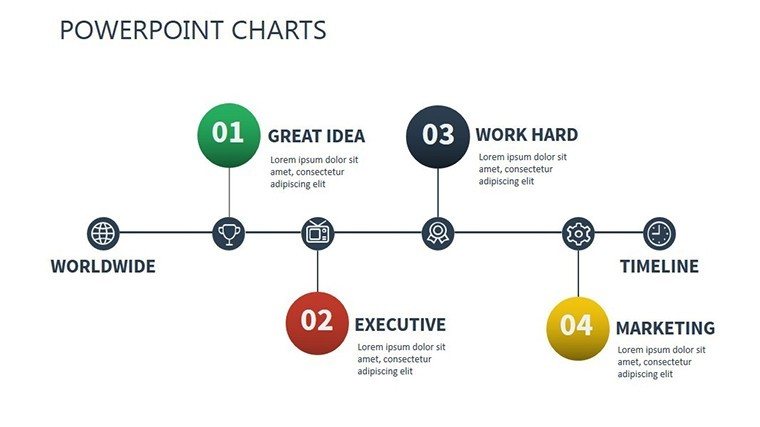
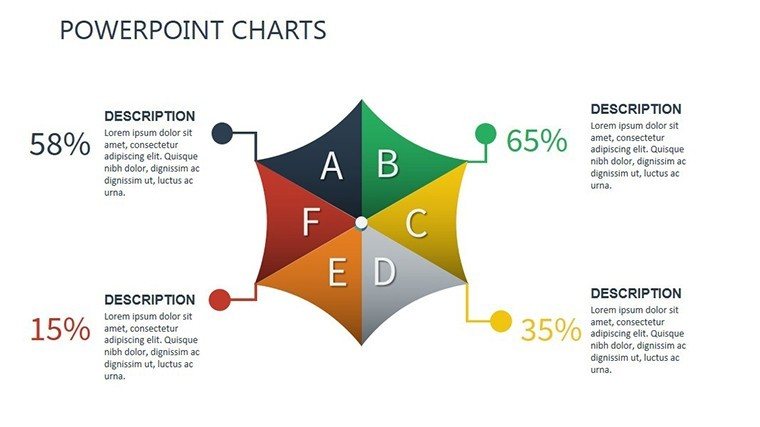
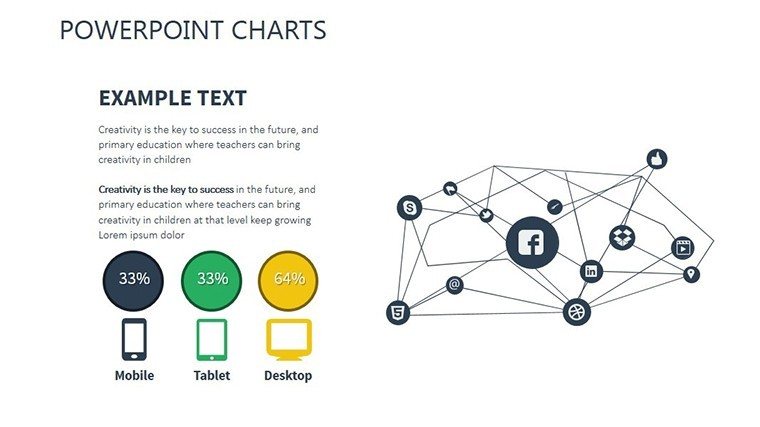
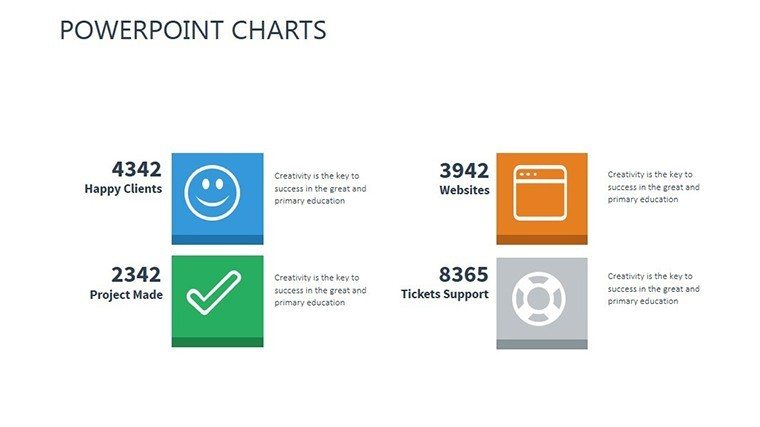
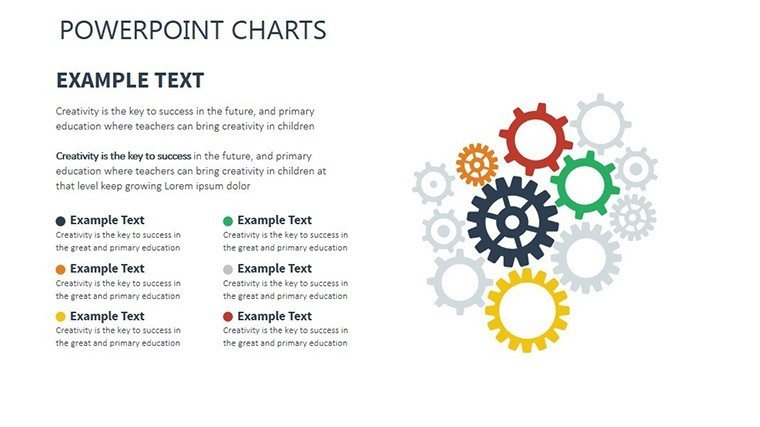
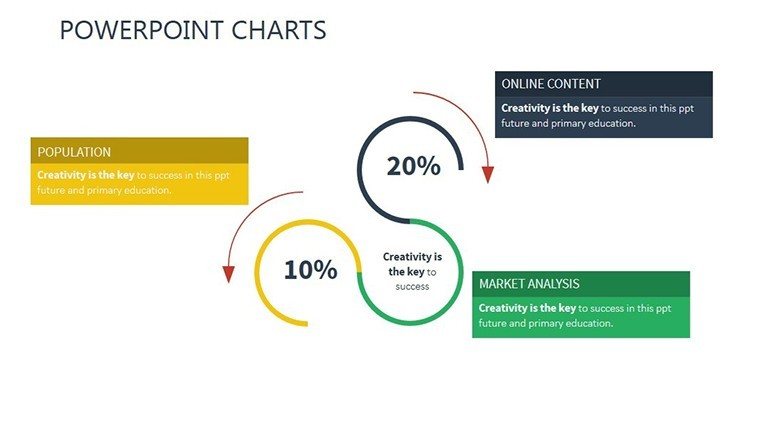
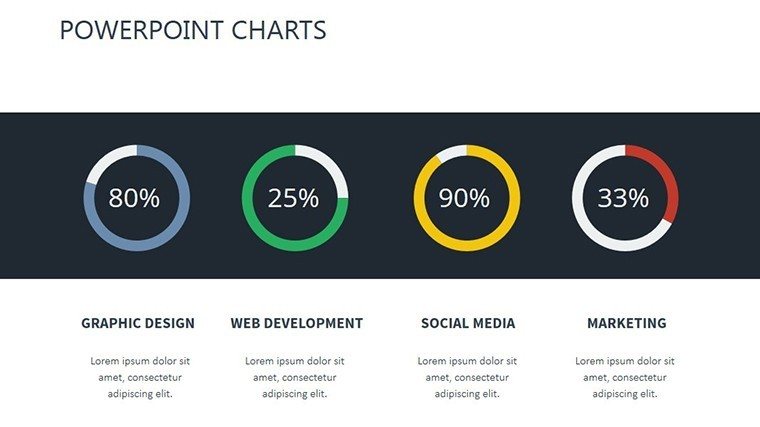
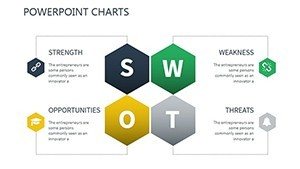
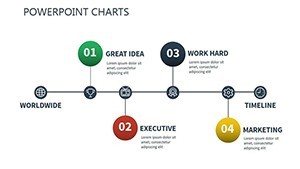
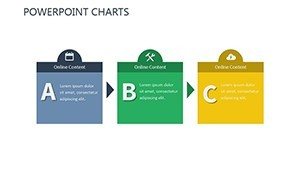
14 editable slides cover org structures, timelines and flows that integrate into any consulting deck.
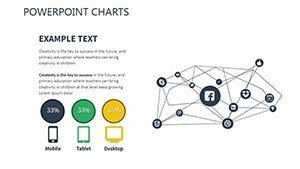
Compared to static single-chart layouts, this pack uses diagram connectors that remain adjustable after data import.
Key Specifications
| Feature | Details |
|---|---|
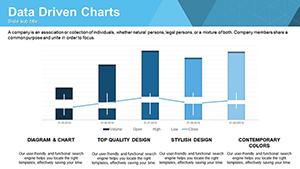
| Slides included | 14 fully editable charts |
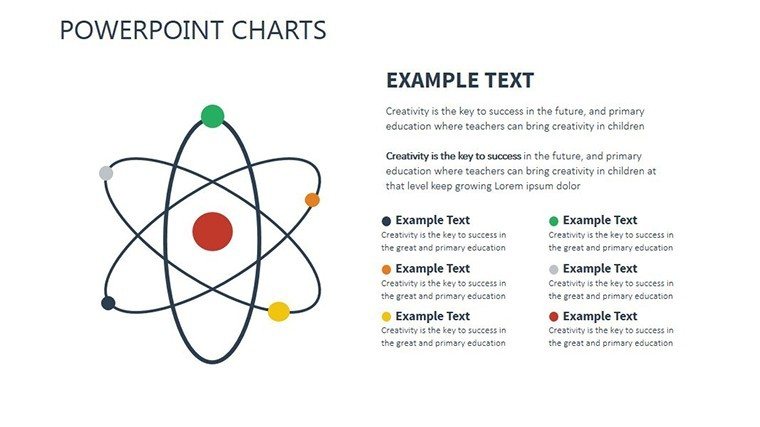
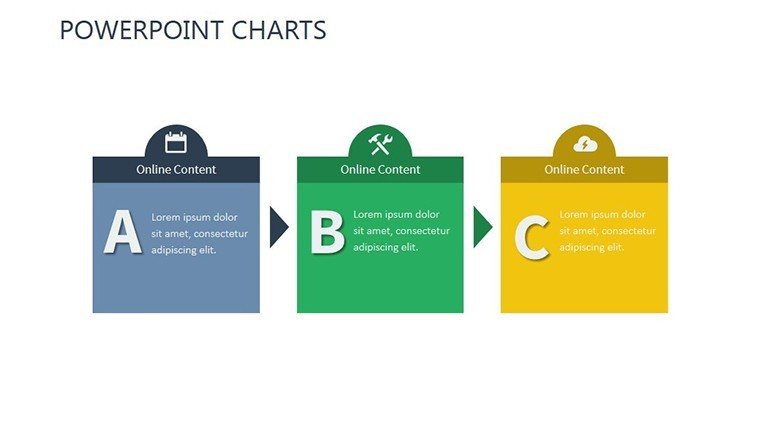
| Diagram categories | org charts, Gantt, process flows |
| Editable elements | shapes, text, arrows |
| Aspect ratio | 16:9 standard |
| PowerPoint compatibility | 2016, 2019, 365, Mac |
| Color schemes | slide master palette |
Customization in 5 Steps
1. Open the .pptx file in PowerPoint (1 minute).
2. Replace placeholder text (3 minutes).
3. Apply brand colors through the master (2 minutes).
4. Adjust chart data or diagram labels (4 minutes).
5. Export as PPTX or PDF (1 minute).
Editing difficulty: Beginner.
Who Reaches for This Template
HR specialist in corporate
An HR specialist in a manufacturing firm reused the file across three client reports by swapping color schemes and reduced preparation time from three hours to 45 minutes.
Project manager in consulting
A project manager adapted the Gantt charts for five consecutive quarterly briefings without redesign.
Download this template now and start editing in minutes.
Building From Scratch vs. Starting Here
Creating equivalent change-management slides manually takes 10 hours and intermediate design skill.
Many presentations crowd labels inside shapes, making them hard to read on projected screens.
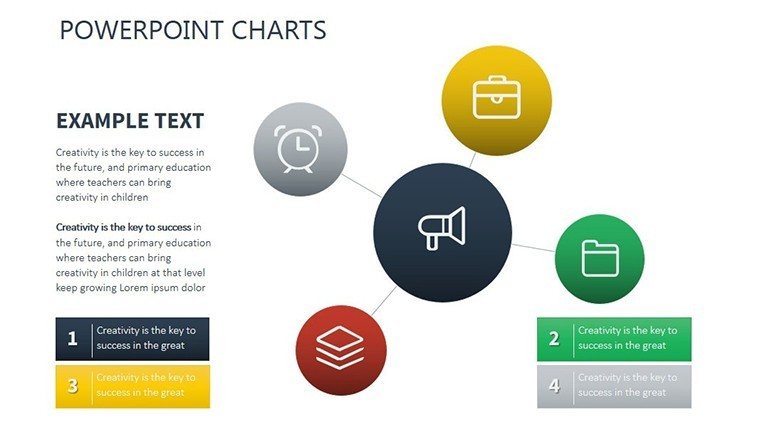
This layout keeps labels external with thin connectors, preserving readability during live meetings.
Flow direction guides the audience through zone segmentation without extra effort.
Secure the file today and present with confidence tomorrow.
FAQ
Which PowerPoint versions support this template?
The PPTX file opens in PowerPoint 2016, 2019, 365 and Mac versions. Import to Google Slides works after upload. Native PowerPoint retains all connector adjustments. Verify compatibility right after purchase.
How do I change the color scheme?
Access the slide master, select the theme colors and update accents. Every org chart and Gantt updates instantly. Save once and the entire deck inherits the change. The step requires less than two minutes.
What does the license permit?
Internal presentations and client deliverables are allowed. Modify and deliver as your own work. Resale of the files or any part is not permitted. The license is per user.
Is there a free version?
No free tier is listed. The paid option delivers all 14 editable slides at once. One $18 purchase unlocks the complete package without restrictions.
What file formats are included?
The download contains only the PPTX file. This opens directly in PowerPoint and exports to PDF. No additional formats ship with the purchase.
Do I receive a refund if it does not fit?
A 30-day refund window applies after download. Return the file if it fails to match your requirements. Full amount is reimbursed once verified. The policy covers every purchase.
Executives link these charts to matrix chart templates during transition planning. Consultants also reference user experience charts for alignment slides.