Transfer Credits PowerPoint Charts: Mastering Financial Transitions


Navigating the complexities of financial transfers can feel like threading a needle in a storm, especially when loans shift banks unexpectedly. The Transfer Credits PowerPoint Charts Template emerges as a beacon for clarity, offering 14 editable slides tailored to demystify credit histories and loan handovers. Crafted with input from financial experts adhering to standards like those from the Consumer Financial Protection Bureau (CFPB), this template empowers bankers, advisors, and educators to present scenarios with precision. Picture illustrating a borrower's journey from one lender to another, highlighting repayment options via accessible ATMs and offices - turning potential anxiety into informed confidence. With Venn diagrams for overlapping credit factors and tables for detailed breakdowns, it's more than slides; it's a toolkit for engaging audiences. Users often note a boost in comprehension during client meetings, as visuals cut through jargon. Fully compatible with PowerPoint and Google Slides, it integrates into your routine effortlessly, saving time while amplifying impact.
Essential Features for Financial Narratives
This template's strength lies in its specialized features, blending Venn and table formats for nuanced financial depictions. Key slides include interactive Venn overlaps showing credit score influences from multiple lenders, customizable to reflect real-time data. Tables allow for columnar comparisons of loan terms pre- and post-transfer, with editable cells for interest rates, fees, and timelines. Design-wise, it adopts a sleek, trustworthy aesthetic with blues and greens evoking stability, far superior to generic spreadsheets that lack visual appeal. Customization extends to font adjustments for accessibility and color schemes matching your firm's branding. In a real-world example, a community bank used similar charts to educate clients on debt consolidation, resulting in higher satisfaction scores per internal surveys. The .pptx format ensures smooth edits, even for those without advanced design skills.
In-Depth Slide Overview
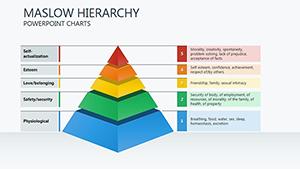
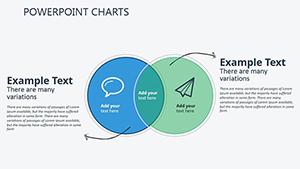
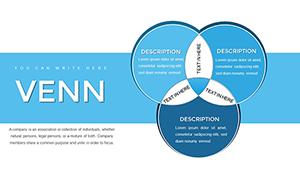
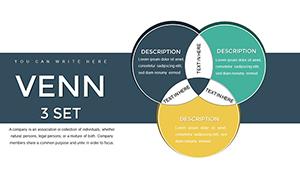
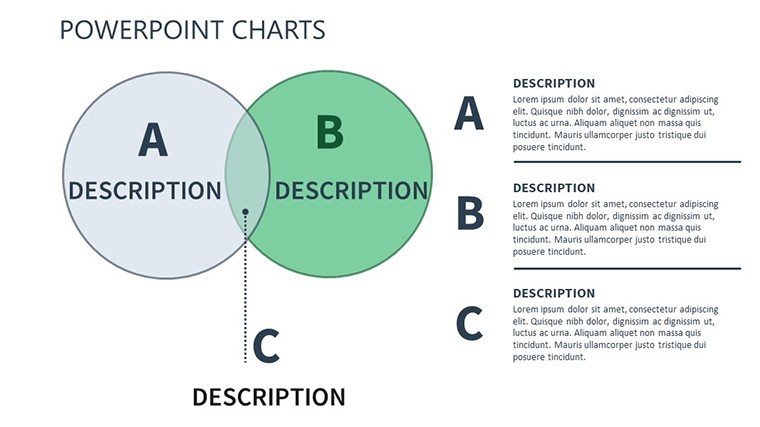
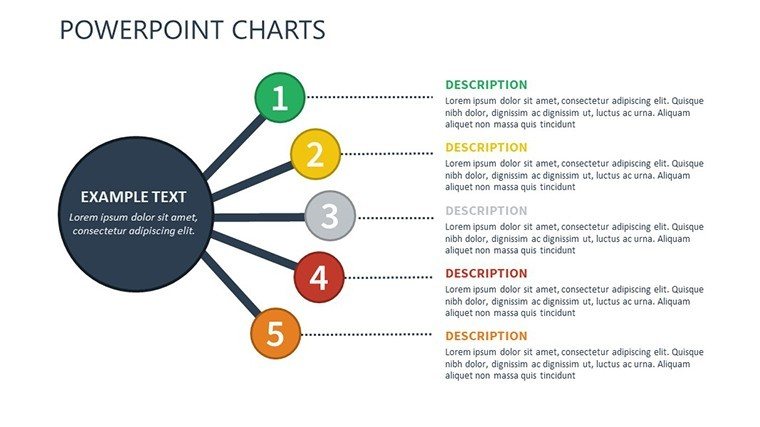
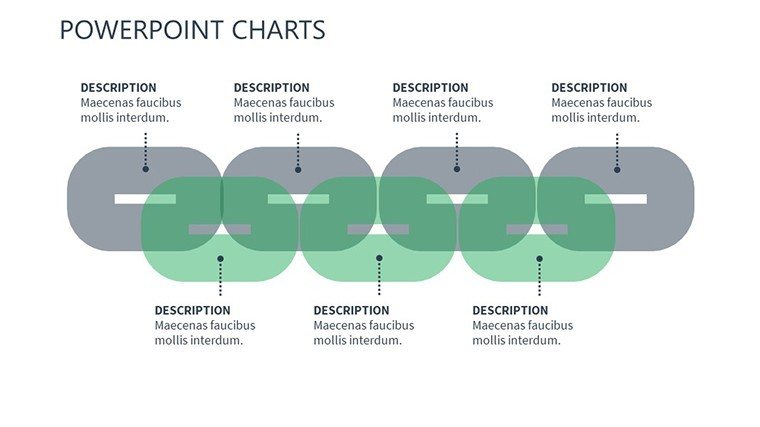
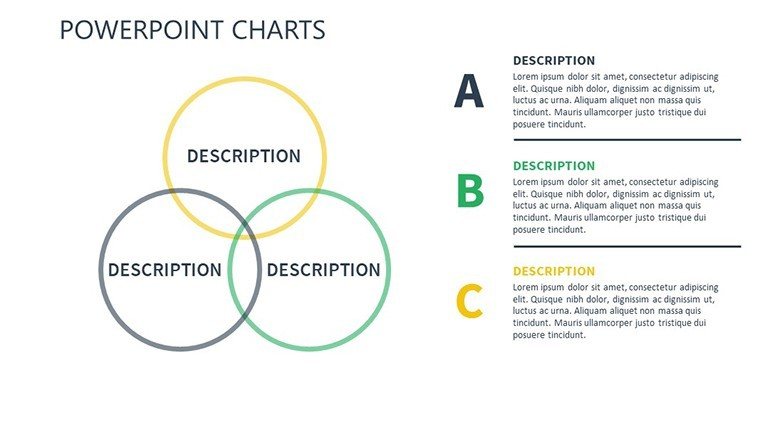
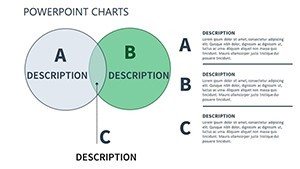
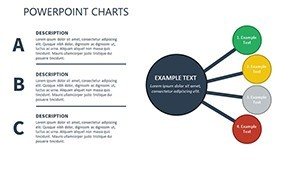
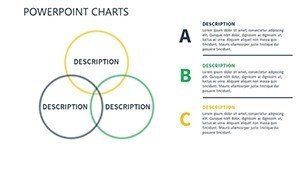
- Slide 1: Introduction Venn - Overlaps borrower profiles with lender criteria, setting the stage for transfer discussions.
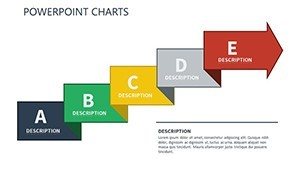
- Slide 2-5: Credit History Tables - Tabular timelines tracking payments and scores, ideal for history reviews.
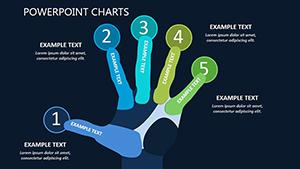
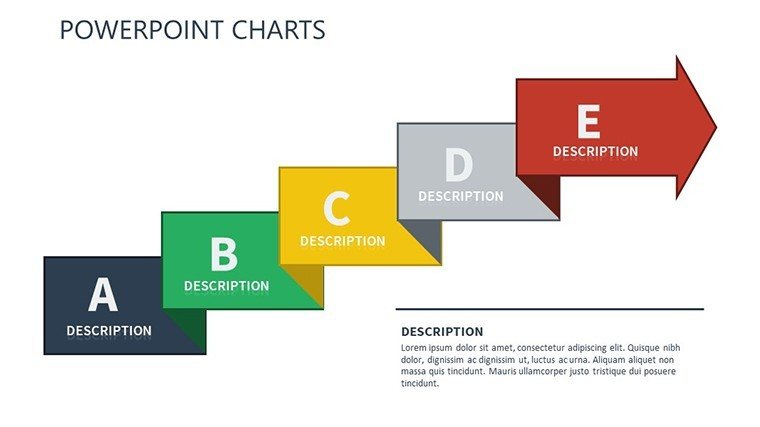
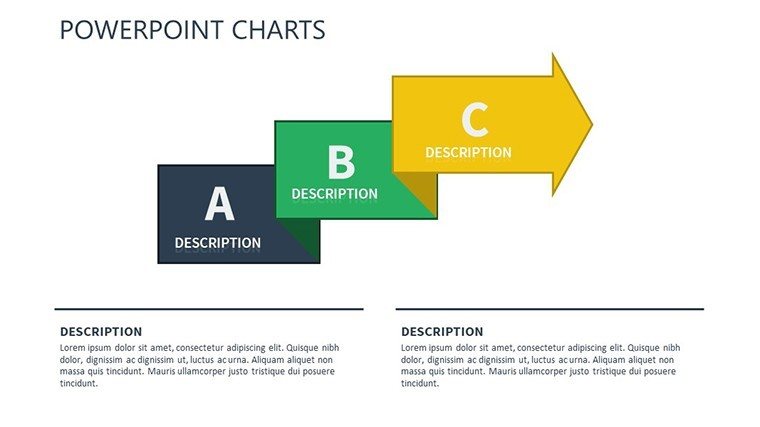
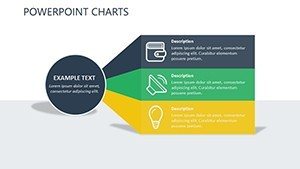
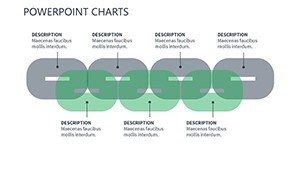
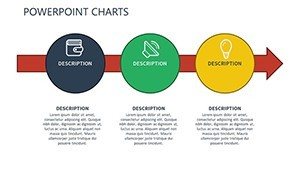
- Slide 6: Loan Transfer Flow - Diagram mapping the handover process, with arrows for step-by-step guidance.
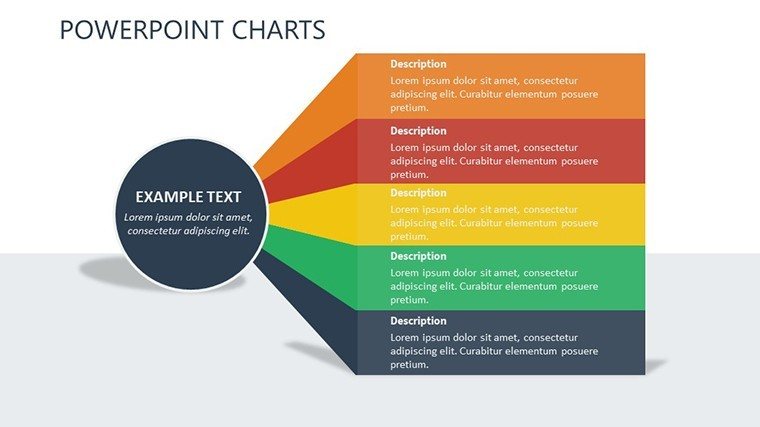
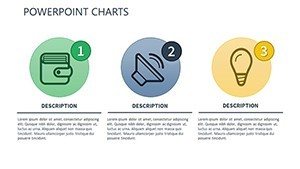
- Slide 7-9: Repayment Option Matrices - Grids comparing ATM networks and office locations post-transfer.
- Slide 10: Risk Assessment Pie - Charts showing potential impacts on credit, data-driven for cautionary tales.
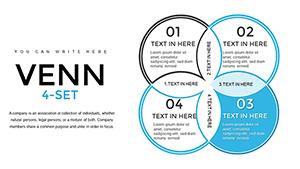
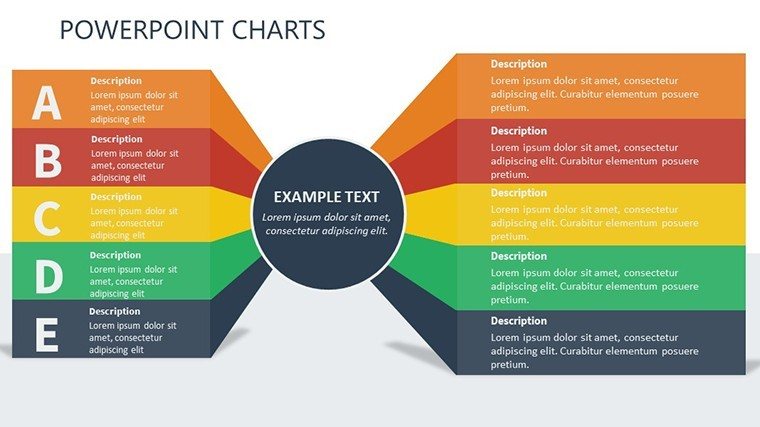
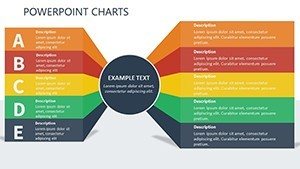
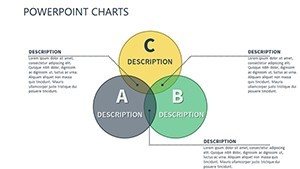
- Slide 11-13: Scenario Simulations - Venn-table hybrids for what-if analyses, like rate changes.
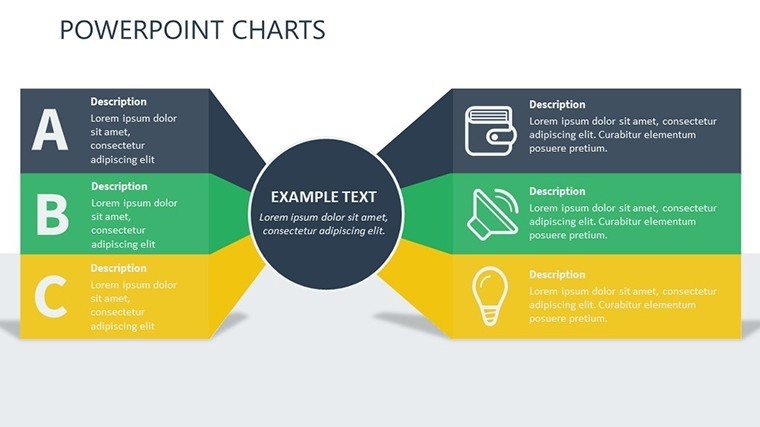
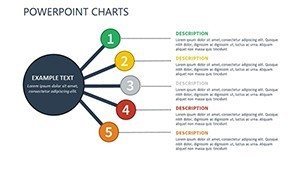
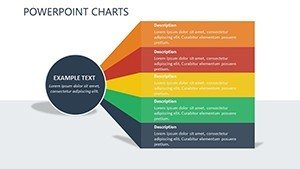
- Slide 14: Summary Action Plan - Table with next steps, prompting client engagement.
These slides provide a comprehensive canvas, scalable for workshops or one-on-one advisories.
Practical Applications in Finance
Apply this template in banking seminars to explain loan sales, using tables to contrast lender networks - vital for borrowers in rural areas. Financial advisors can customize Venns for personalized credit strategies, aligning with CFPB guidelines on transparency. Educators in finance courses benefit by simulating transfers, fostering student discussions on ethics and impacts. A case from a major credit union showed how visual aids reduced client queries by 40%, streamlining operations. Benefits encompass clearer communication, which builds trust; efficiency in prep, cutting hours off slide creation; and professionalism, elevating your firm's reputation. Workflow tip: Import data from banking software, then refine with annotations for narrative flow. For humor's sake, think of it as turning credit chaos into a neatly charted adventure - no more lost in translation.
Pro Tips for Effective Deployment
- Align with audience needs: Tailor Venn overlaps to common transfer pitfalls like hidden fees.
- Use data validation: Ensure tables reflect accurate CFPB-compliant info to avoid misinformation.
- Enhance interactivity: Add hyperlinks to lender sites within slides for seamless navigation.
- Maintain simplicity: Limit table rows to essentials, preventing overload.
- Test for clarity: Run through with colleagues to refine visual cues.
Inspired by financial communication experts, these strategies maximize the template's potential.
Superiority Over Basic Tools
Unlike plain PowerPoint tables that feel static, this template's Venn integrations add depth, revealing intersections like credit overlaps that standard tools miss. At $18.40, it's a steal compared to custom designs, offering ready-to-go professionalism. Its focus on transfer credits fills a niche, making it indispensable for finance pros.
Transform your financial presentations - secure the Transfer Credits PowerPoint Charts Template now and guide your audience through credit journeys with ease.
Frequently Asked Questions
- What chart types are included?
- Venn diagrams for overlaps and tables for comparisons, all editable for financial specifics.
- Is it suitable for client education?
- Yes, perfect for explaining loan transfers clearly and building trust.
- Can I add my own data?
- Easily - import from spreadsheets and customize on the fly.
- Does it support team collaboration?
- Compatible with Google Slides for shared editing.
- How does it handle complex scenarios?
- Through hybrid charts that simulate multi-lender impacts.