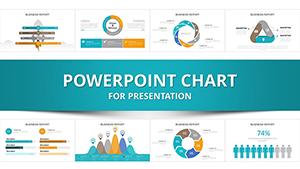
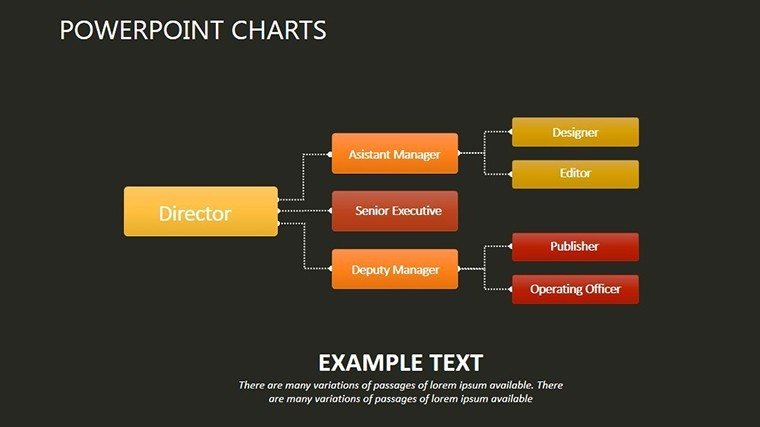
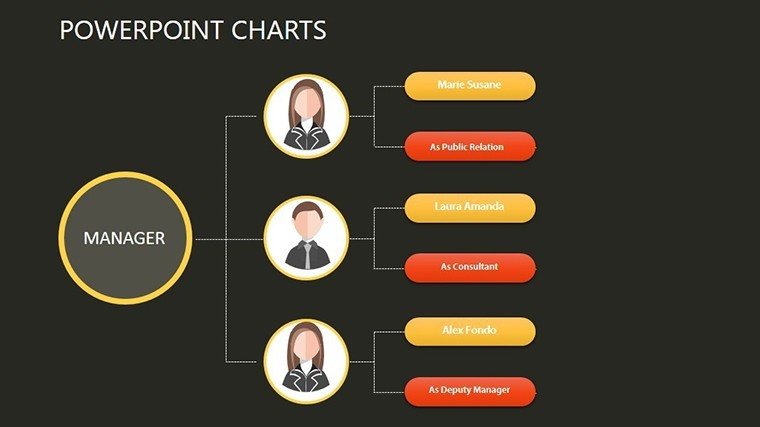
HR Employee Analytics PowerPoint Charts


Type: PowerPoint Charts template
Category: Relationship, Analysis
Sources Available: .pptx
Product ID: PC00381
Template incl.: 20 editable slides
In today's data-driven HR landscape, turning employee metrics into meaningful stories is essential for fostering organizational growth and talent retention. Our HR Employee Analytics PowerPoint Charts template delivers precisely that, with 20 editable slides designed for HR professionals, managers, and analysts. From bar graphs depicting turnover rates to pie charts analyzing workforce diversity, this collection equips you to present complex information with precision and visual appeal. Tailored for corporate environments, it helps communicate strategies that align with business goals, drawing on best practices from bodies like the Society for Human Resource Management (SHRM). Whether you're briefing executives on engagement surveys or training teams on performance trends, these charts simplify data interpretation, saving time and enhancing decision-making. Compatible with various PowerPoint versions, the template's clean designs ensure your presentations resonate, turning raw numbers into compelling narratives that drive change.
Core Features Driving HR Insights
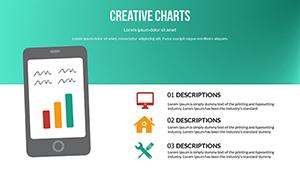
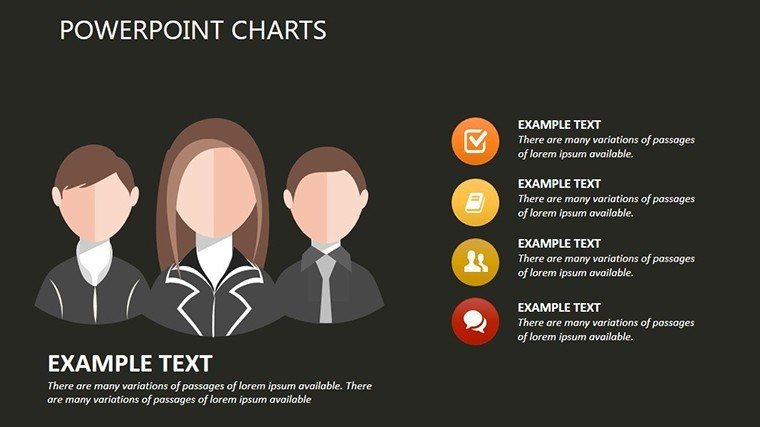
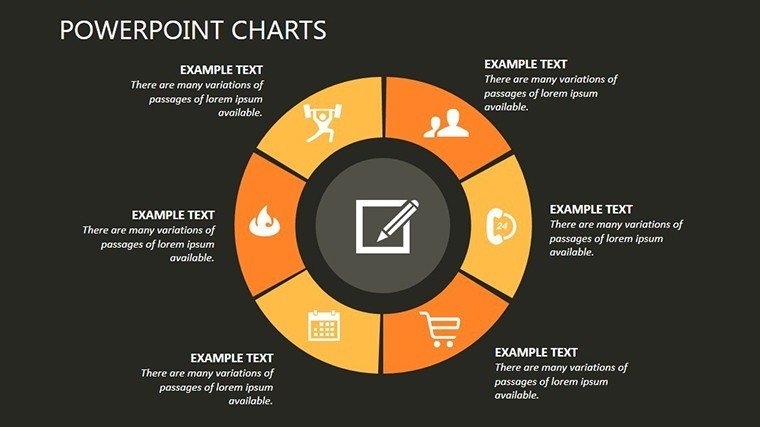
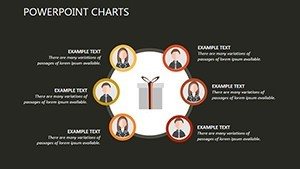
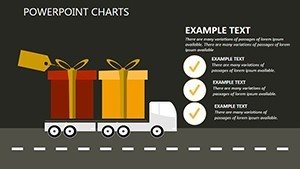
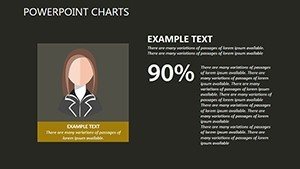
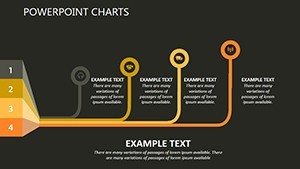
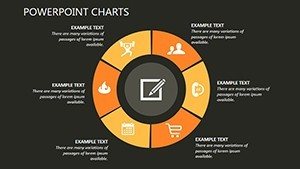
At the heart of this template are versatile chart types, including line graphs for tracking employee development over time and scatter plots for correlating satisfaction with productivity. Customization options abound: alter color schemes to match corporate branding, modify axes for specific datasets, or embed icons for thematic emphasis. Animations provide subtle enhancements, revealing data points progressively to build narrative tension during delivery. For example, animate a retention funnel chart to spotlight drop-off stages, informed by real-world analyses from Deloitte's HR reports.
Targeted Applications for HR Teams
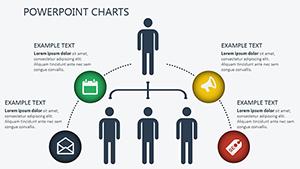
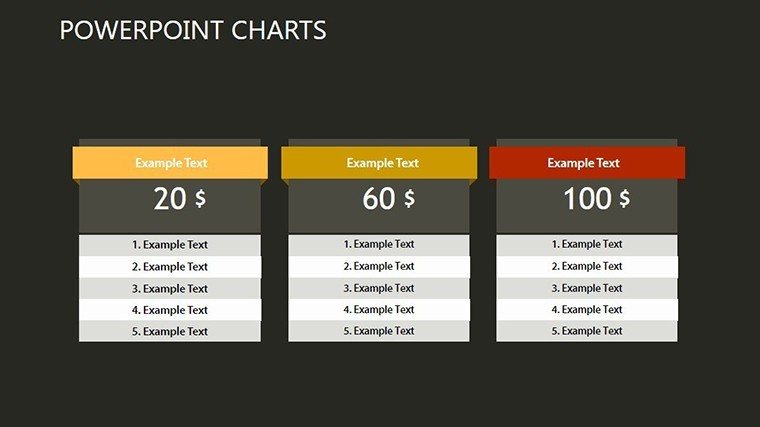
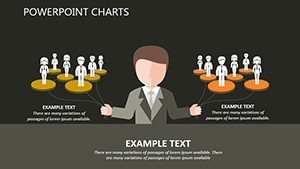
Picture an HR director preparing for a board meeting: Use a dashboard-style slide to consolidate key metrics like absenteeism and promotion rates. This mirrors successful strategies from companies like Google, where data visualization informs people operations. Consultants can adapt for client audits, incorporating LSI elements such as "employee engagement metrics" seamlessly.
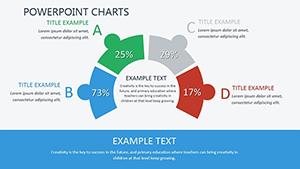
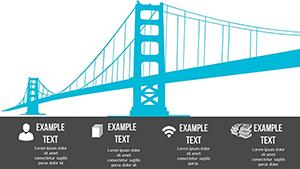
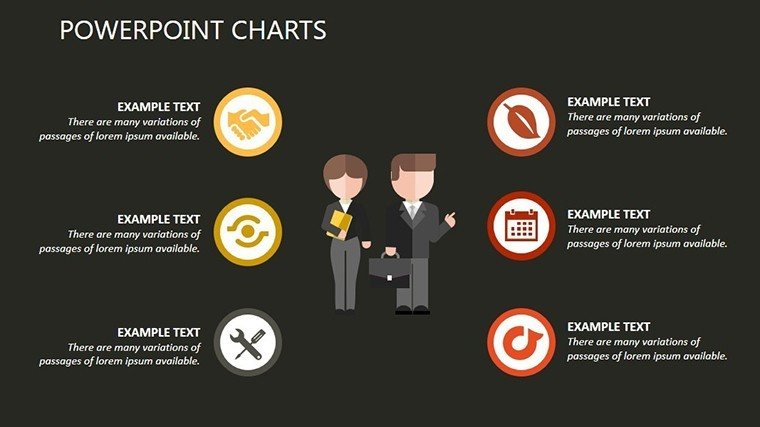
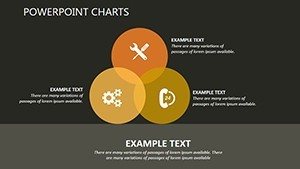
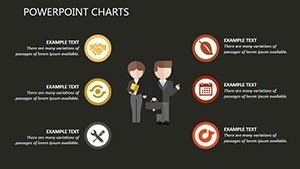
- Diversity Breakdowns: Pie charts to visualize demographics, supporting inclusion initiatives.
- Performance Trends: Line graphs for quarterly reviews, highlighting improvement areas.
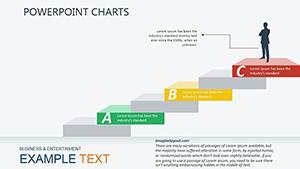
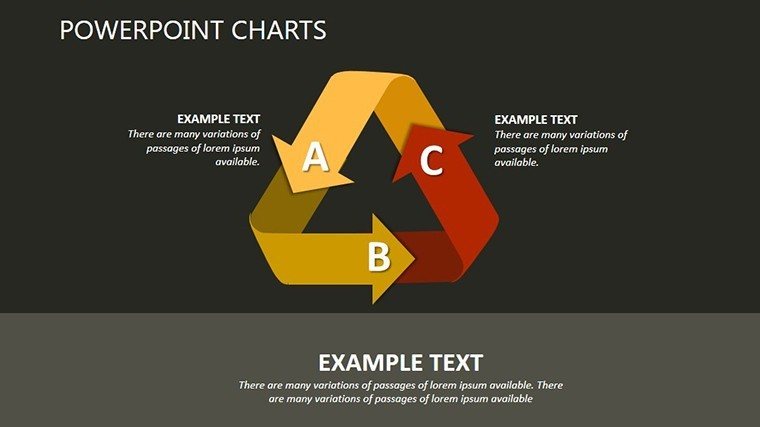
- Recruitment Funnels: Bar graphs to optimize hiring processes.
Educators in HR programs can use these for case-based teaching, referencing studies from Harvard Business Review on analytics-driven HR.
Workflow Integration and Customization Steps
Integrate by importing data from HRIS systems into placeholders, then refine visuals. Add transitions for smooth storytelling, akin to professional consulting decks.
Advanced Presentation Strategies
Start with a hook like a surprising stat on turnover, supported by charts. For virtual formats, ensure scalability. Users note enhanced stakeholder buy-in post-adoption.
End with action-oriented summaries, empowering your HR efforts with data-backed confidence.
Frequently Asked Questions
- How many chart types are available?
- Includes bar, pie, line graphs, and more across 20 slides.
- Can I customize for branding?
- Yes, full editing of colors, fonts, and layouts.
- Is it suitable for training?
- Ideal for sessions on HR topics with engaging visuals.
- What compatibility does it offer?
- Works with multiple PowerPoint versions.
- Are animations included?
- Yes, customizable for impactful delivery.