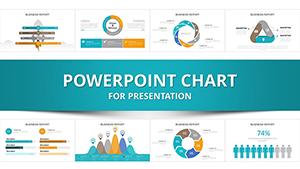
Criteria and Metrics PowerPoint Charts: Blueprint Your Project Evaluations


Every architectural endeavor hinges on measured judgment - from selecting veneers to sequencing subcontractors. Our Criteria and Metrics PowerPoint Charts template, with its 13 versatile editable slides, equips you to navigate these decisions with graphical grace. Aimed at researchers probing material durabilities or executives reviewing portfolio performances, it converts labyrinthine datasets into lucid landscapes, much like a sun path diagram illuminates shadow studies.
Fully attuned to PowerPoint's ecosystem and Google Slides' collaboration features, this template echoes guidelines from the International Building Code's performance metrics, delivering decks that withstand the toughest peer reviews. It's your ally in articulating trade studies, where scatter plots weigh acoustic benefits against thermal gains, turning potential pitfalls into plotted progress.
Firms such as Foster + Partners have long championed metric mastery in pursuits like the Hearst Tower, where data visuals justified innovative diagrid systems. This template arms you with comparable clarity, fostering presentations that not only inform but inspire action in realms from feasibility studies to post-occupancy audits.
Analytical Arsenal: Key Features Tailored for Builders
These 13 slides form a fortified toolkit, blending robust functionality with refined visuals to support the analytical demands of design disciplines.
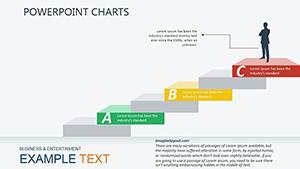
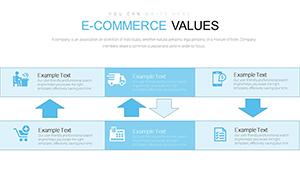
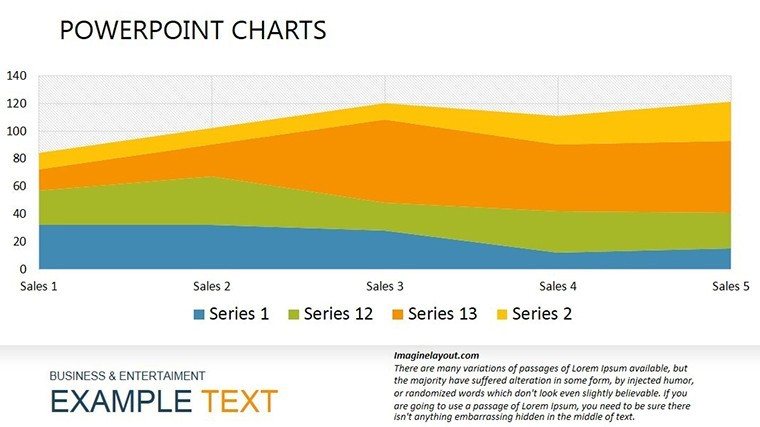
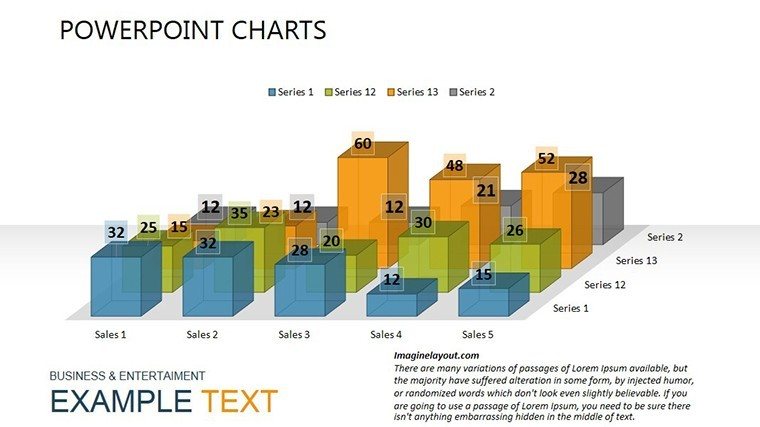
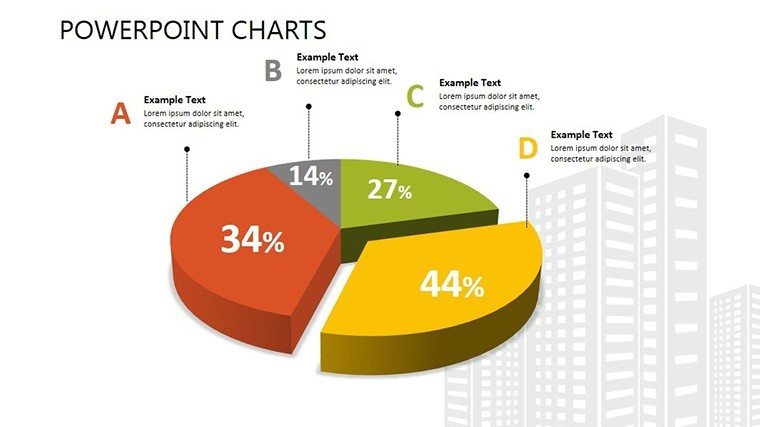
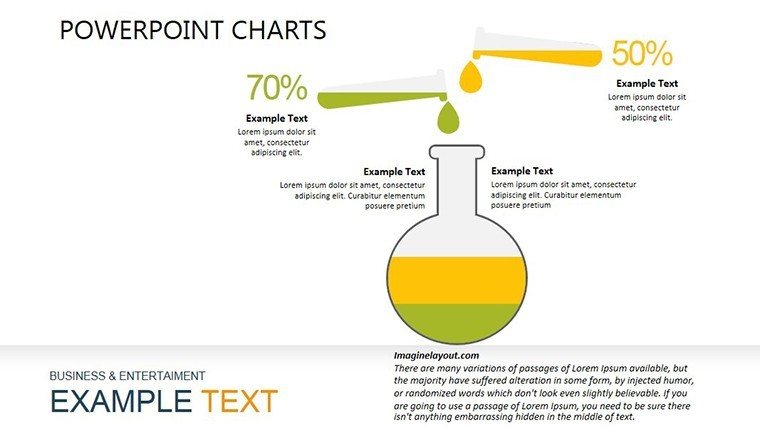
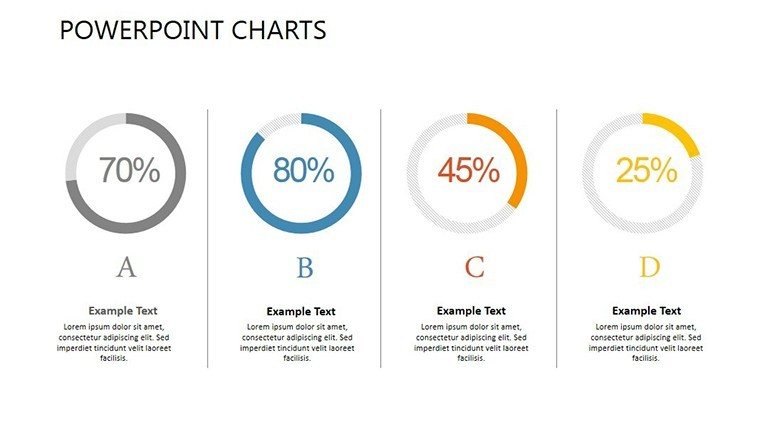
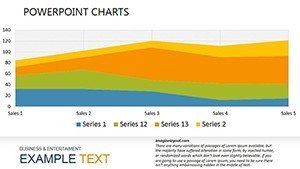
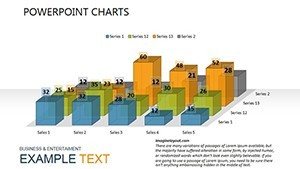
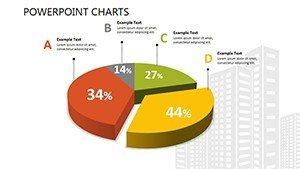
- Comprehensive Chart Spectrum: Scatter plots for correlation analyses (e.g., wind loads vs. form factors), pie charts for resource allocations, all with editable labels and dynamic ranges for precision tuning.
- Themed Visual Enhancements: Icons evoking levels, compasses, and elevations integrate seamlessly, with color gradients customizable to evoke site-specific palettes - like dusk skies for evening venue proposals.
- Streamlined Editing Suite: One-pane access to all adjustments, from font hierarchies to data series toggles, accelerating iterations in fast-turnaround RFPs.
Resolution-optimized for 4K displays, ensuring details like fine gridlines remain tack-sharp, vital for critiquing tolerances in joint ventures.
Integration for Advanced Users
Sync with Revit exports via CSV imports for BIM-derived metrics, or script simple macros for automated variance highlights - elevating your deck from static to smart.
Case Studies in Clarity: Deploying Metrics in Design Narratives
A Boston-based practice evaluating high-rise HVAC options used this template's line graphs to forecast energy savings over decades, overlaying criteria like upfront CAPEX with OPEX curves. The resultant deck swayed developers toward a net-zero pivot, unlocking incentives worth $1.5M - illustrating metrics' role in manifesting eco-conscious edifices.
Navigate implementation thus:
- Establish Benchmarks: Frame slides around core criteria, weighting sustainability (25%) alongside functionality (50%).
- Assimilate Inputs: Import from project trackers, scaling axes to contextualize variances - like sq m efficiencies across variants.
- Synthesize Scenarios: Employ waterfall charts to decompose budget cascades, pinpointing efficiencies in subcontractor bids.
- Gather Inputs Dynamically: Circulate for annotations, merging via version history to refine collective wisdom.
- Summarize Strategically: Cap with executive dashboards, animating key takeaways for memorable closes.
Researchers at MIT's architecture lab apply it for parametric studies, graphing algorithmic outputs to validate generative designs empirically.
Edge Over Conventional Charting
Eschew vanilla visuals that blur under scrutiny; this template's templated precision - aligned per ASCE standards - slashes revision cycles by 50%, as per engineering workflow benchmarks. It introduces foresight features like trendline forecasts, absent in stock options, for proactive pitch fortifications.
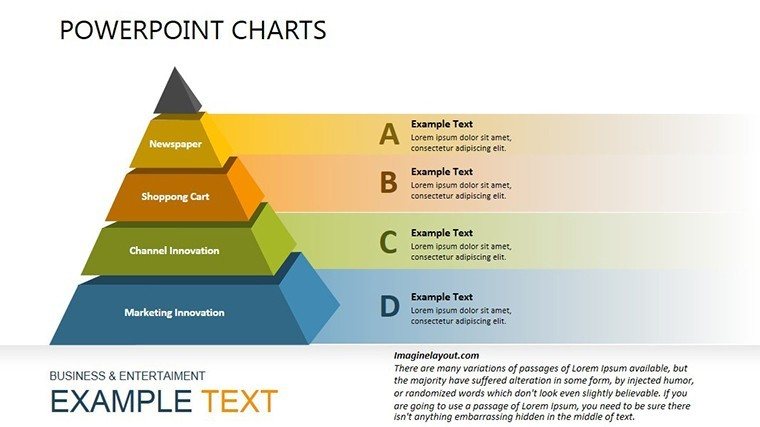
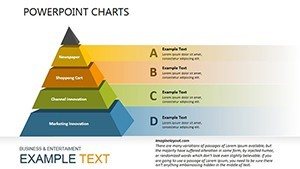
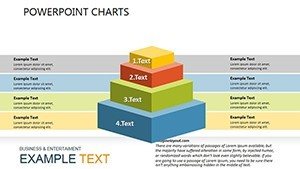
Fortify your evaluations - secure the Criteria and Metrics PowerPoint Charts template today. Explore pyramid visuals for hierarchical insights.
Refinement Rituals: Tips from the Trenches
Enhance with narrative threads - link metrics to project ethos, e.g., "Carbon Footprint: Lighter Than Air." Humorously note: "Budgets: The Only Thing That Shouldn't Expand." Optimize for hybrid formats, segmenting slides for virtual vs. in-person scrutiny.
Chart your course to excellence - download instantly and metric your way to milestones.
Frequently Asked Questions
Which metrics are pre-configured?
Slides cover timelines, costs, quality scores, and compliance rates, adaptable for custom sets like seismic resilience indices.
Supports collaboration?
Yes, via Google Slides integration for real-time co-edits during cross-disciplinary reviews.
Editable to what extent?
Everything - from data points to stylistic elements - offering full reinvention without template breakage.
Includes high-res exports?
Affirmative, with 300 DPI PNG/PDF options for archival or publication needs.
Compatible with older PowerPoint?
From 2010 onward, with fallback modes for legacy compatibility in mixed-team environments.
Slide count and expansion?
13 core slides, readily duplicable for appendices on ancillary criteria like accessibility audits.