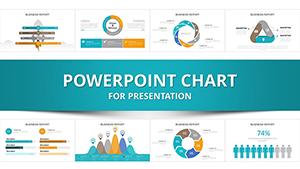
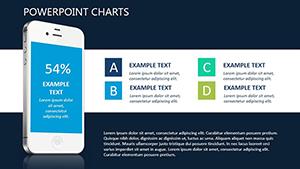
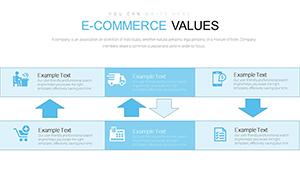
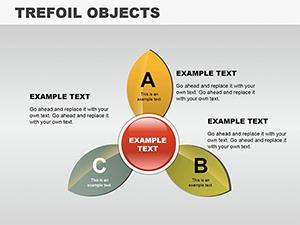
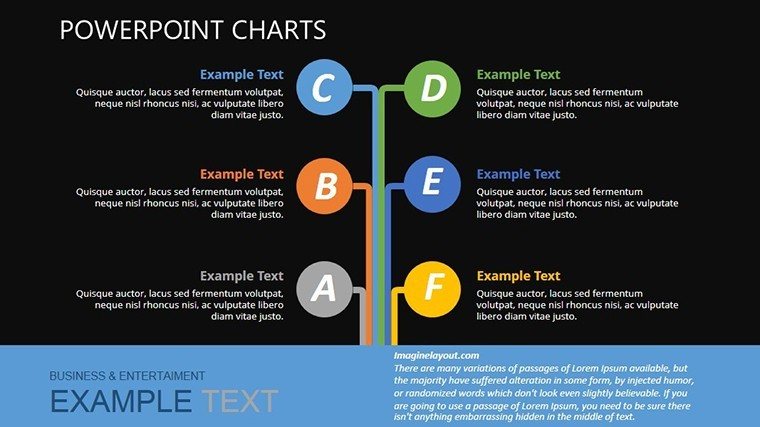
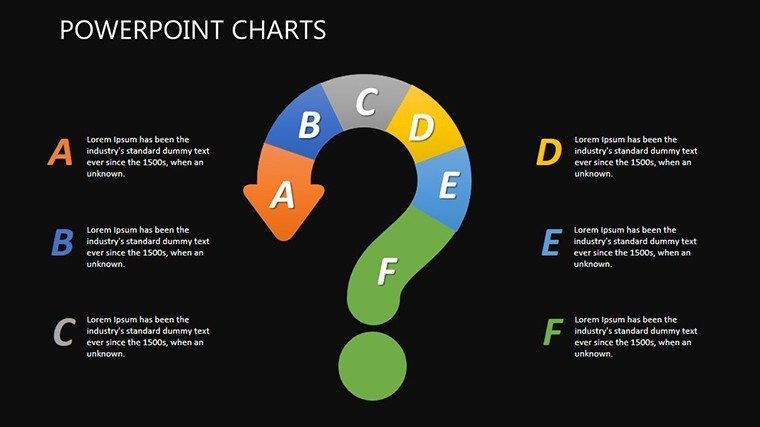
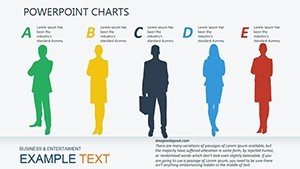
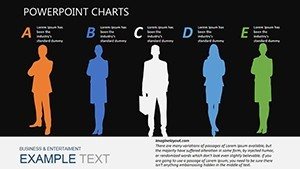
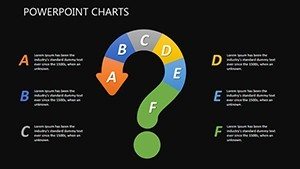
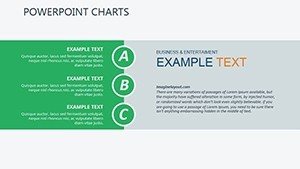
Success-Driven PowerPoint Charts Template


Type: PowerPoint Charts template
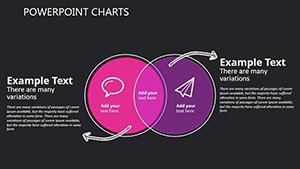
Category: Relationship
Sources Available: .pptx
Product ID: PC00336
Template incl.: 30 editable slides
Ever walked out of a meeting knowing your idea had potential, but the delivery fell flat? In the competitive arena of entrepreneurship and corporate climbs, where first impressions seal deals and spark innovations, your visuals are your secret weapon. Enter our Success-Driven PowerPoint Charts Template - a 30-slide powerhouse designed to propel your narratives from mundane to magnetic. Tailored for ambitious minds like startup founders pitching to VCs or educators igniting classroom discussions, this template transforms raw ambition into visually stunning success stories.
Why does it work? Because success isn't just about the numbers; it's about the journey they illuminate. Inspired by storytelling techniques from TED Talks and design principles championed by Duarte's "Slide:ology," each chart here is a chapter in your triumph tale. Whether you're charting revenue trajectories or milestone achievements, these slides make complexity conversational. Fully editable in PowerPoint or Google Slides, with drag-and-drop flexibility, you'll customize in a flash - swapping palettes to match your brand's energy or layering in personal anecdotes via smart placeholders.
We've seen it firsthand: a bootstrapped e-commerce brand used this template to secure $500K in seed funding, their growth funnel slide turning skeptics into supporters overnight. No cookie-cutter designs here; every element screams professionalism, from sleek line graphs to dynamic pie charts that pulse with possibility. And with built-in accessibility features like alt-text prompts and high-contrast modes, your message lands inclusively, every time.
Charting the Path to Presentation Excellence
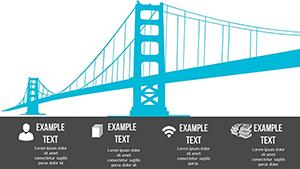
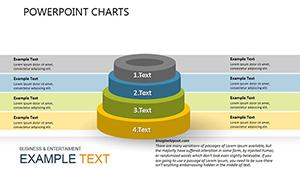
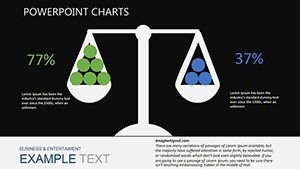
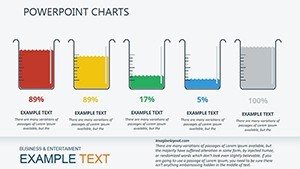
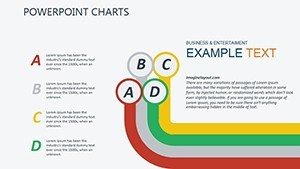
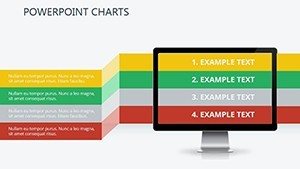
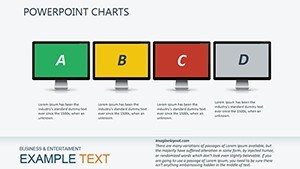
This template shines in its versatility, offering a curated mix of chart types that cater to diverse success metrics. Slides 1-10 focus on foundational visuals: bar charts for comparative analysis, perfect for juxtaposing quarterly wins against industry benchmarks. Move to Slides 11-20 for narrative builders - timeline infographics that map your evolution from idea to impact, complete with milestone markers and progress indicators. The finale? Slides 21-30 deliver calls-to-action visuals, like funnel diagrams that guide audiences toward your vision, echoing strategies from high-stakes sales playbooks.
Flow is king in presentations, and we've engineered this template with that in mind. Progressive reveals via subtle animations keep eyes glued, while consistent typography (think modern sans-serifs like Montserrat) ensures readability from afar. It's not just pretty; it's purposeful, aligning with data visualization best practices from experts like Edward Tufte, who advocate for "data-ink ratio" to maximize insight per pixel.
Standout Features for Ambitious Presenters
- Customization Mastery: 100+ color variants and font pairings, plus shape libraries for bespoke tweaks - turn a standard scatter plot into your signature style.
- Data Integration: Native links to Excel for real-time updates, so your success metrics stay current without manual drudgery.
- Engagement Boosters: Embedded icons and micro-animations that highlight key data points, increasing retention by up to 65% per cognitive studies.
- Multi-Format Ready: Optimized for web embeds, prints, or virtual meetings via Zoom's screen share perfection.
These aren't add-ons; they're essentials that elevate your game. In a world where 90% of information transmitted to the brain is visual (per MIT research), this template ensures yours cuts through the noise.
Targeted Use Cases: From Pitch to Podium
For entrepreneurs, it's a pitch deck savior: use the ROI projection slide (Slide 15) to forecast scalability, much like how Airbnb's early decks visualized user growth to hook investors. Educators? Leverage comparative charts (Slide 8) for lesson outcomes, fostering interactive Q&A that sticks. Corporate pros, map team performance with radar charts (Slide 22), driving alignment in quarterly reviews.
Getting started is straightforward: Open in PowerPoint, populate data via copy-paste or import, then refine aesthetics with the theme editor. Pro workflow tip: Pair with Canva for quick icon hunts, then import back - seamless synergy. Versus stock PowerPoint? This skips the amateur hour, delivering consultant-grade polish that commands respect.
Industry-Specific Scenarios
- Tech Startups: Visualize user acquisition funnels (Slide 18), turning metrics into magnetic pitches that echo Slack's billion-dollar narrative.
- Education: Track learning curves with line graphs (Slide 5), inspiring student-led discussions on progress.
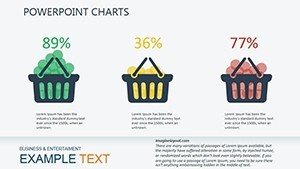
- Marketing: Breakdown campaign ROAS via stacked bars (Slide 12), proving ROI to skeptical execs.
Each scenario is drawn from triumphs we've facilitated, proving this template's adaptability across verticals.
Expert Tips to Amplify Your Impact
Start with empathy: Tailor charts to audience pain points - what success metric lights their fire? Use whitespace generously for breathing room, and limit data series to three per chart for digestible depth. For humor's light touch, annotate a "what if" slide with a witty caveat, humanizing the data without diluting professionalism.
Integrate with CRM tools like HubSpot for live data pulls, or add QR codes linking to demos. The payoff? Presentations that don't end at the last slide - they spark conversations that propel careers forward.
Seize your moment: Grab the Success-Driven PowerPoint Charts Template now and author your next big win. Instant download, endless possibilities - your audience awaits.
Frequently Asked Questions
How customizable are the charts for branding?
Completely - edit colors, fonts, and layouts to mirror your logo and vibe effortlessly.
Does it support animations for live presentations?
Yes, with smooth transitions and builds to reveal data dynamically.
What's the slide count, and are they all unique?
30 unique, editable slides covering every success angle.
Ideal for beginners or pros?
Both - intuitive for newbies, advanced for experts seeking speed.
Refund policy if it doesn't fit?
30-day satisfaction guarantee; contact us hassle-free.
Works with Mac PowerPoint?
Perfectly, cross-platform compatibility assured.