Customer Needs PowerPoint Charts Template: Unlock Consumer Insights


Type: PowerPoint Charts template
Category: Analysis
Sources Available: .pptx
Product ID: PC00315
Template incl.: 22 editable slides
Understanding what drives your customers - from pain points to aspirations - is the cornerstone of successful business strategies. In a market saturated with data, our Customer Needs PowerPoint Charts Template emerges as a vital asset, packing 22 editable slides to dissect and display consumer behaviors vividly. Designed for those in market research or product teams, it turns surveys and feedback into actionable visuals, helping you align offerings with real demands. Imagine presenting a scatter plot of satisfaction metrics that reveals untapped opportunities, all while engaging stakeholders with professional polish.
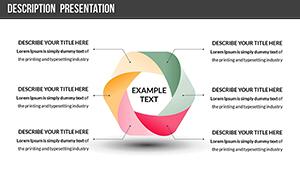
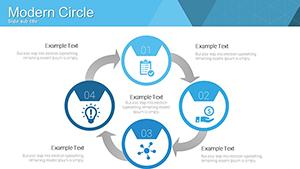
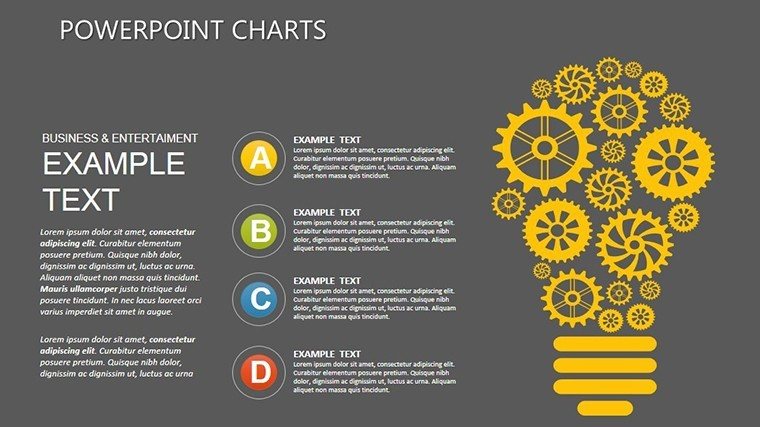
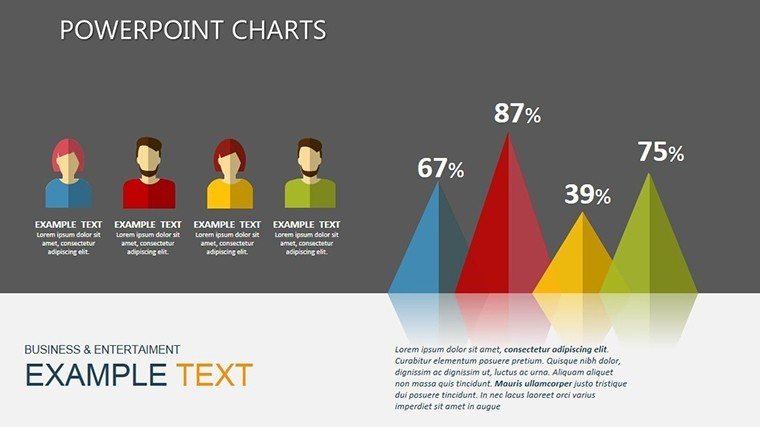
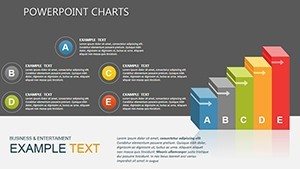
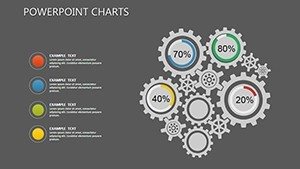
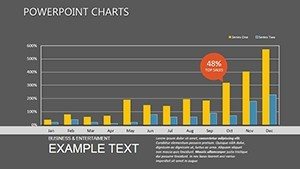
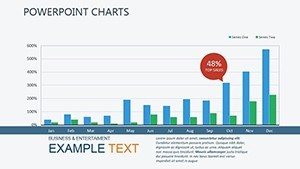
Focusing on analysis charts, it includes bar graphs for preference comparisons and pie charts for demographic breakdowns, fully compatible with PowerPoint and Google Slides. Inspired by frameworks like Jobs to Be Done theory, it provides a structured way to map needs, enhancing decision-making with evidence-based designs.
Core Features for Data-Driven Narratives
Customization is key, with options to refine visuals for specific industries, ensuring relevance and impact in every slide.
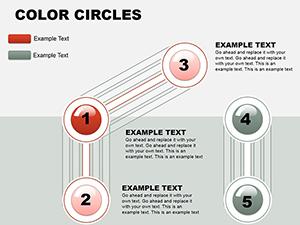
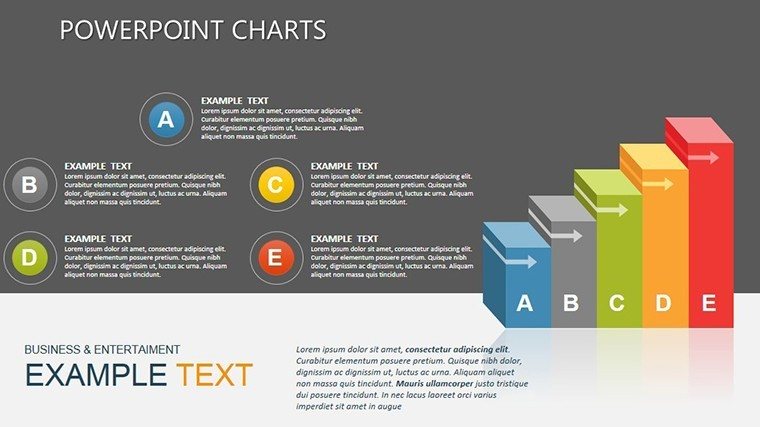
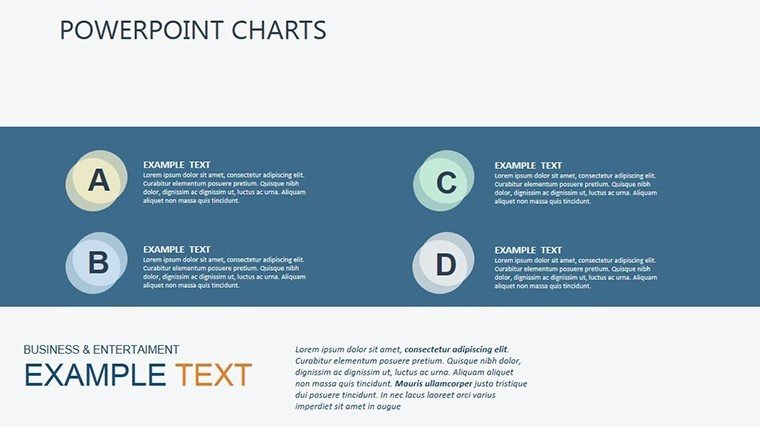
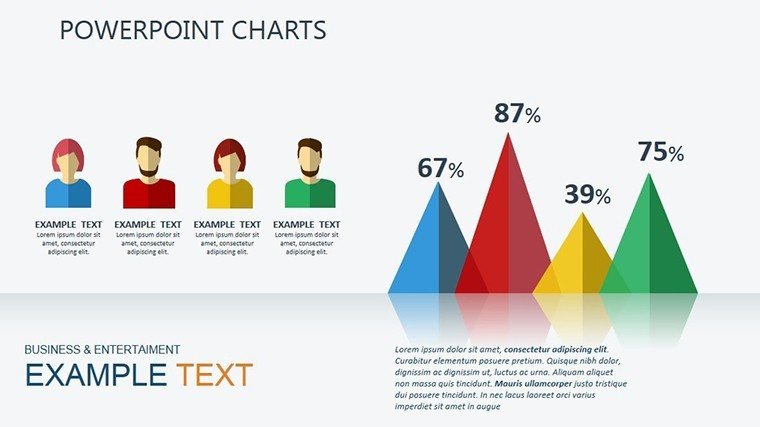
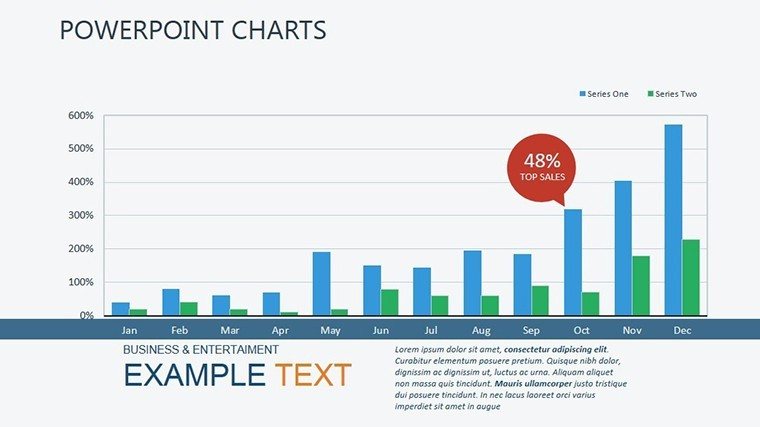
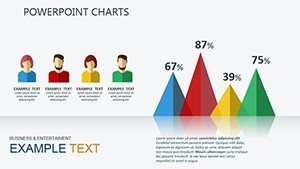
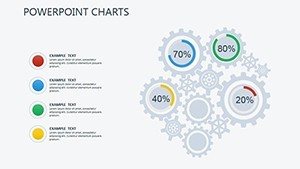
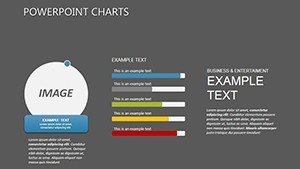
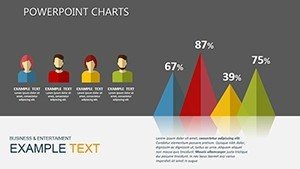
- Bar and Pie Charts for Segmentation: Break down needs by age, location, or behavior, drawing from Nielsen-inspired categorizations.
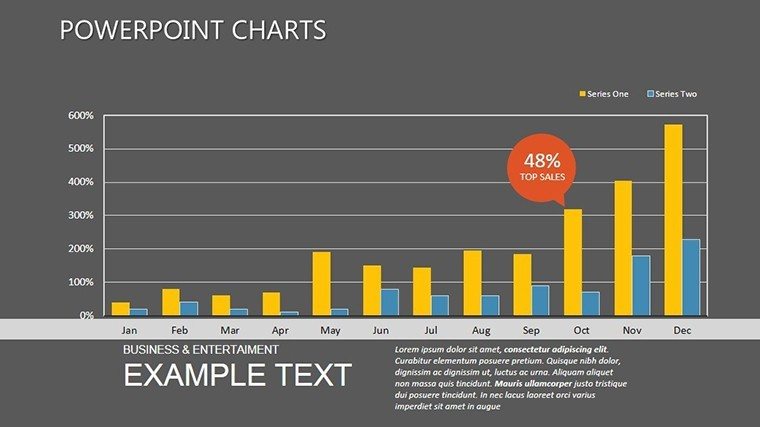
- Scatter Plots for Correlations: Link feedback to loyalty scores, highlighting trends like those in Forrester reports.
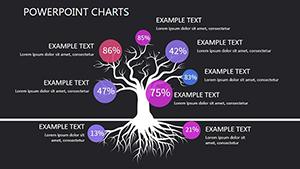
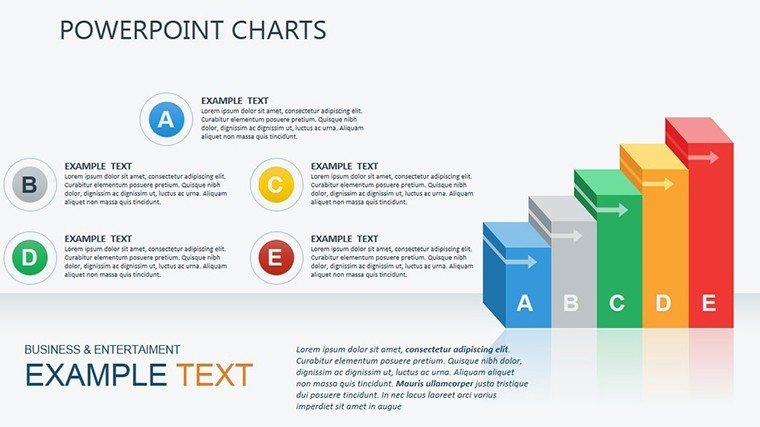
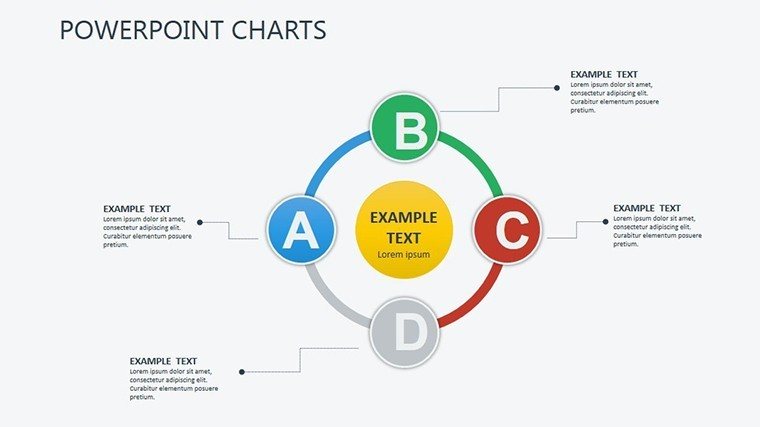
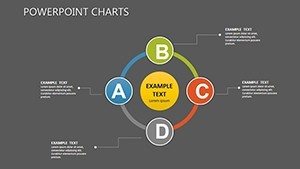
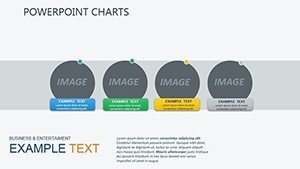
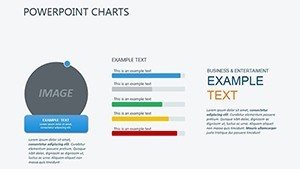
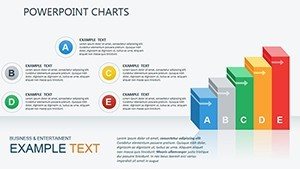
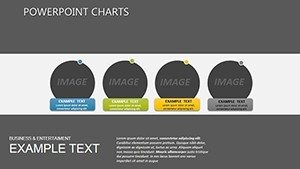
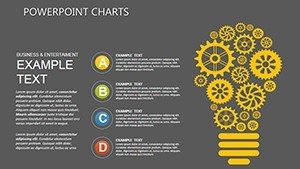
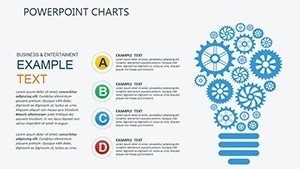
- Infographic Elements: Icons for needs categories, adding visual appeal without clutter.
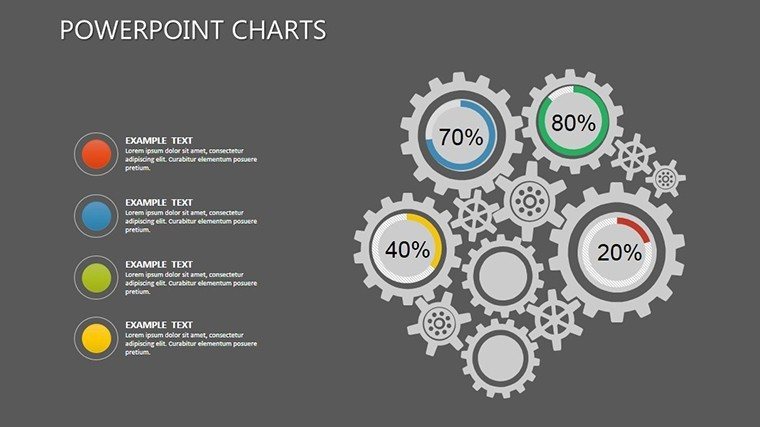
- Color Schemes for Emphasis: Subtle gradients to denote urgency or satisfaction levels, customizable to brand guidelines.
Grounded in data visualization best practices from experts like Stephen Few, these ensure clarity, avoiding common pitfalls like misleading scales.
Targeted Use Cases for Business Growth
A product developer might use pie charts to visualize feature requests from user surveys, prioritizing developments that address core needs, similar to Agile methodologies in tech giants like Amazon.
In sales, craft pitches with bar graphs showing how your solution meets market gaps, backed by case studies from Harvard Business Review. For research teams, scatter plots can track sentiment over time, informing pivots in strategy.
- Gather Insights: Compile data from tools like Qualtrics or Google Forms for authenticity.
- Select Visuals: Choose charts that best represent your findings, editing for precision.
- Add Context: Include annotations or callouts for deeper explanations.
- Review and Share: Test for clarity, then present to drive informed actions.
This surpasses free alternatives by offering analytical depth, streamlining workflows for faster insights in competitive environments.
Strategic Tips for Maximum Value
Blend in storytelling: Frame charts around customer journeys, perhaps with a touch of empathy humor like 'What customers say vs. what they mean.' Cite reliable sources such as Gartner to lend weight, positioning your work as authoritative.
Sync with CRM systems like Salesforce for real-time data feeds, or use Tableau exports for advanced integrations, fostering a culture of customer-centricity.
Empowering Teams with Reliable Tools
With roots in consumer psychology standards, this template builds trust through accurate, adaptable visuals. Professionals note improved alignment in teams, with visuals clarifying complex needs effectively.
Propel your customer focus forward. Acquire this Customer Needs PowerPoint Charts Template now and craft presentations that resonate and convert.
Frequently Asked Questions
- How editable are the customer analysis charts?
- Completely - modify data, colors, and layouts to fit your specific insights seamlessly.
- Is this template good for sales teams?
- Yes, it excels in visualizing needs for persuasive pitches and market overviews.
- What data sources integrate well?
- Surveys, CRM exports, or analytics from tools like Google Analytics work effortlessly.
- Can it handle large datasets?
- Absolutely, with scalable graphs designed for clarity even with extensive information.
- Does it include design tips?
- Built-in best practices guide you, but customization allows for personal flair.
- Compatible with older PowerPoint versions?
- Yes, works with recent versions and Google Slides for broad accessibility.