Fishbone SWOT PowerPoint Charts Templates


Type: PowerPoint Charts template
Category: Business Models, Flow
Sources Available: .pptx
Product ID: PC00273
Template incl.: 18 editable slides
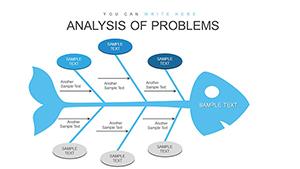
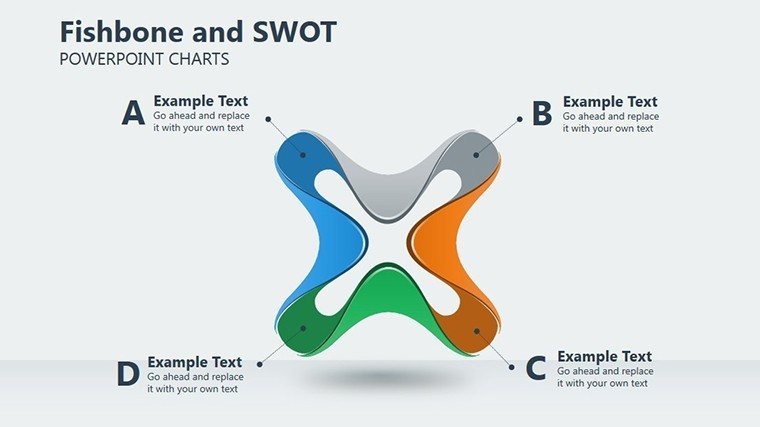
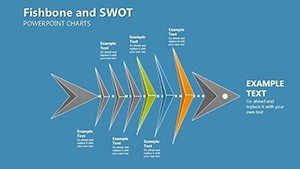
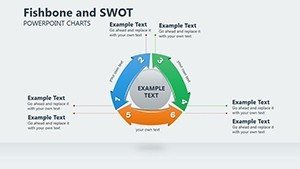
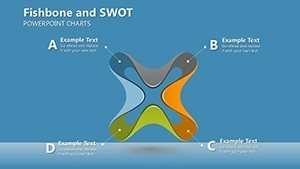
In the fast-paced world of business, identifying the root causes of challenges and leveraging strengths for growth isn't just an option - it's essential. Imagine having a toolkit that transforms complex problem-solving into a clear, visual journey. Our Fishbone SWOT PowerPoint Charts Template does exactly that, offering 18 fully editable slides designed to dissect issues, categorize factors, and illuminate paths to success. Tailored for managers, consultants, and teams tackling operational hurdles, this template bridges the gap between raw data and actionable insights. Whether you're preparing for a strategy session or a performance review, these charts help you sort reasons, assess impacts, and reveal interconnections that might otherwise stay hidden.
Unlocking the Power of Visual Problem-Solving
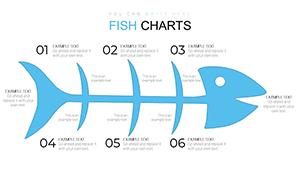
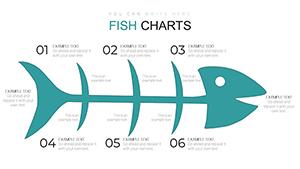
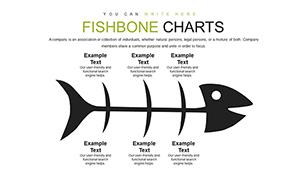
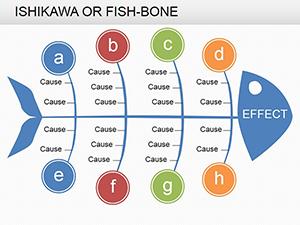
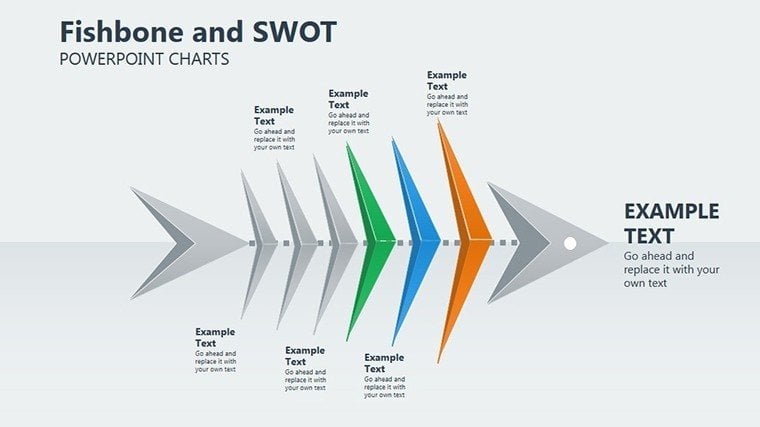
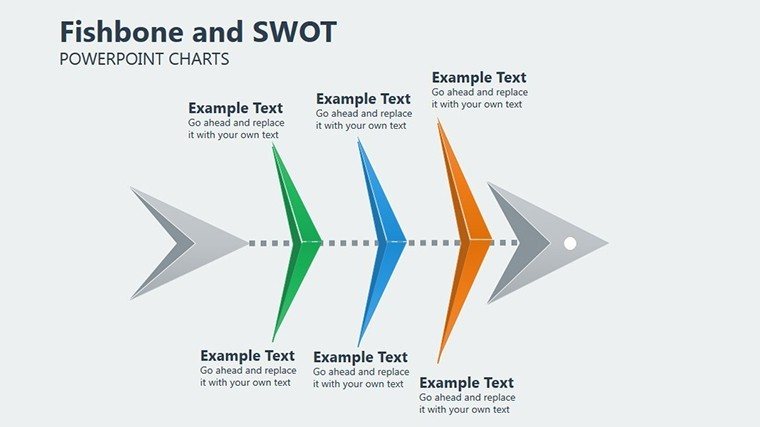
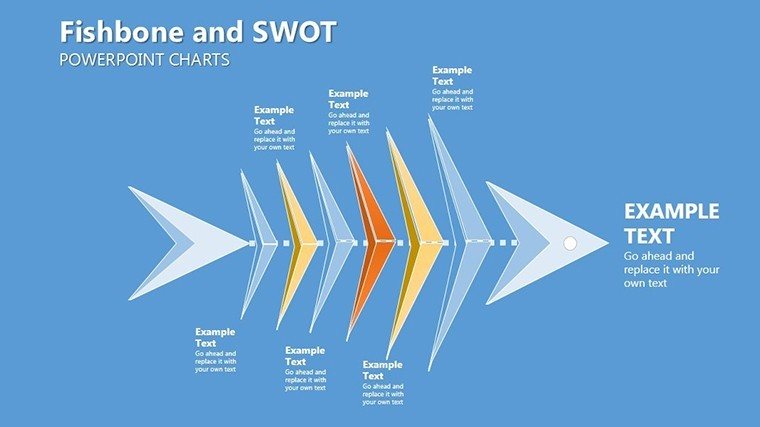
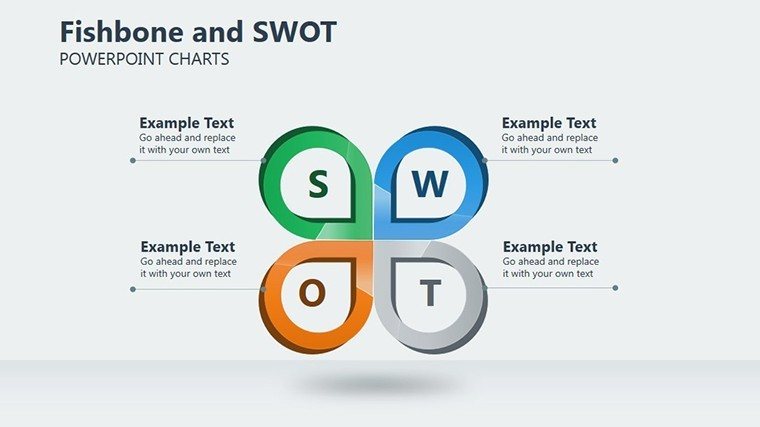
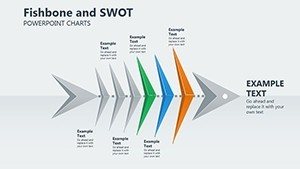
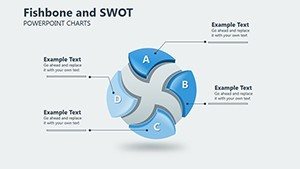
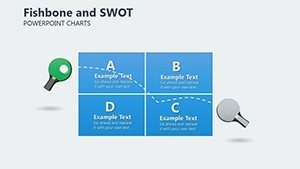
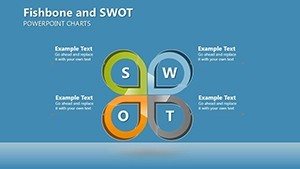
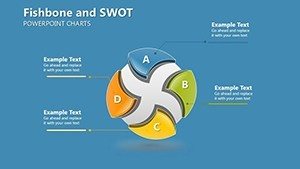
Dive deeper into how this template revolutionizes your approach. The fishbone diagram, also known as the Ishikawa diagram, structures causes into categories like people, processes, materials, and environment, making it ideal for manufacturing or service industries. Combined with SWOT analysis - strengths, weaknesses, opportunities, threats - it provides a holistic view. For instance, in a retail business facing declining sales, use the fishbone to pinpoint inventory issues or staff training gaps, then overlay SWOT to evaluate competitive threats and internal strengths like brand loyalty.
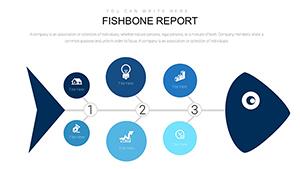
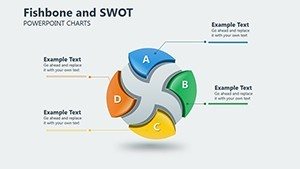
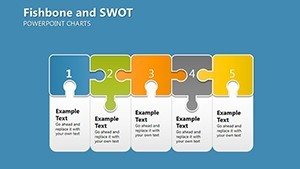
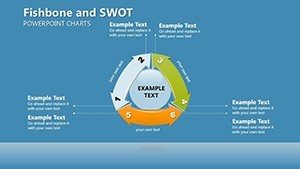
Each slide is crafted with precision, featuring clean lines, intuitive layouts, and color-coded elements that enhance readability. Compatibility with PowerPoint ensures seamless integration into your existing workflows, while the .pptx format allows easy sharing across teams. Professionals in quality control, such as those adhering to Six Sigma methodologies, will appreciate how these charts facilitate cause-and-effect discussions, leading to data-driven decisions that boost efficiency.
Key Features That Set This Template Apart
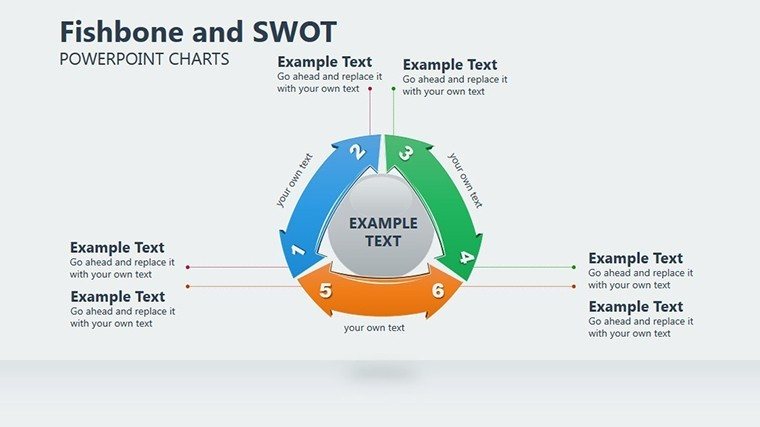
- Editable Elements: Every shape, text, and color is customizable, letting you align with your corporate branding or emphasize specific data points.
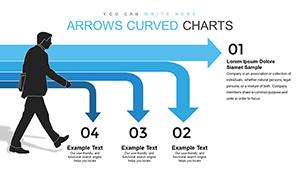
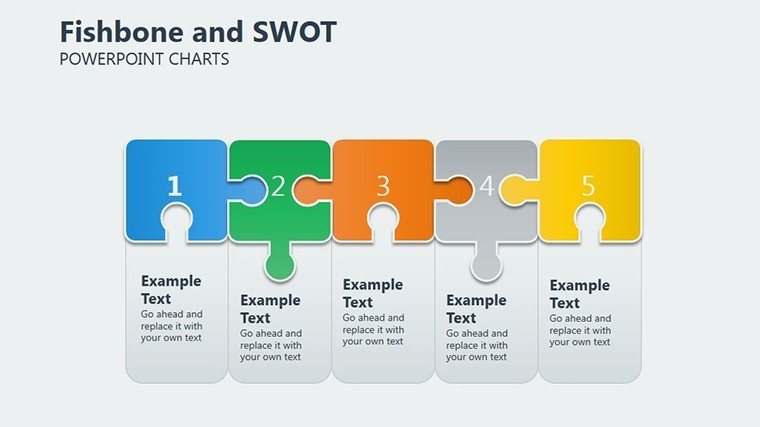
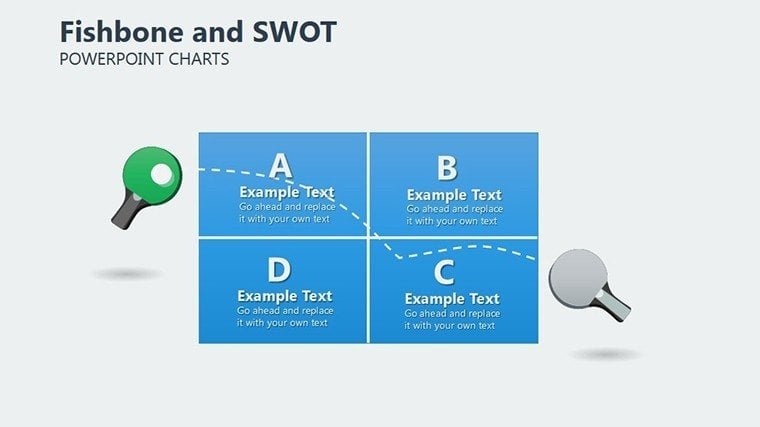
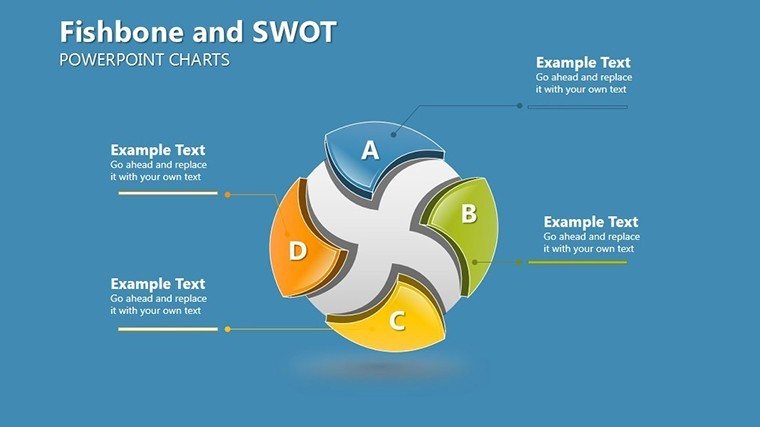
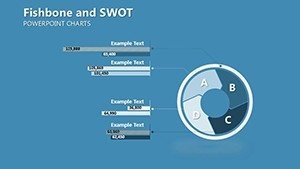
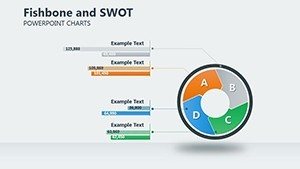
- Varied Layouts: From basic fishbone structures to integrated SWOT matrices, choose slides that fit your narrative flow.
- High-Resolution Graphics: Ensure crisp visuals even when projected in large conference rooms.
- Time-Saving Design: Pre-built frameworks mean you spend less time building from scratch and more on analysis.
Beyond features, consider the real-world applications. In healthcare, a hospital team might use these charts to analyze patient wait times, categorizing causes under manpower or machinery, then applying SWOT to identify opportunities like tech upgrades. This not only solves immediate problems but fosters a culture of continuous improvement, aligning with standards like those from the Joint Commission.
Real-World Applications and Case Studies
Let's explore targeted use cases. For project managers in IT, the template shines in post-mortem reviews. Map out bugs or delays using the fishbone, then use SWOT to strategize future sprints - perhaps highlighting strengths in agile methodologies while addressing weaknesses in vendor dependencies. A case study from a tech firm like those featured in Harvard Business Review shows how such visualizations reduced project overruns by 25% through better cause identification.
In marketing, visualize campaign failures: Why did that ad underperform? Fishbone could reveal content mismatches or timing issues, with SWOT revealing opportunities in emerging social platforms. Educators training future leaders can incorporate these into curricula, teaching students to think critically about business dynamics.
Comparisons to basic PowerPoint tools highlight the value: While standard shapes work for simple diagrams, this template offers themed icons, animation suggestions, and layered complexity that elevates presentations from mundane to memorable. Integrate it into your workflow by starting with data collection, then populating slides, and finally rehearsing for impact.
Step-by-Step Guide to Maximizing Your Template
- Gather your data: List potential causes and SWOT elements from team brainstorming.
- Select a slide: Choose a fishbone for cause analysis or a combined chart for overview.
- Customize: Adjust colors to match your brand - perhaps blue for strengths, red for threats.
- Add details: Insert text, icons, or even hyperlinks to supporting documents.
- Present and iterate: Share in meetings, gather feedback, and refine for future use.
Tips for success include using contrasting colors for clarity and keeping text concise to avoid clutter. For advanced users, layer animations to reveal causes sequentially, building suspense and engagement.
As an SEO expert with years optimizing content for design resources, I've seen how templates like this not only save time but also enhance professional credibility. Drawing from authoritative sources like the American Society for Quality, these charts embody best practices in root cause analysis.
Elevate Your Strategy Sessions Today
Don't let unresolved issues hinder your progress. With this Fishbone SWOT template, turn obstacles into opportunities. Customize now and experience the difference in your next presentation. Ready to dive in? Download today and start visualizing success.
Frequently Asked Questions
How customizable are the fishbone diagrams?
The diagrams are fully editable, allowing changes to shapes, colors, text, and layout to fit your specific needs.
Is this template compatible with Google Slides?
While designed for PowerPoint, you can upload the .pptx file to Google Slides for use, though some features may vary.
What industries benefit most from this template?
Manufacturing, healthcare, IT, and marketing teams find it invaluable for problem-solving and strategic planning.
Can I add my own data to the charts?
Absolutely - insert your metrics directly into the editable fields for personalized analysis.
Are there animation options included?
Yes, suggestions for custom animations are provided to enhance presentation flow.