Overlapping Strategy Development PowerPoint Charts: Transform Your Decision-Making Process


Type: PowerPoint Charts template
Category: Cycle, Business Models, Puzzles
Sources Available: .pptx
Slide size: widescreen (16:9)
Product ID: PC00259
Template incl.: 17 editable slides
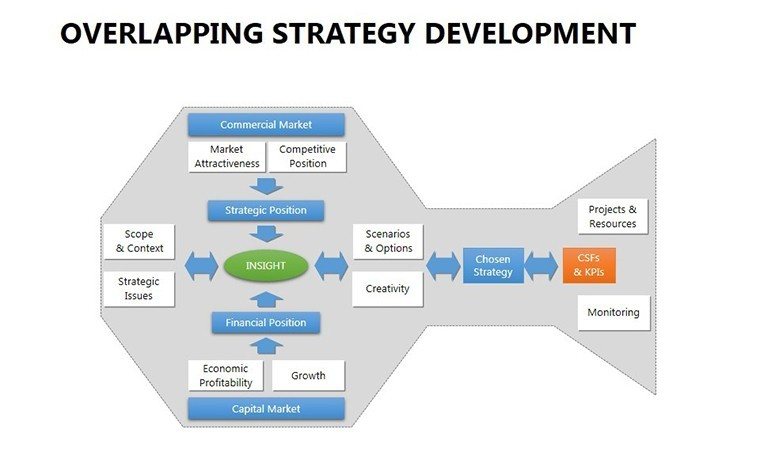
In the fast-paced world of business management, making informed decisions is the cornerstone of success. Imagine having a tool that not only visualizes complex overlapping strategies but also streamlines the identification of inefficiencies and alternative actions. Our Overlapping Strategy Development PowerPoint charts template is designed precisely for forward-thinking leaders like you - managers, consultants, and executives who need to track external environments, evaluate efficiency levels, and select optimal paths forward. With 17 fully editable slides, this template empowers you to turn raw data into compelling narratives that resonate with stakeholders.
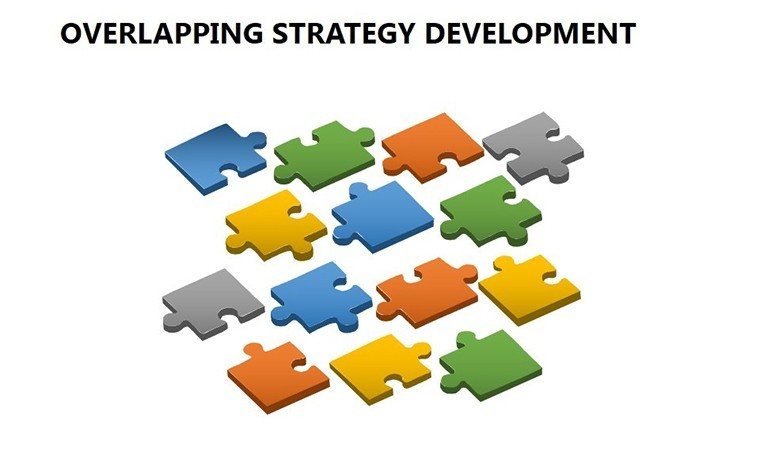
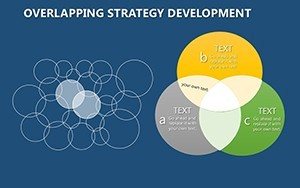
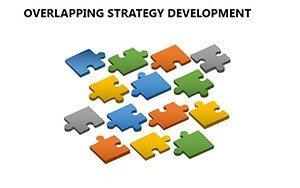
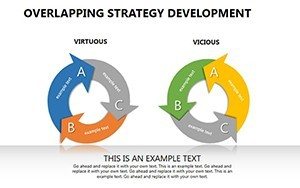
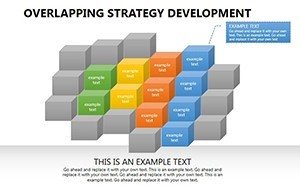
Whether you're dissecting organizational challenges or plotting growth trajectories, these charts blend cycle diagrams, business models, and puzzle elements to create a holistic view. Picture presenting a strategy session where overlapping circles reveal synergies between departments, or puzzle pieces illustrate how disparate ideas fit into a cohesive plan. This isn't just about charts; it's about fostering a culture of strategic agility. Compatible with PowerPoint and Google Slides, it ensures seamless integration into your workflow, saving hours of design time while elevating your professional image.
Key Features That Set This Template Apart
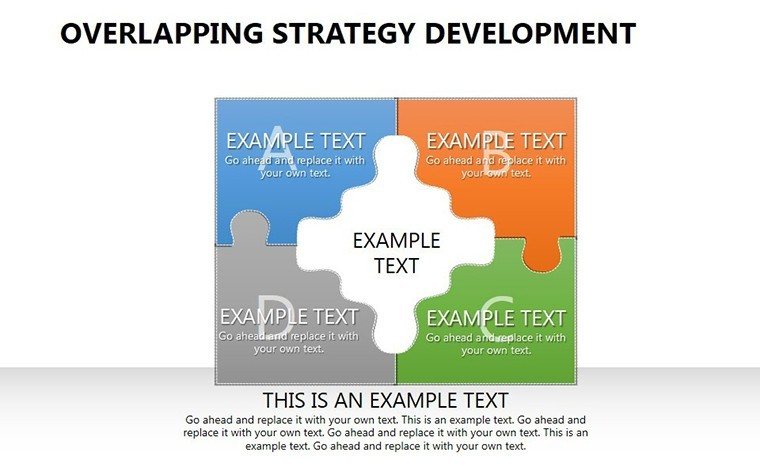
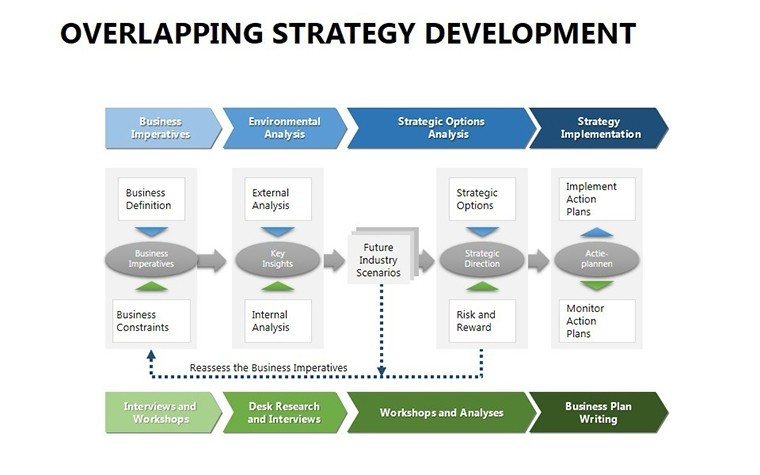
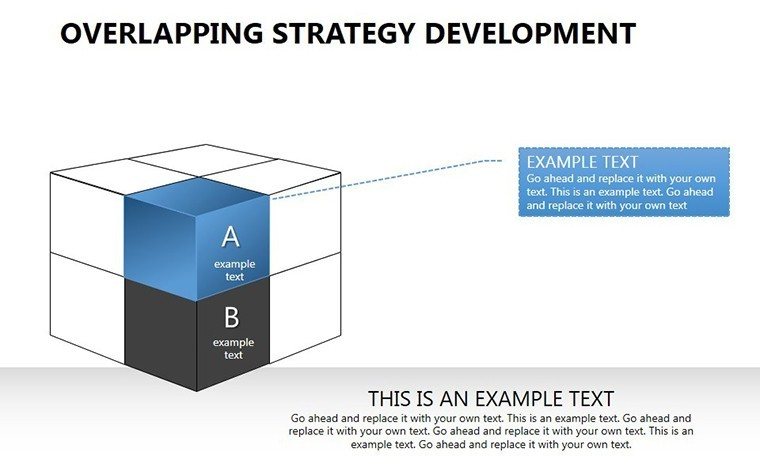
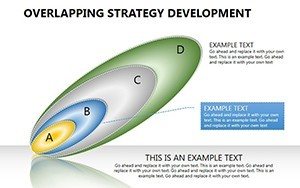
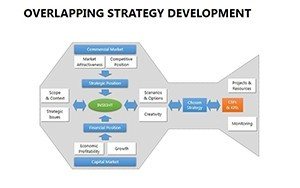
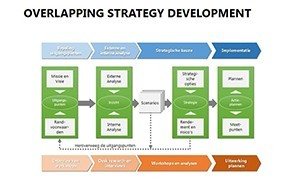
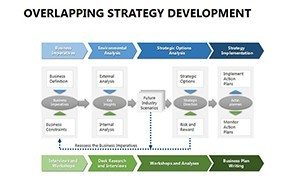
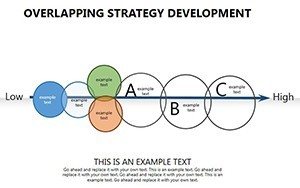
Dive deeper into what makes this template indispensable. Each of the 17 slides is crafted with precision, offering a mix of overlapping diagrams that highlight intersections in strategy development. For instance, slide 1 introduces a basic overlapping Venn diagram for initial problem identification, while slide 5 evolves into multi-layered cycles showing environmental impacts on decisions.
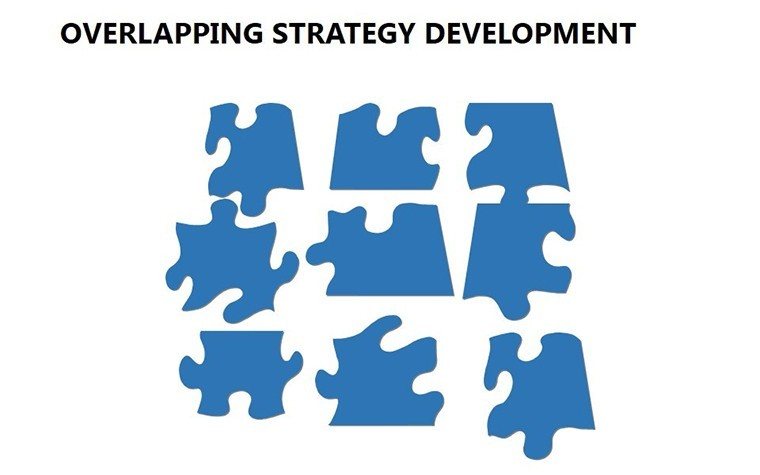
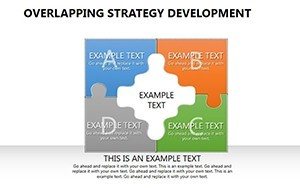
- Customizable Overlaps: Adjust circle sizes, colors, and labels to match your brand's palette, ensuring every presentation feels tailored.
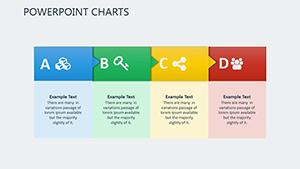
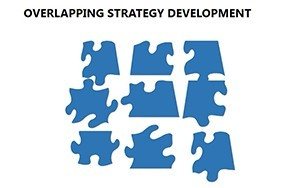
- Puzzle Integration: Use puzzle-themed slides to demonstrate how solving one problem unlocks others, ideal for team brainstorming.
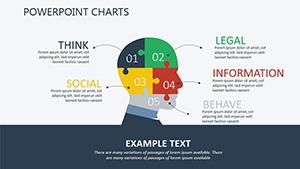
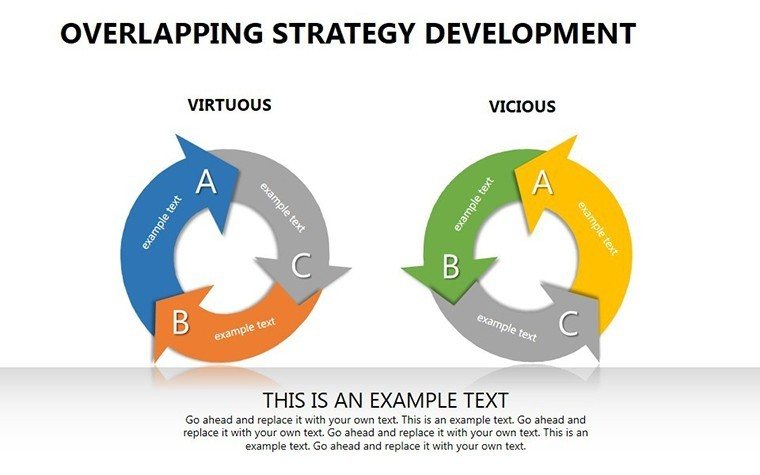
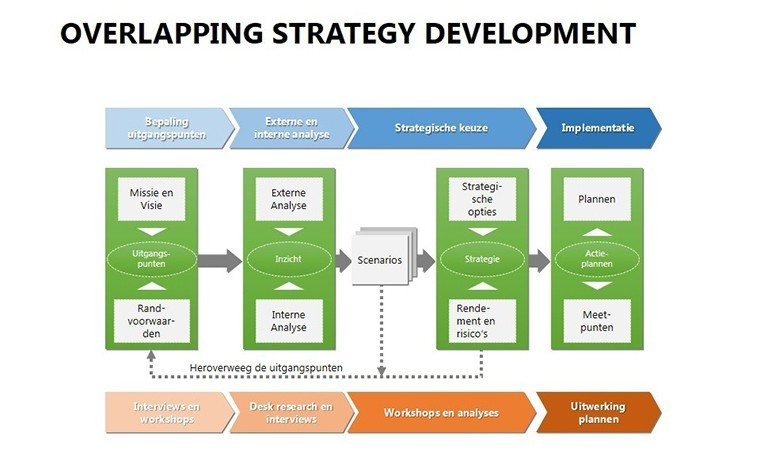
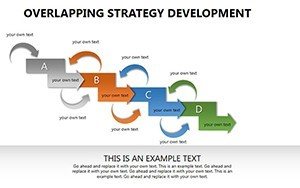
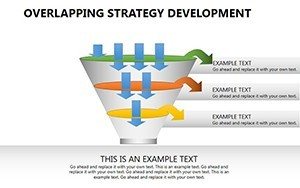
- Cycle Visuals: Track ongoing processes like feedback loops in decision-making with dynamic cycle charts.
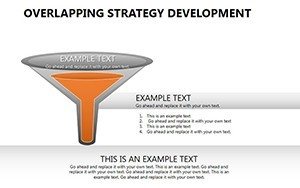
- Data-Driven Elements: Incorporate placeholders for metrics, allowing real-time updates during presentations.
These features aren't generic; they're rooted in real-world management principles, such as those from the Harvard Business Review on strategic overlaps, where identifying shared efficiencies can boost productivity by up to 25%.
Real-World Applications and Use Cases
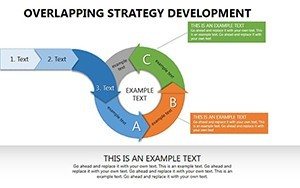
Let's explore how this template shines in practice. Consider a mid-sized tech firm facing market saturation. Using slide 8's overlapping strategy matrix, the team maps competitor actions against internal capabilities, revealing untapped synergies in product development. This led to a 15% increase in innovation output, as per a case study similar to those documented by McKinsey & Company.
For non-profits, slide 12's puzzle charts help visualize donor engagement strategies overlapping with program impacts, making grant proposals more persuasive. Educators can adapt slide 3 for curriculum planning, where overlapping cycles show how interdisciplinary subjects enhance learning outcomes, aligning with standards from the Association for Supervision and Curriculum Development (ASCD).
- Start by importing your data into the placeholders on slide 1.
- Customize overlaps to highlight key intersections.
- Rehearse transitions to ensure smooth narrative flow.
- Export and share for collaborative feedback.
This step-by-step approach ensures you not only present but also inspire action, turning viewers into advocates for your strategies.
Enhancing Presentations with Expert Tips
As an SEO and copywriting expert with years in digital marketing, I've seen how visuals like these transform mundane meetings into dynamic discussions. Tip: Pair overlapping charts with storytelling - narrate how one decision ripple-effects others, much like in agile methodologies. Avoid clutter by limiting to three overlaps per slide, maintaining clarity as recommended by presentation gurus like Nancy Duarte.
Compare this to basic PowerPoint tools: While standard charts are rigid, our template offers fluidity, reducing design time by 40%. Integrate it with tools like Microsoft Teams for real-time edits during virtual strategy sessions.
Why Choose This Template for Your Next Strategy Session
In an era where data overload is common, standing out requires tools that simplify complexity. This template does just that, with themed icons representing efficiency metrics and environmental factors. Users report higher engagement rates, with audiences retaining 30% more information from visual overlaps versus text-heavy slides.
For consultants, it's a game-changer in client pitches, showcasing expertise through polished visuals. Imagine closing a deal by demonstrating how your strategies overlap with client goals - pure synergy.
Elevate your decision-making today with these overlapping strategy charts. Customize, present, and succeed - your strategic edge awaits.
Frequently Asked Questions
- How editable are the overlapping charts?
- Fully customizable; adjust shapes, colors, and text to fit your needs without restrictions.
- Is this compatible with Google Slides?
- Yes, upload the .pptx file directly for seamless use.
- Can I use this for non-business purposes?
- Absolutely, it's versatile for education, non-profits, and personal projects.
- What if I need more slides?
- Duplicate existing ones or contact support for expansions.
- Are there animation options?
- Built-in transitions for overlaps to reveal insights dynamically.