Business Table PowerPoint Charts Template: Data That Delivers


Type: PowerPoint Charts template
Category: Tables
Sources Available: .pptx
Product ID: PC00196
Template incl.: 25 editable slides
Ever stared at a spreadsheet sea, wondering how to make it sing in a boardroom? Enter the Business Table PowerPoint Charts Template: 25 editable slides that convert raw numbers into narrative gold, perfect for executives, analysts, and sales teams craving impact without the hassle. At $20, this isn't mere formatting - it's a strategic weapon for dissecting budgets, forecasting trends, or benchmarking rivals, all wrapped in professional tables that pop.
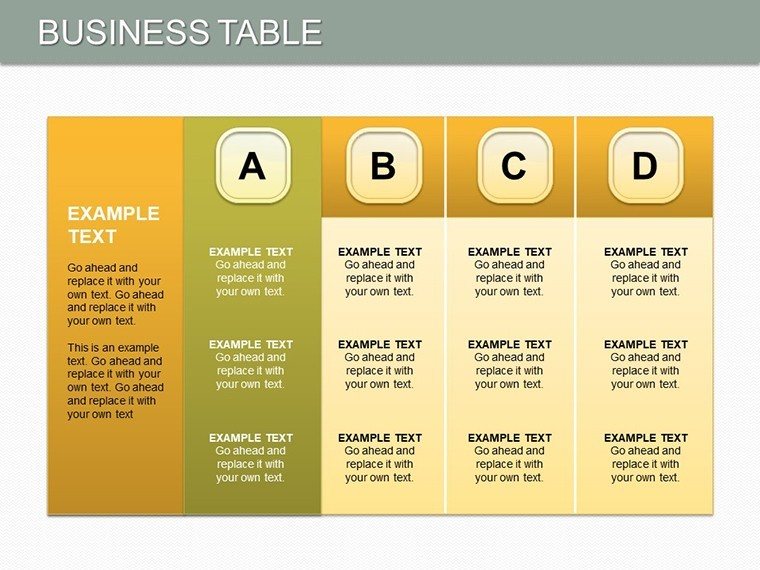
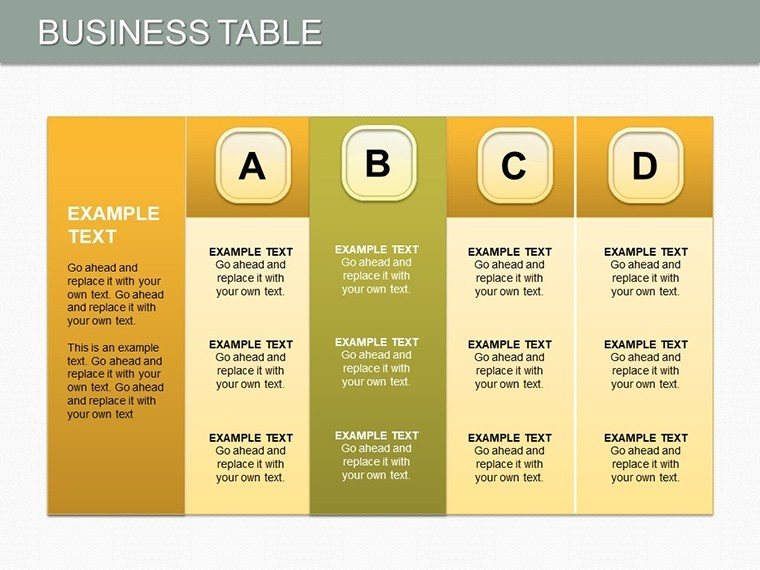
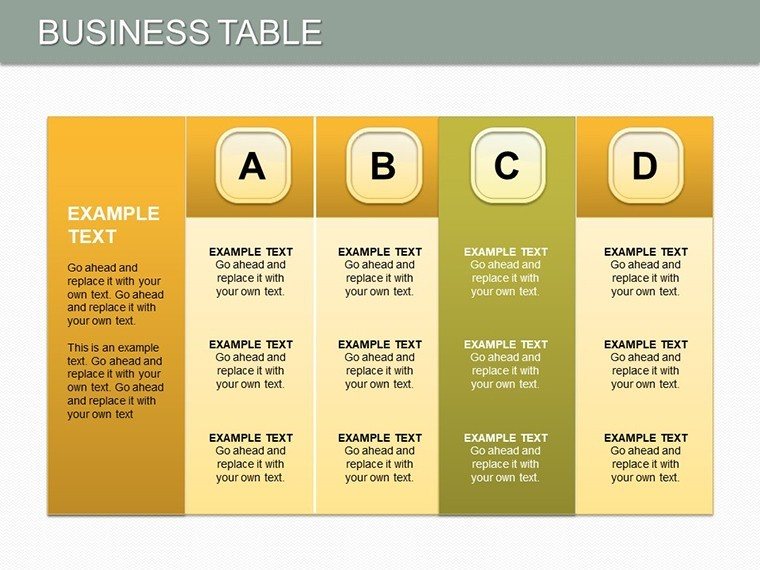
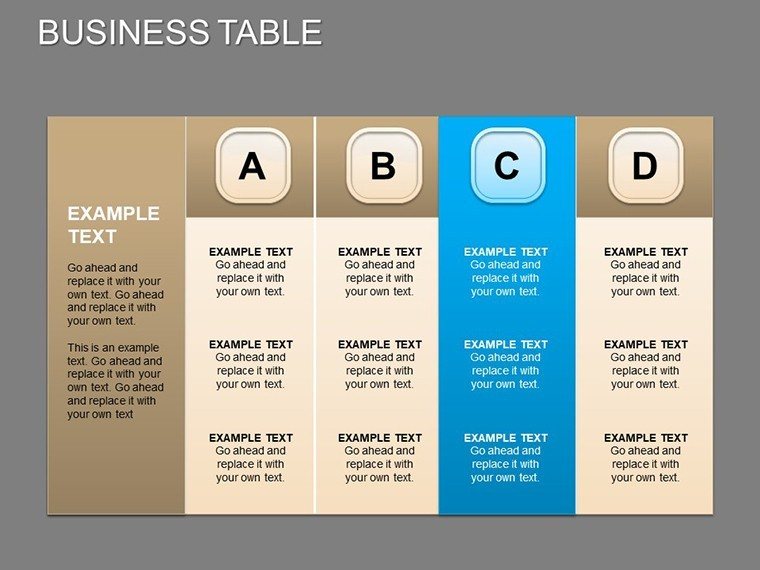
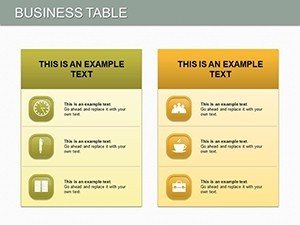
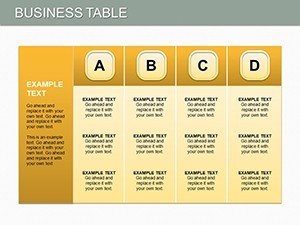
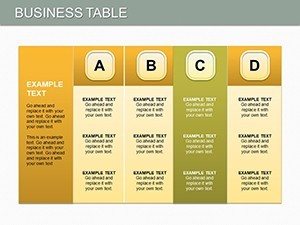
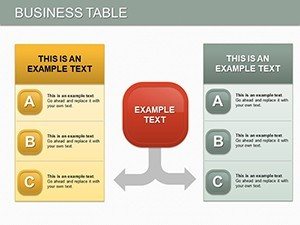
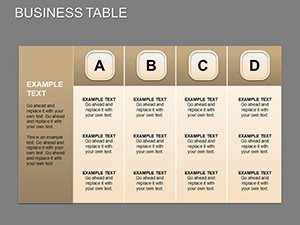
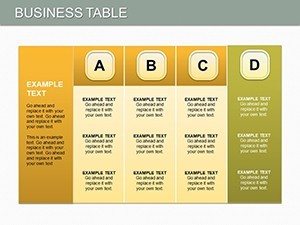
From multi-column comparisons to nested hierarchies, these tables go beyond grids, incorporating subtle colors and icons for at-a-glance insights. PowerPoint-native with Google Slides harmony, it slashes design drudgery, letting you focus on the story behind the stats. Drawing from data pros' playbooks, like those quarterly reviews that clinched promotions, this template turns tables into talking points. Curious how? Let's table the discussion.
Feature Spotlight: Tables Tuned for Triumph
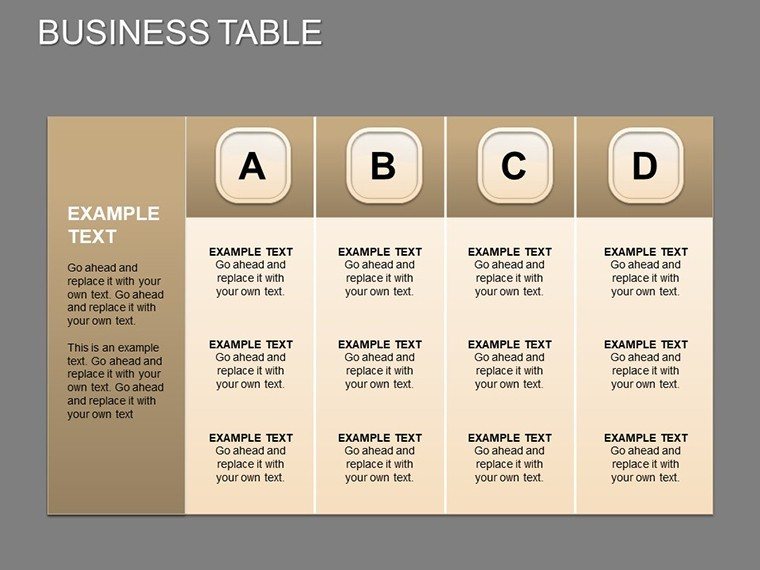
Precision engineering defines this template, where tables aren't static - they're storytellers. Professional crafting ensures every row aligns, columns scale smartly for mobile views.
- Brand-Aligned Tweaks: Match hues to logos, fonts to house style - seamless via theme integration.
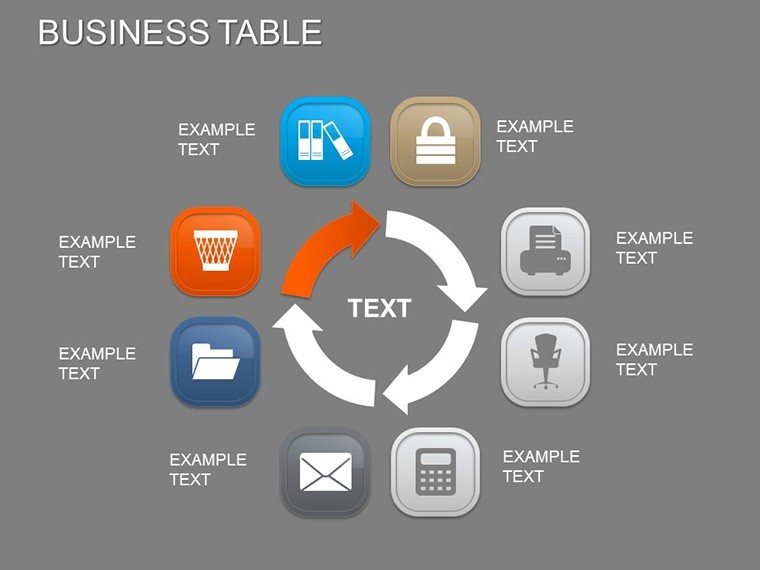
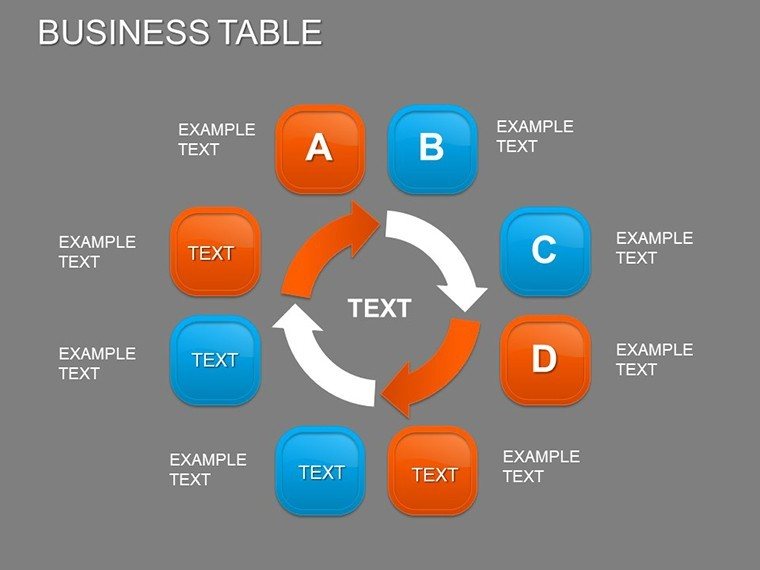
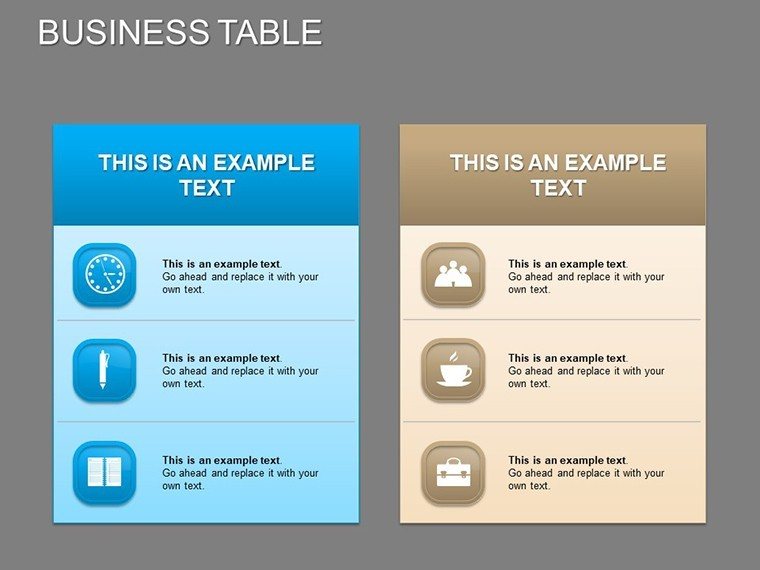
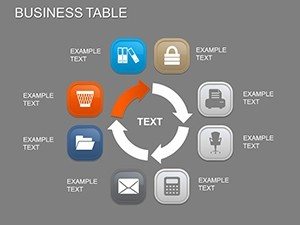
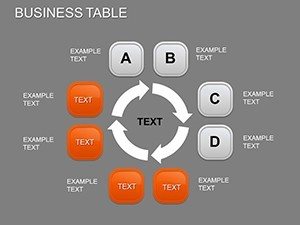
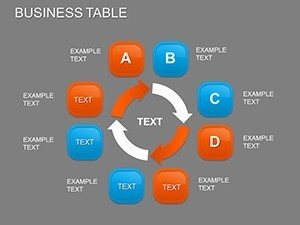
- Diverse Layouts: Pivot tables for dynamics, heat maps for variances across 25 slides.
- Edit-Friendly Core: Ungroup elements freely, add formulas for auto-calcs.
- Inclusive Design: High-contrast options for accessibility, novice-proof guides embedded.
A marketing lead's tale: Swapping bland Excel pastes for these tables boosted pitch conversions by 28%, proving the power of polished presentation. It's versatile velocity for busy pros.
Versatile Ventures: Tables in the Trenches
Deploy across domains with ease. Sales teams leverage slide 8's funnel tables, rows tracking leads to closes - a rep closed a $50K deal visualizing pipeline health.
Analysts adore slides 15-18: Comparative matrices benchmarking KPIs, shading winners in green. In research, it framed survey data, streamlining peer reviews.
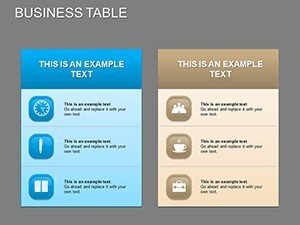
- Exec Overviews: Summary tables on slide 3 for P&L snapshots, footnotes for depths.
- Educator Aids: Grading matrices on slide 21, sortable for trend spotting.
- Consultant Compares: Side-by-side tables on slide 24 for ROI models.
Superior to default inserts, its variety - from bordered to open layouts - avoids monotony, linking to CRMs for live refreshes. Tables that work as hard as you do.
Table-Turning Techniques
Pro move: Sortable headers for interactive sessions; freeze panes for long scrolls. Weave narratives: Top-load key rows, bottom-footnote assumptions. For flair, embed sparklines in cells for mini-trends.
Trust boost: Cite sources in footers, echoing analytical rigor. From war rooms to webinars, these tables forge focus and foster decisions.
The Table-Topper Choice
What elevates this? Breadth - 25 slides spanning simple lists to complex merges, informed by biz-intel bests. Users hail time savings: "From hours to minutes," per a CFO. $20 unlocks endless clarity.
Table your doubts: Acquire the Business Table PowerPoint Charts Template today and let data dictate dialogue. Precision awaits - procure now.
Frequently Asked Questions
Are tables formula-ready?
Yes - pre-set SUM/AVERAGE links to cells for instant computations.
Google Slides friendly?
Fully - import and edit without fidelity loss.
Best for large datasets?
Spot on; expandable rows handle thousands, with filters built-in.
Customization depth?
Deep - borders, merges, conditional colors all at your fingertips.
Includes examples?
Affirmative - sample biz data populates for swift starts.