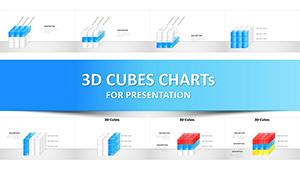
Visualize Progress with Dynamic Movement Charts in PowerPoint


Type: PowerPoint Charts template
Category: 3D
Sources Available: .pptx
Product ID: PC00341
Template incl.: 22 editable slides
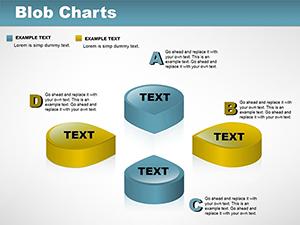
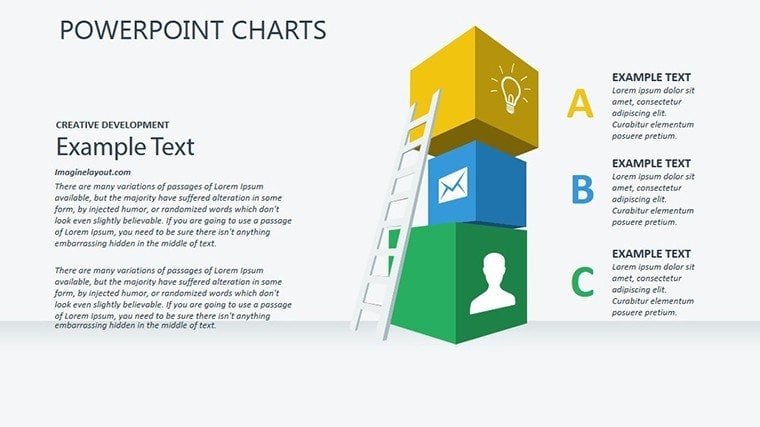
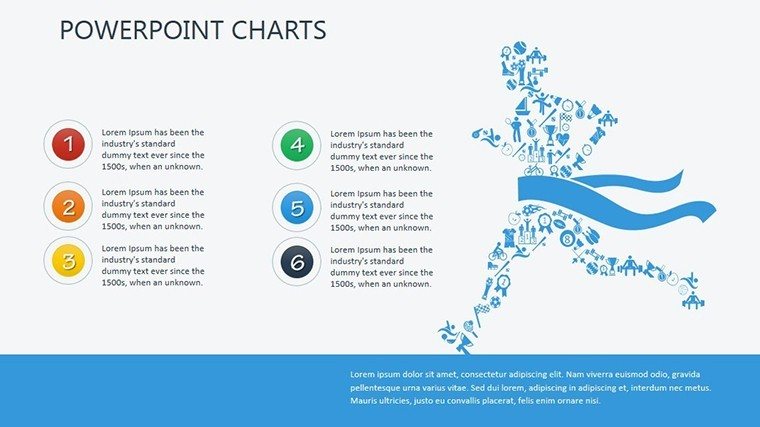
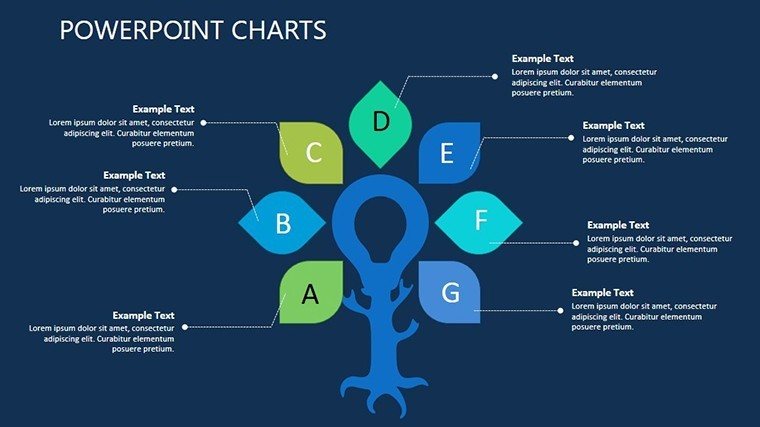
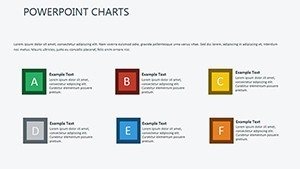
Dynamic movement charts are a powerful tool for visualizing progress in a variety of areas. Whether you're tracking sales figures, employee performance, or project progress, these charts provide a clear and concise way to see how things are developing over time.
One of the most popular software programs for creating dynamic movement charts is Microsoft PowerPoint. With a simple and intuitive interface, it's easy to create charts that are both visually appealing and packed with information. Whether you're working alone or with a team, PowerPoint's dynamic movement charts make it easy to see how things are going, and identify areas that need improvement.
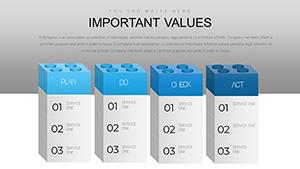
Understanding Dynamic Movement Charts
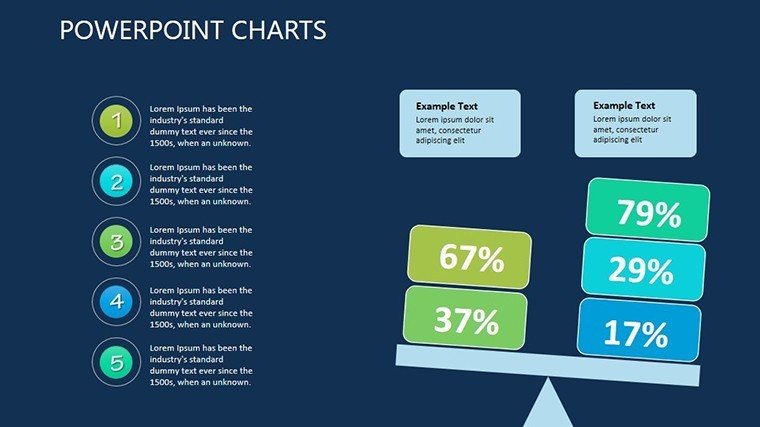
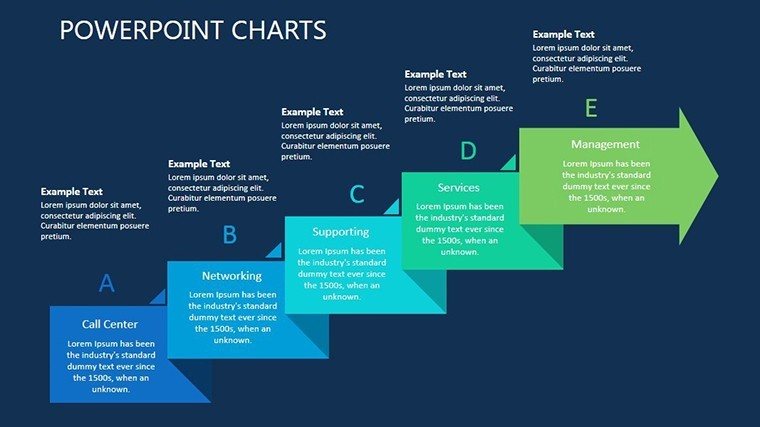
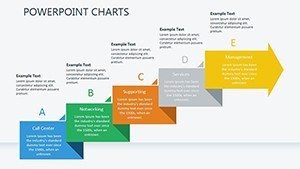
Dynamic movement charts are a type of data visualization tool that allows you to see changes over time. They are particularly useful for tracking progress in areas such as sales, employee performance, and project progress. By visualizing the data in this way, you can quickly identify trends and patterns, and make more informed decisions about how to proceed.
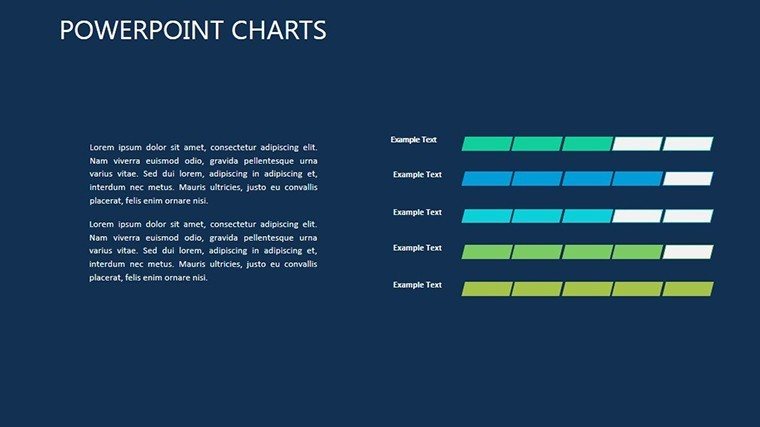
Dynamic movement charts come in a variety of shapes and forms, each designed to display different types of data. For example, line charts are useful for tracking changes in sales figures over time, while bar charts are useful for comparing the performance of different employees or departments.