Cycle Diagram PowerPoint Template | Square Cycle Design - Fully Editable Instant Download


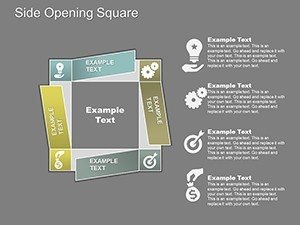


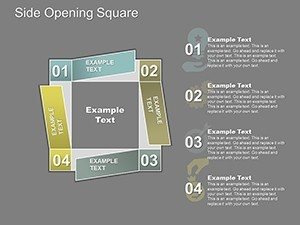
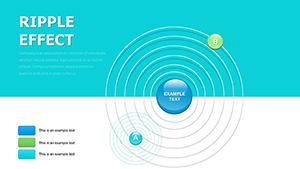
Business processes rarely follow straight lines. Customer lifecycles loop, product development iterates, and quarterly planning cycles repeat. This Square Cycle PowerPoint Chart Template offers 17 fully editable slides that frame cyclical workflows in structured square diagrams, making complex processes clear and actionable for project managers, business analysts, and strategic planners.
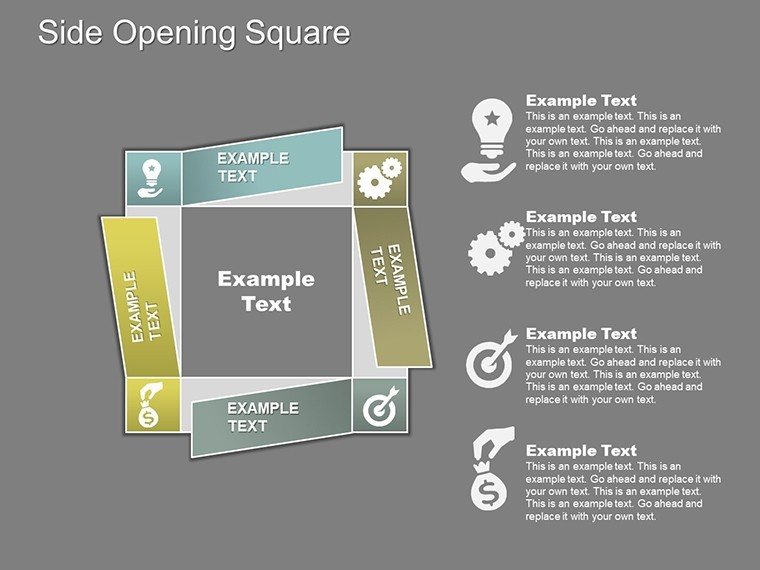
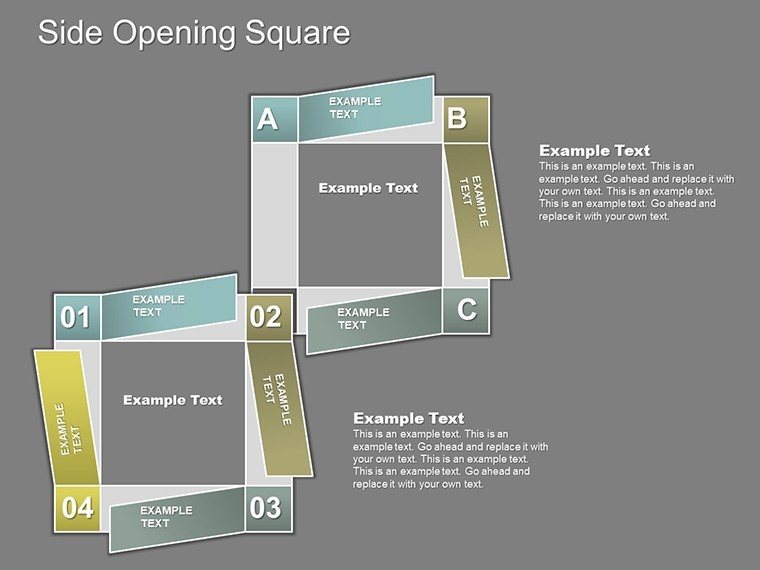
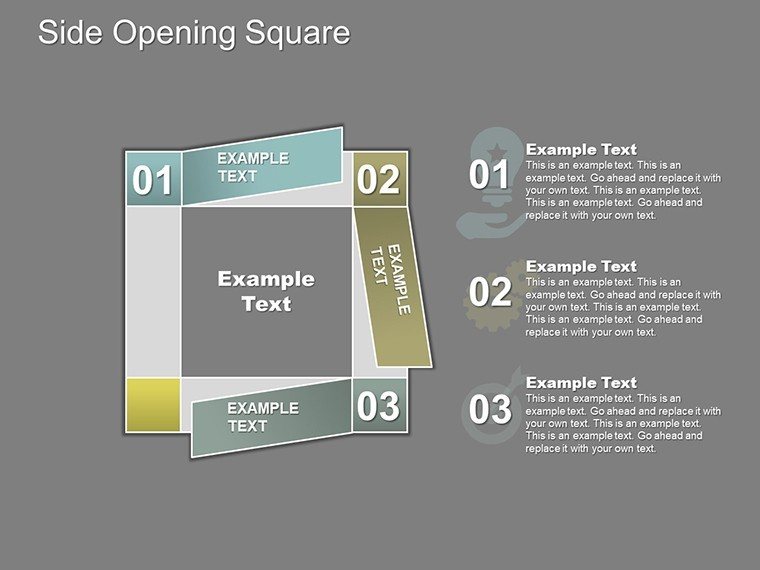
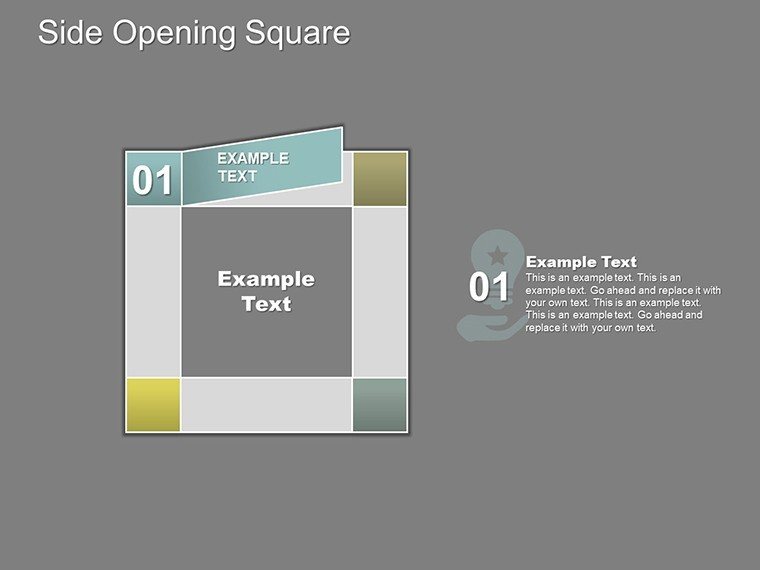
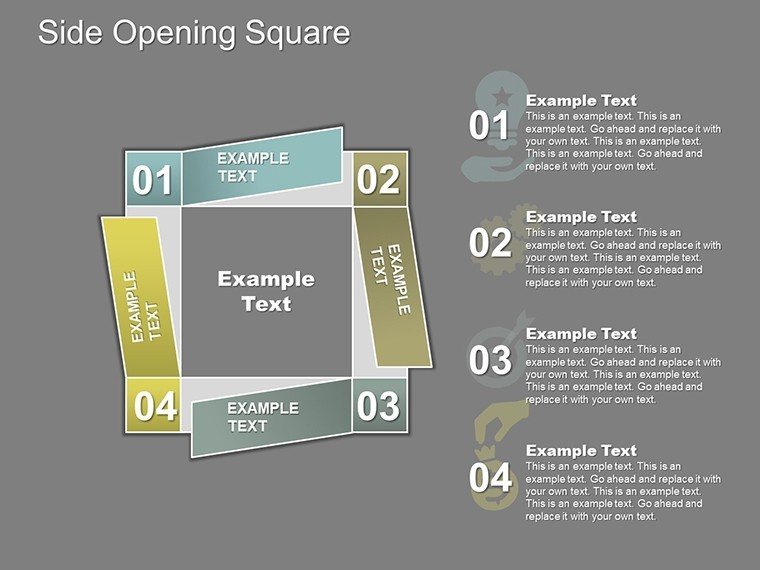
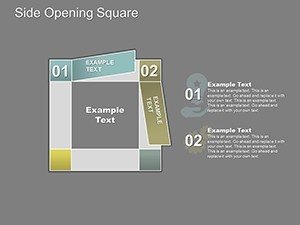
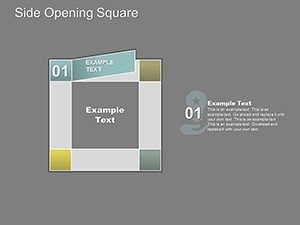
The square layout provides clean modularity, allowing you to break down sub-processes while keeping the overall cycle visually balanced and professional.
Key Features
Designed for real-world presentation needs, this template combines flexibility with professional polish.
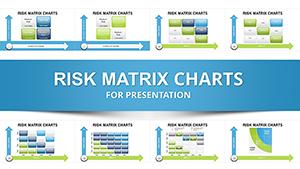
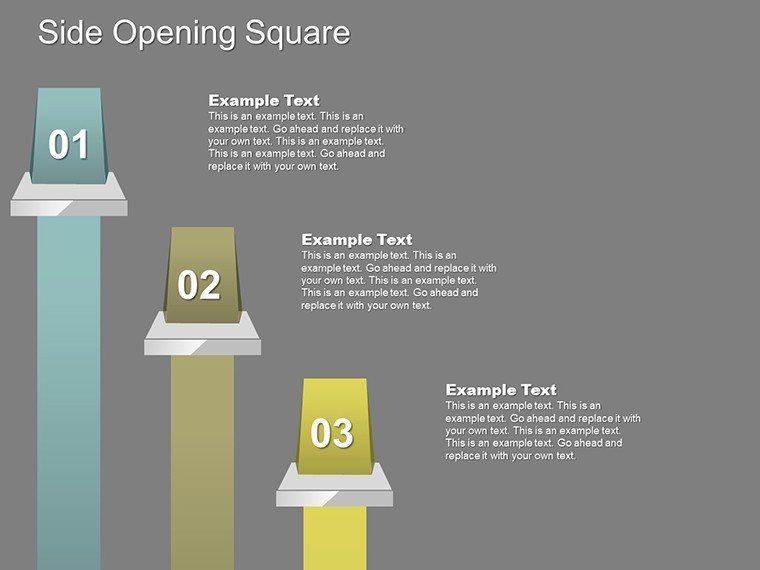
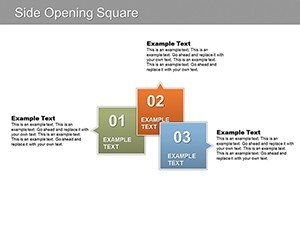
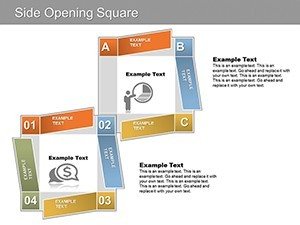
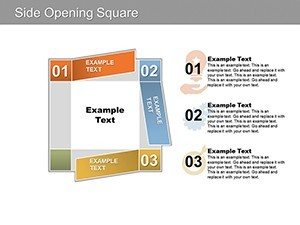
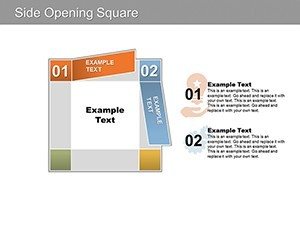
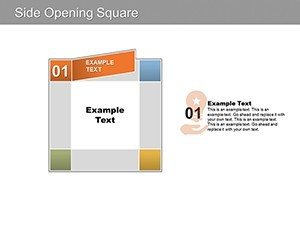
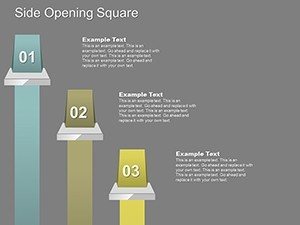
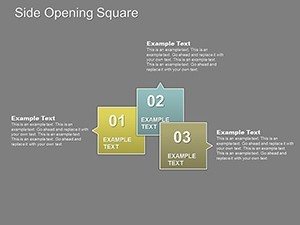
- 17 unique slide layouts built around square cycle variations
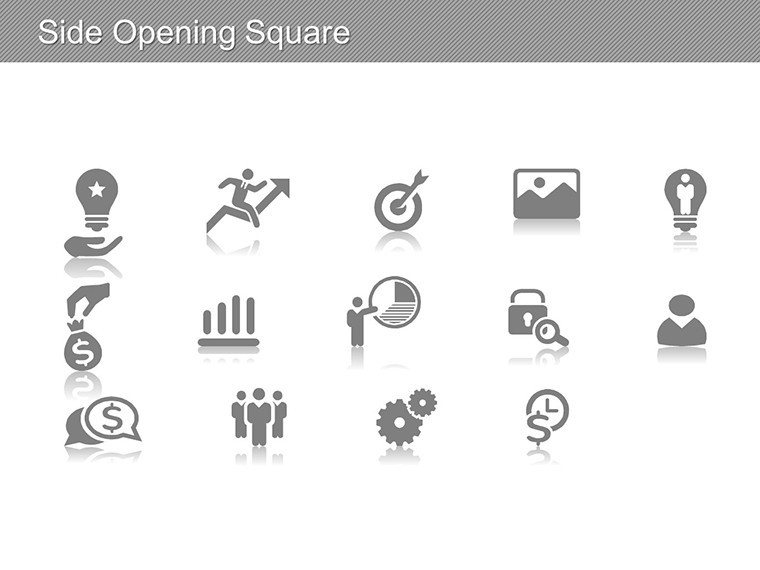
- 100% editable native PowerPoint elements - shapes, text, colors, and icons
- Modular square components for easy customization of sub-processes
- Pre-built sequential animations to reveal steps progressively
- Direct Excel/CSV data linking for automatic chart updates
- Multiple theme variations (corporate, creative, minimalist)
Every element is built in PowerPoint, ensuring full compatibility and smooth editing experience.
Professional Use Cases
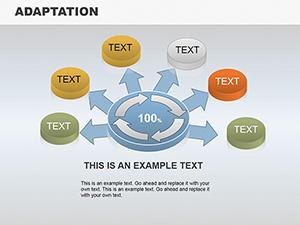
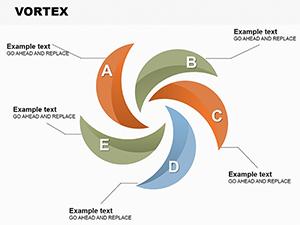
Square cycle diagrams shine when you need structured representation of repeating or looping processes.
- Customer Journey Mapping: Illustrate acquisition, engagement, retention, and advocacy loops
- Product Development: Visualize iterative design, testing, and release cycles
- Strategic Planning: Present quarterly or annual review and planning cycles
- Operations: Map recurring production, supply chain, or service loops
- Consulting: Explain continuous improvement, PDCA, or change management cycles
The structured square format supports detailed annotations and hierarchy, making it ideal for data-rich or complex cyclical explanations in client meetings, internal reviews, or training sessions.
How to Customize and Present
After instant download, open the file directly in Microsoft PowerPoint (2010 or later, including Microsoft 365).
Edit text placeholders, resize or rearrange squares, change colors via theme options, and link your own data from Excel for dynamic updates.
Use the built-in animations to control information flow, export to PDF for distribution, or present live.
Elevate your process presentations - download this fully editable square cycle template today.
Frequently Asked Questions
Is this template fully editable in PowerPoint?
Yes. All shapes, text, colors, icons, and layouts are native PowerPoint elements, giving you complete freedom to customize without restrictions or additional software.
How many slides are included?
The template contains 17 professionally designed, fully editable slides with various square cycle layouts and supporting elements.
Does the template support data-driven charts?
Yes, the diagrams include direct Excel and CSV integration, so charts update automatically when source data changes.
What PowerPoint versions are compatible?
The template works with Microsoft PowerPoint 2010 and newer, including PowerPoint for Microsoft 365 on Windows and Mac.
Can I change colors and themes to match my branding?
Absolutely. The template includes multiple built-in color themes, and you can fully customize colors, fonts, and styles using PowerPoint’s standard tools.