Interactive Circular Charts PowerPoint Template for Cycles


Type: PowerPoint Charts template
Category: Cycle
Sources Available: .pptx
Product ID: PC00157
Template incl.: 28 editable slides
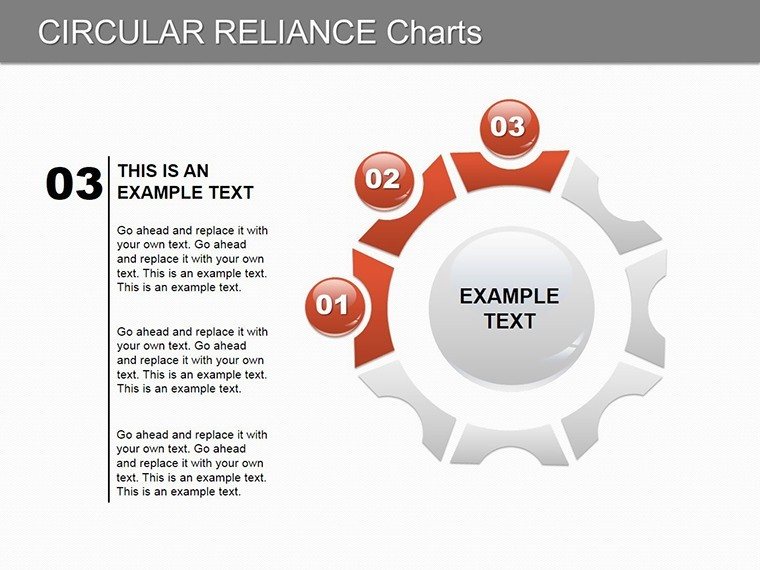
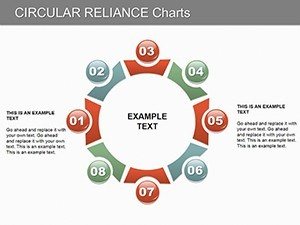
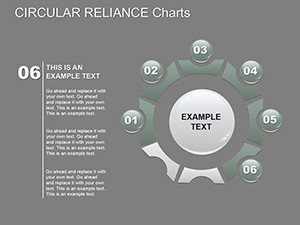
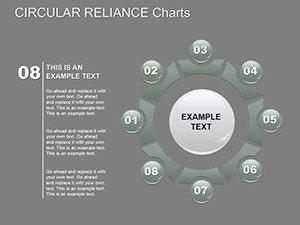
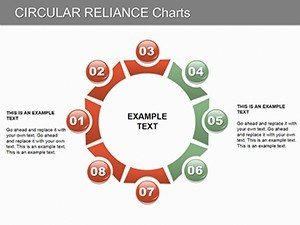
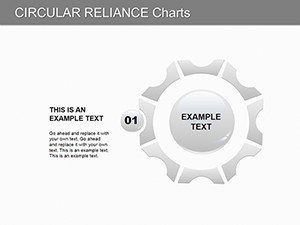
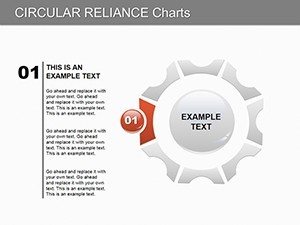
Cycles define much of our world - from business lifecycles to ecological systems - and visualizing them effectively can unlock profound insights. Our Circular Reliance PowerPoint Charts Template provides 28 editable slides to craft these stories with elegance and interactivity. Tailored for professionals pitching strategies, educators teaching processes, marketers showcasing campaigns, and analysts decoding data, this template turns circular concepts into compelling visuals. Picture radial diagrams revealing interconnected dependencies, or pie charts evolving through animations to show progression - it's designed to make your audience lean in and connect.
With a focus on reliance and interconnectedness, the template excels in scenarios where relationships matter, offering tools that go beyond static images to foster understanding and persuasion.
Delving into the Template's Dynamic Features
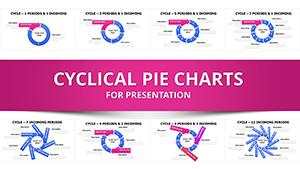
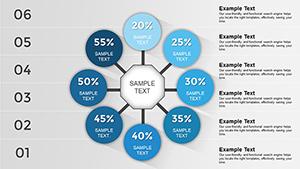
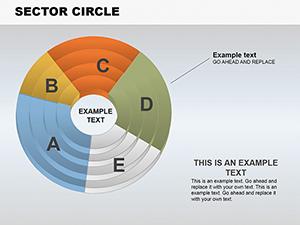
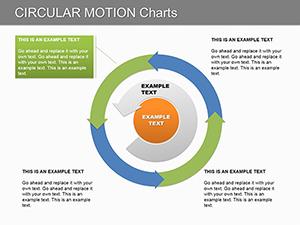
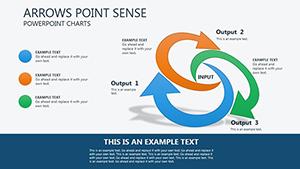
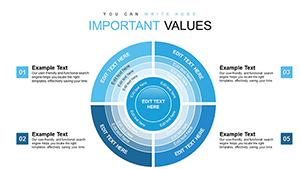
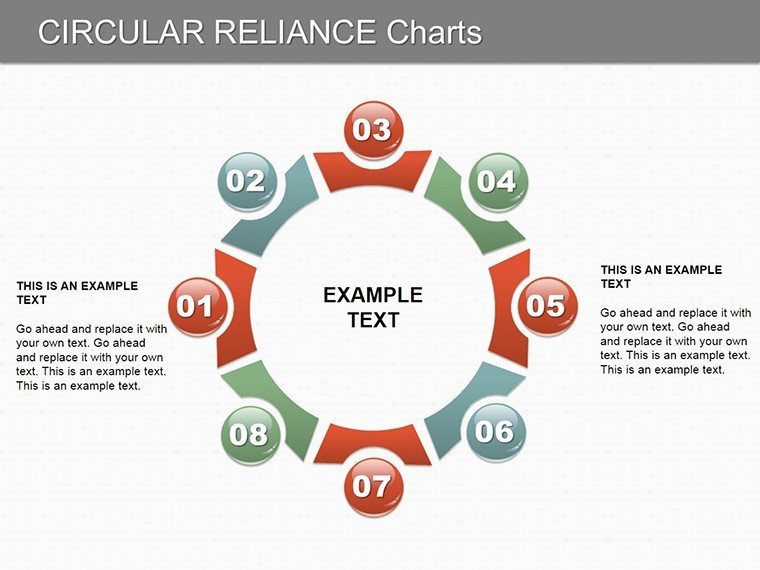
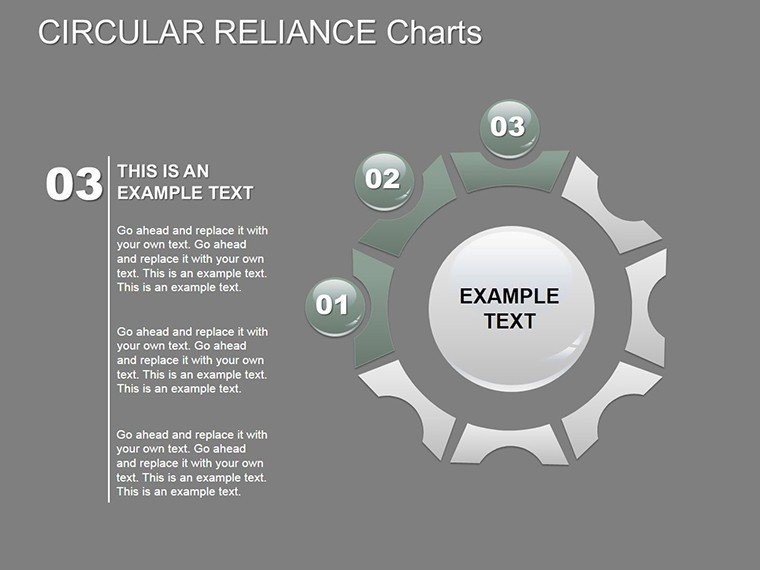
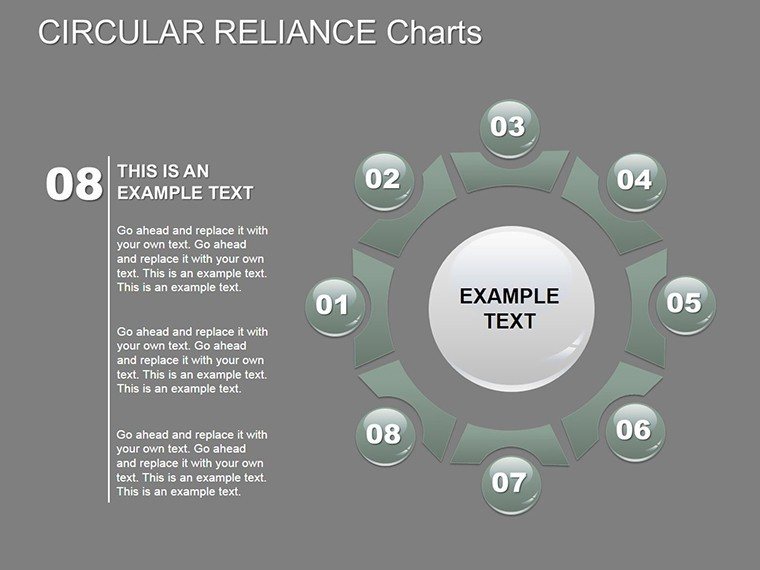
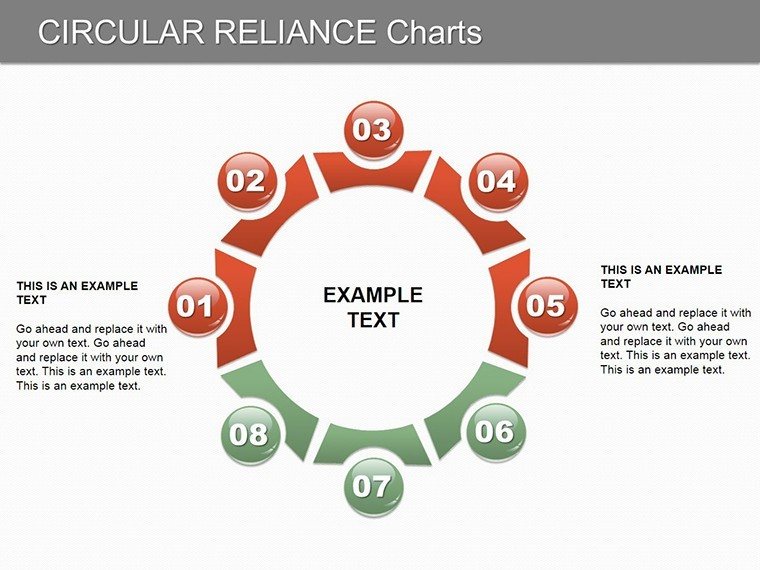
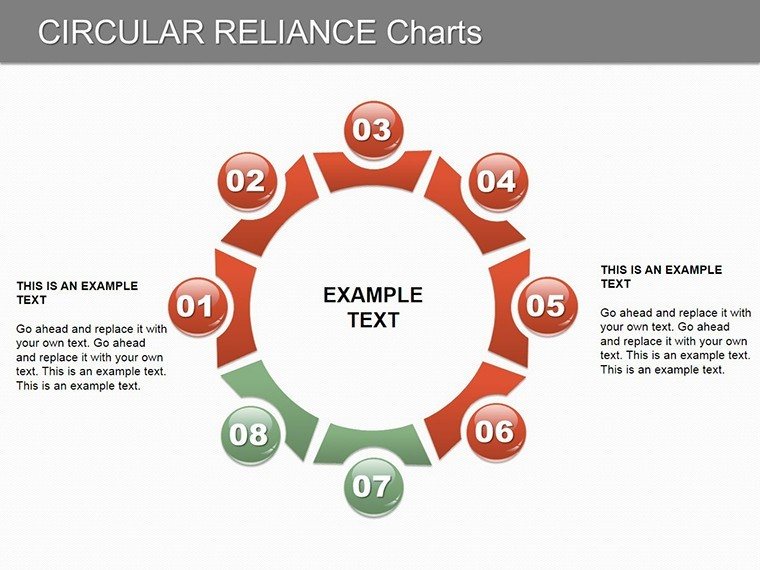
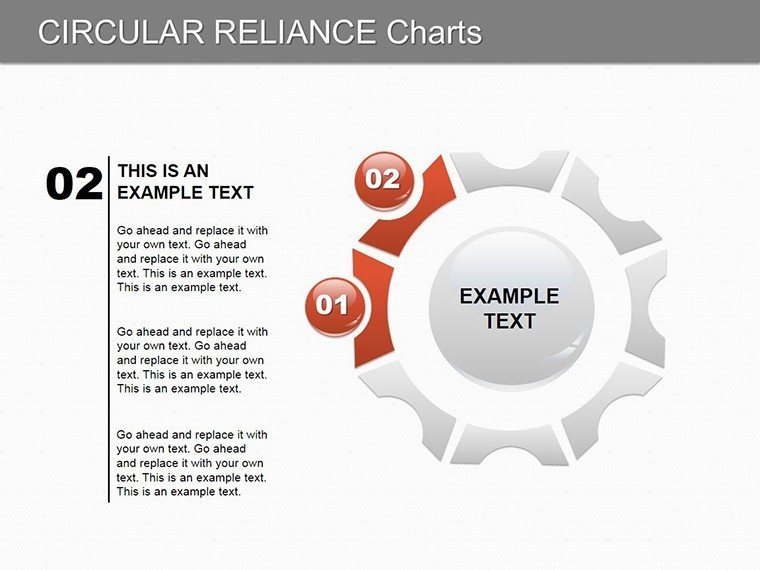
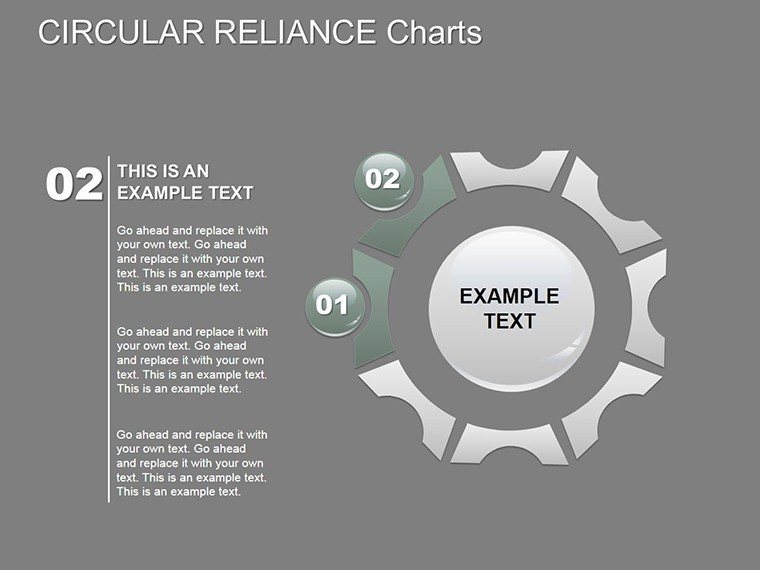
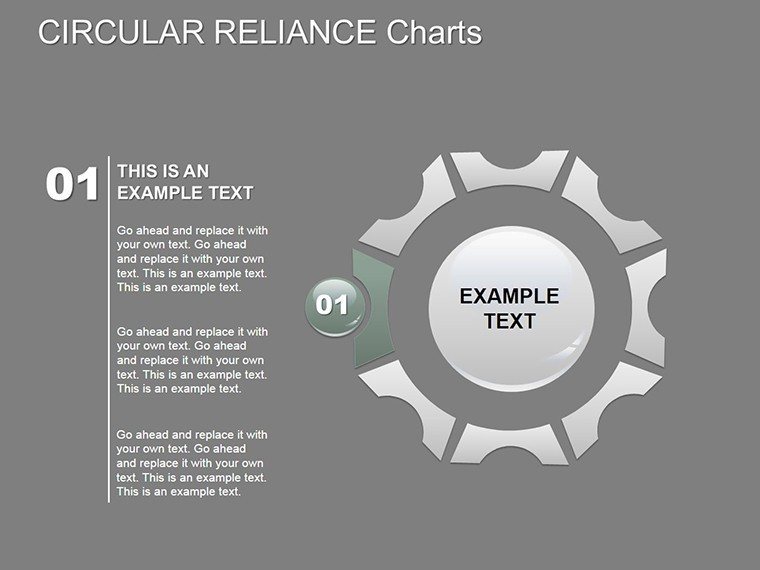
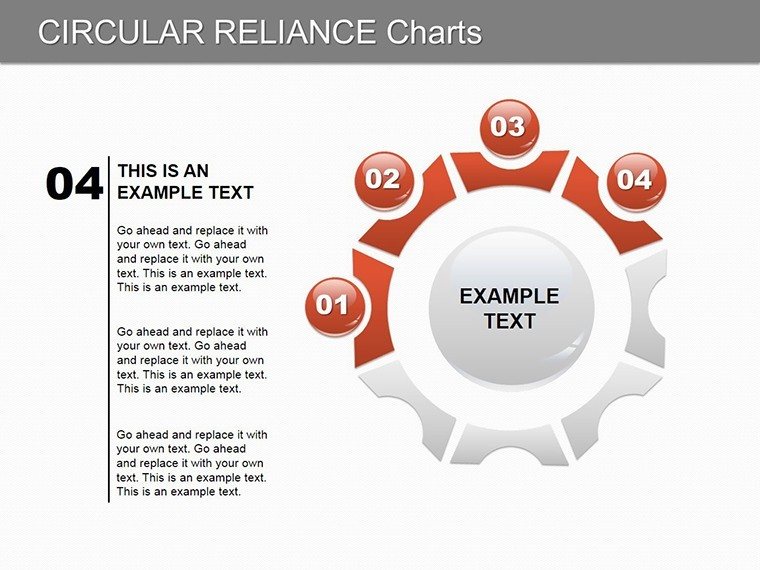
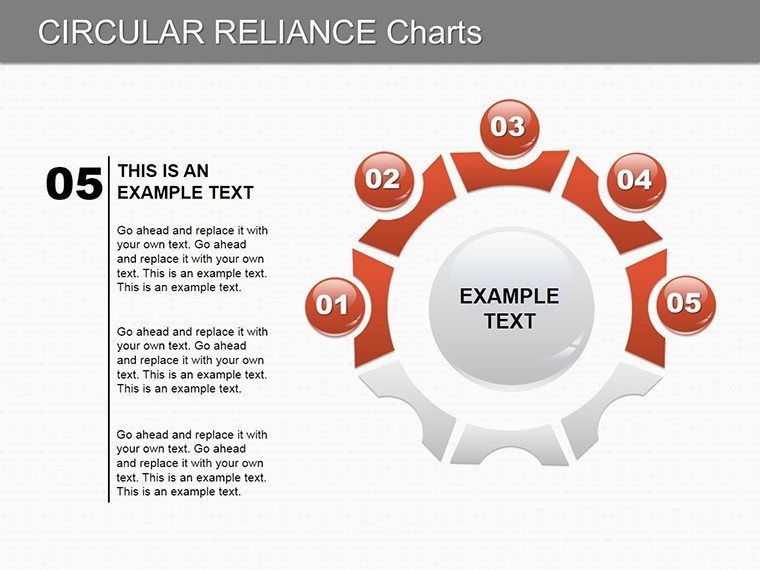
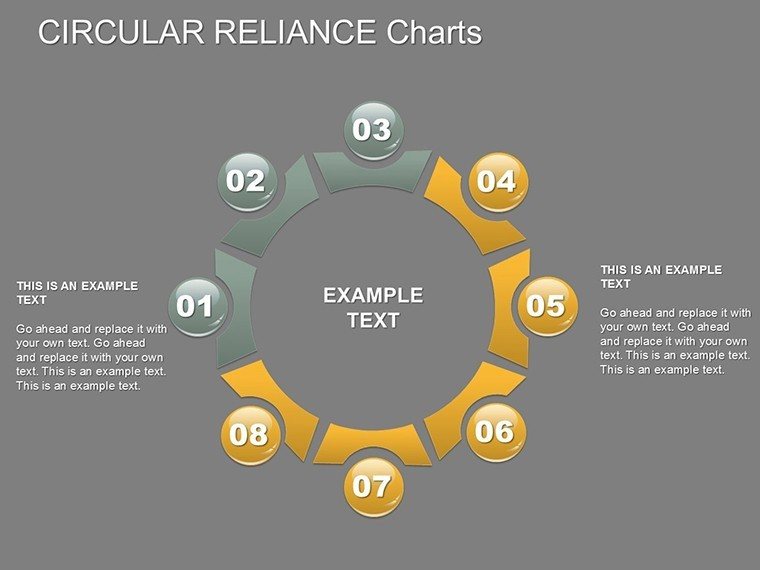
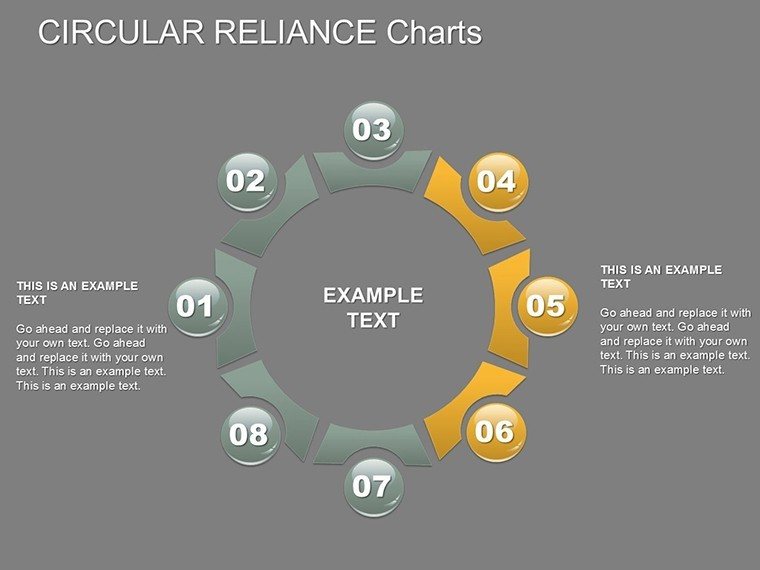
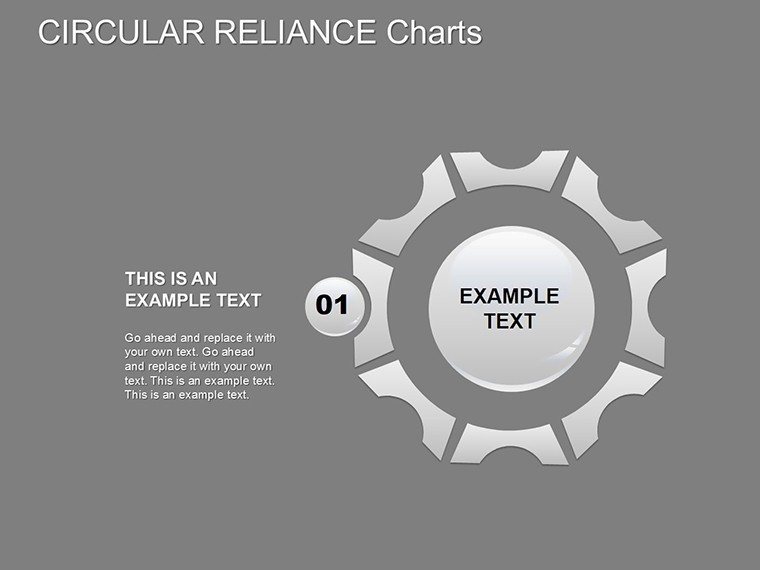
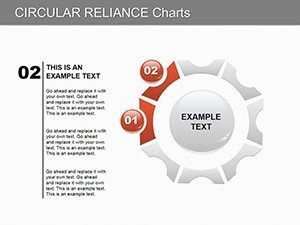
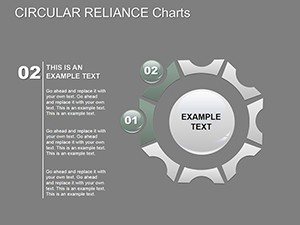
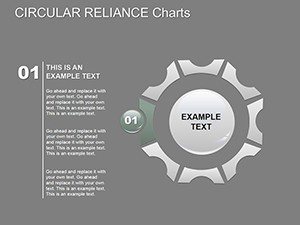
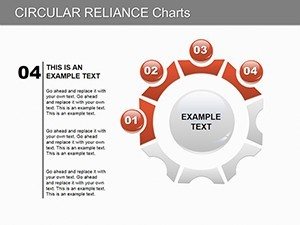
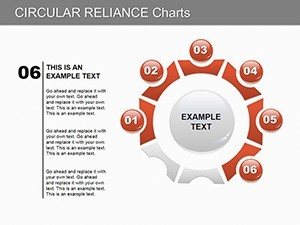
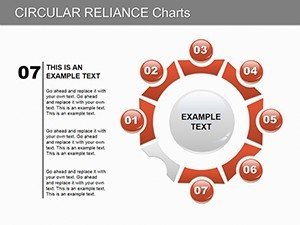
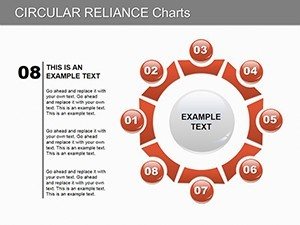
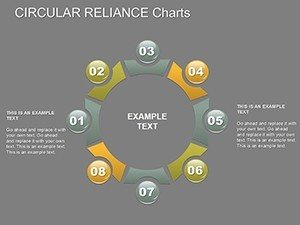
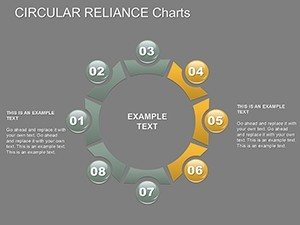
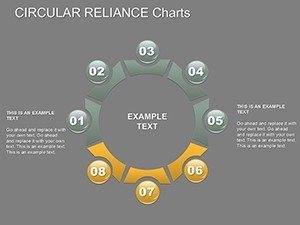
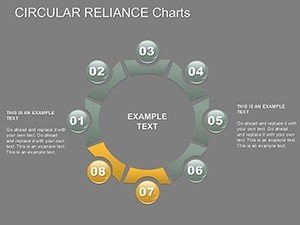
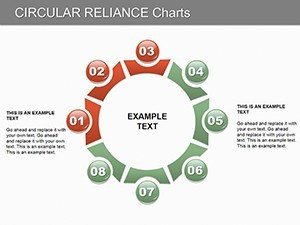
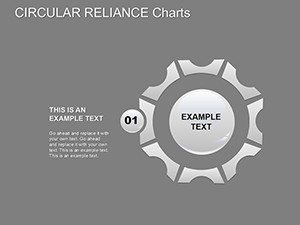
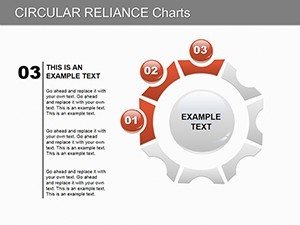
Variety is key: from pie charts segmenting market shares to radial diagrams mapping dependencies. An interactive slide allows clicking segments for deeper dives, perfect for layered analyses. Customization spans colors (brand-aligned), fonts (for hierarchy), and layouts (radial vs. concentric).
Dynamic visualization comes alive with animations that reveal data progressively, highlighting trends like in economic cycles. This mirrors techniques used by data viz experts at Tableau, emphasizing interactivity for engagement.
Seamless tailoring ensures your message resonates, with options for embedding live data links for real-time updates.
Broad Spectrum of Use Cases
Entrepreneurs can depict product lifecycles, showing reliance on phases from ideation to launch, as in Lean Startup methodologies. Educators simplify feedback loops in biology, aligning with NGSS standards for visual learning.
Marketers visualize customer retention cycles, with circular charts tracking touchpoints - boosting strategies like those at HubSpot. Analysts use for risk assessments, where interdependencies are charted, preventing oversights as in McKinsey reports.
In sustainability, illustrate carbon cycles for reports, aiding compliance with EPA guidelines through clear visuals.
Streamlining Your Circular Narrative Workflow
- Choose Your Cycle: Select from 28 slides matching your theme.
- Input and Interact: Add data, set interactions for engagement.
- Customize Aesthetics: Align visuals with your story's tone.
- Test Dynamics: Preview animations for smooth flow.
- Present Persuasively: Use notes for guided delivery.
This integrates with tools like Excel for data, enhancing efficiency.
Advantages Over Generic Circular Tools
PowerPoint's defaults lack interactivity; this template adds clickable elements and animations, elevating professionalism. Users report doubled engagement in webinars, crediting the dynamic features.
Insights for Mastering Circular Visuals
- Balance segments for visual harmony.
- Use animations sparingly to avoid distraction.
- Incorporate tooltips for added depth.
- Align colors with cycle stages - blues for calm phases.
- Validate with audience tests for clarity.
From viz pros, these tips ensure impact.
The Circular Reliance PowerPoint Charts Template weaves connections into visuals. Embrace cycles, reveal reliances - download and craft your story today.
FAQ
How interactive are the charts?
Highly, with clickable segments and animations for engaging reveals.
Can I link to external data?
Yes, embed Excel links for dynamic updates.
Ideal for which industries?
Business, education, marketing, analysis - versatile across fields.
Support for large datasets?
Yes, scalable designs handle complex data without clutter.
Export options available?
Export to PDF or video for sharing beyond PowerPoint.