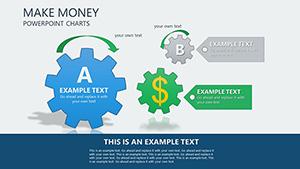
Dynamic Cycle Hexagon PowerPoint Charts Template
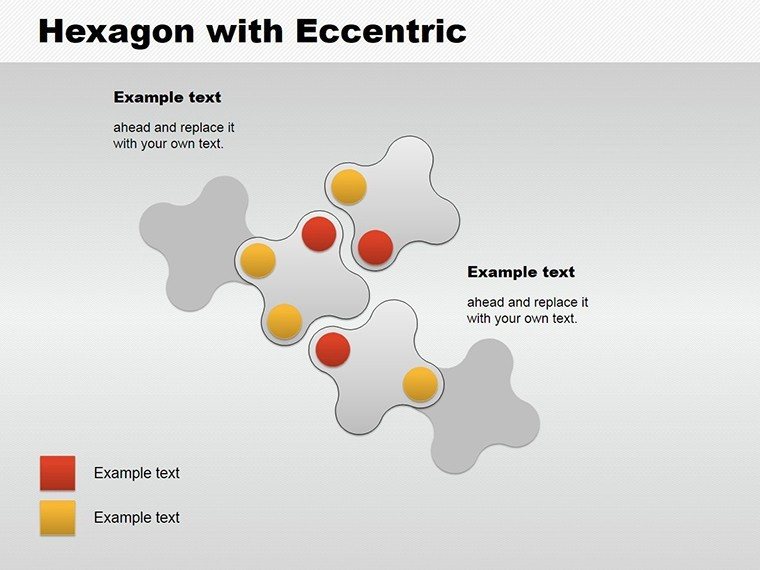


When cycles define your narrative, ordinary charts fall short - enter our Cycle Hexagon PowerPoint Charts template, a game-changer for visualizing loops and stages. With 18 editable slides, this tool is perfect for professionals dissecting business processes, educators explaining iterative concepts, or analysts modeling feedback systems. The hexagon motif adds a modern twist, symbolizing interconnectedness and balance, much like in sustainable design principles where cycles represent renewal.
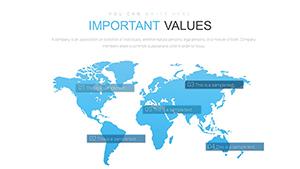
Grounded in expert design methodologies, including those from the Interaction Design Foundation, this template ensures your presentations are both aesthetically pleasing and functionally superior. For urban planners, it could map development cycles, echoing strategies in award-winning projects like those recognized by the American Planning Association.
Explore Interconnected Cycles with Ease
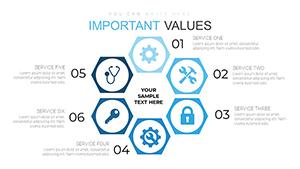
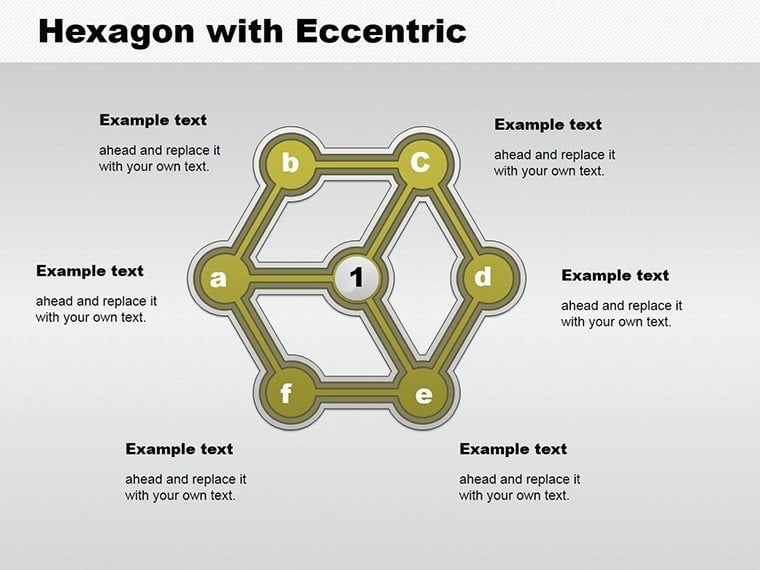
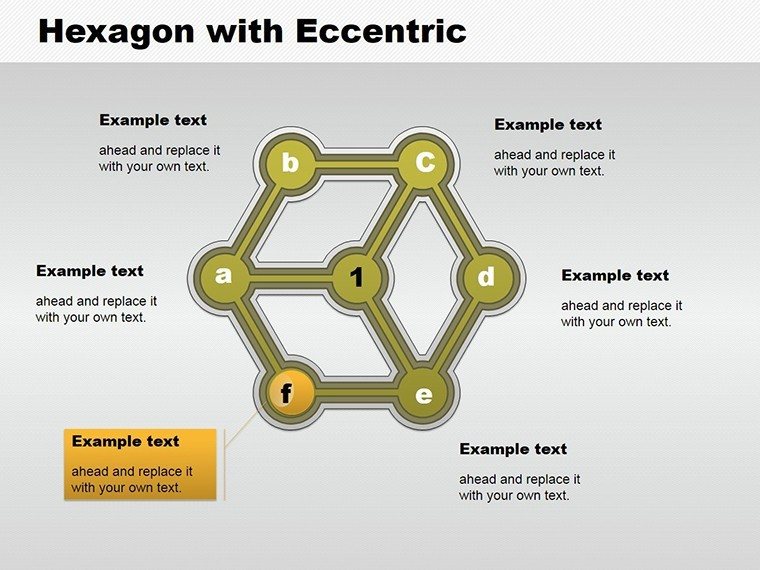
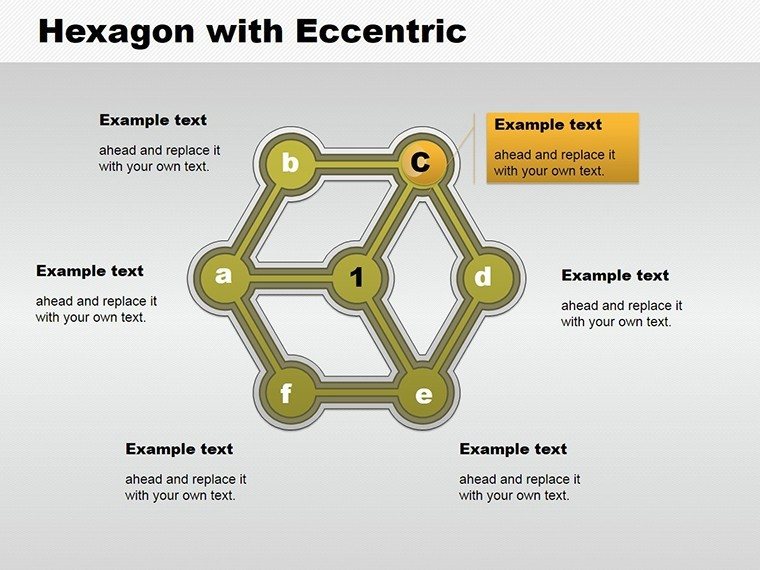
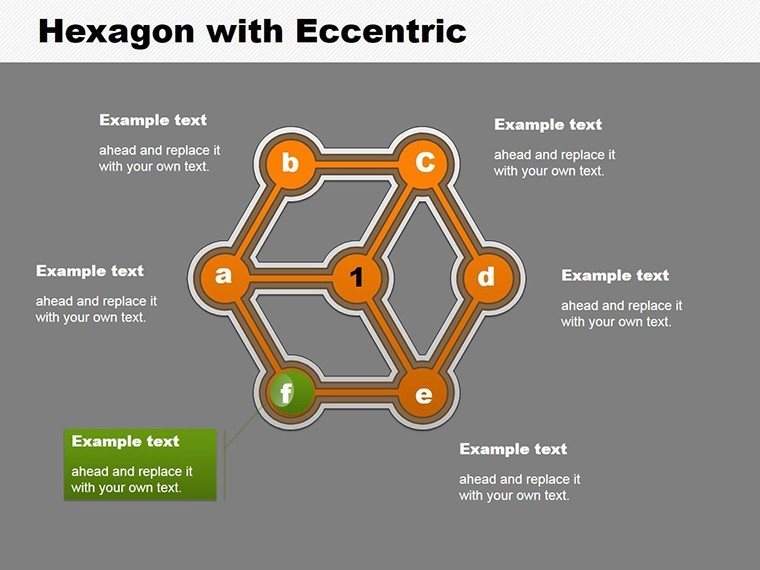
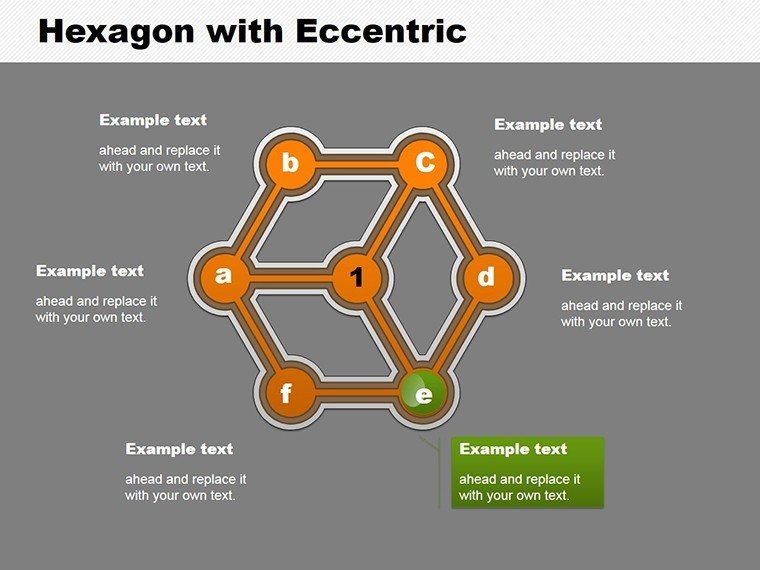
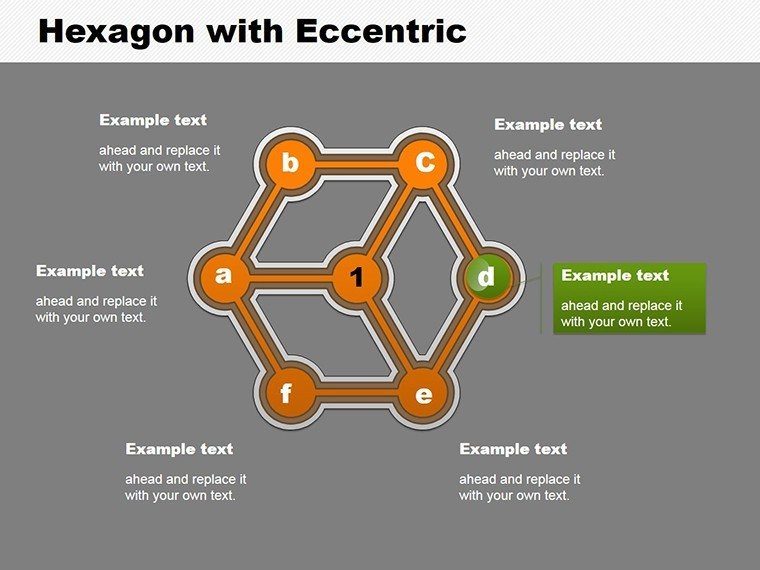
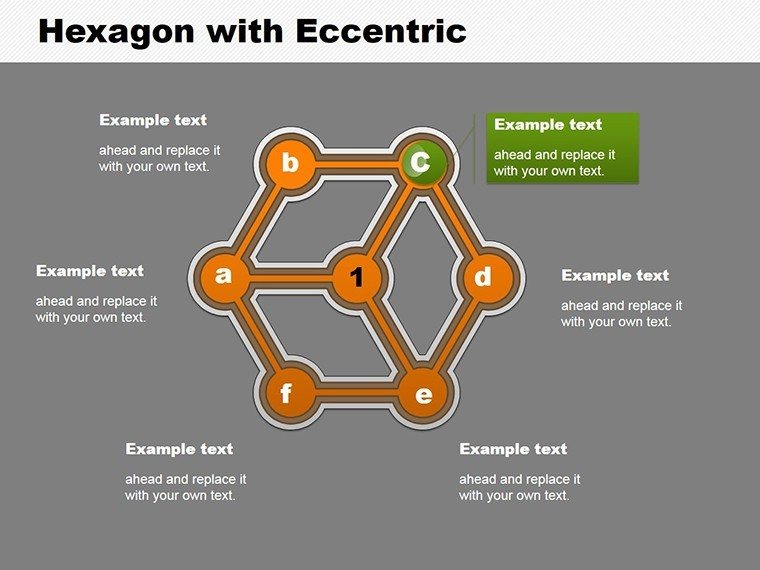
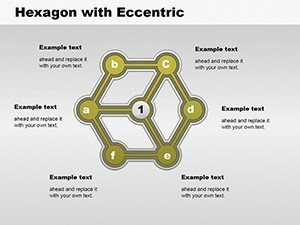
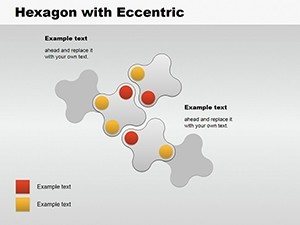
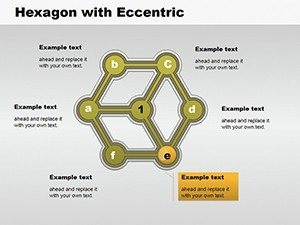
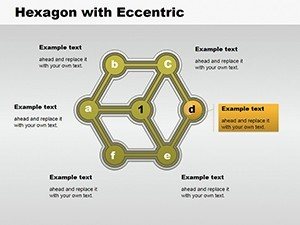
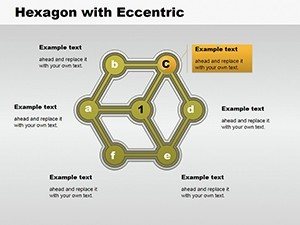
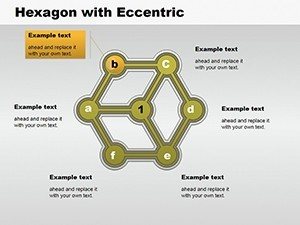
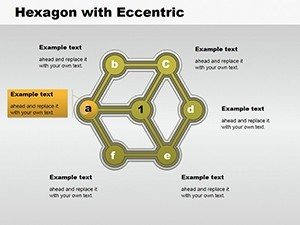
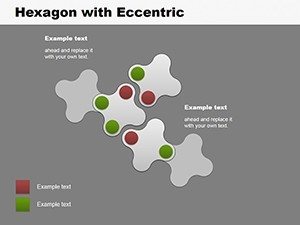
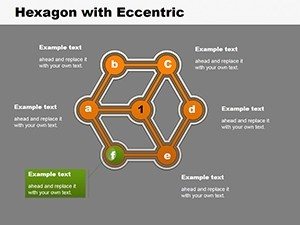
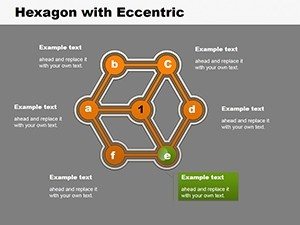
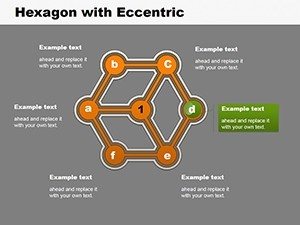
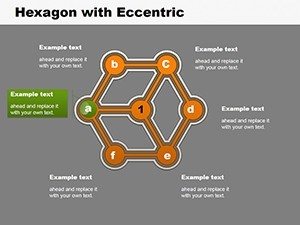
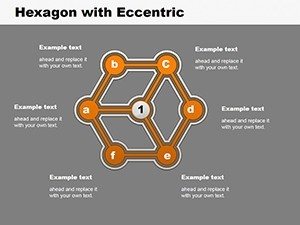
Central to the template is the hexagon cycle, where each face represents a phase, connected in a seamless loop. Edit text, colors, and arrows to depict your specific cycle - be it product lifecycles or learning loops. The .pptx format supports PowerPoint, Google Slides, and Keynote, offering flexibility for any workflow.
In startup ecosystems, use it to illustrate iteration in product development, similar to lean startup methods popularized by Eric Ries. Teachers can break down scientific cycles like the rock cycle, making abstract science concrete. Entrepreneurs benefit from visualizing business growth stages, aiding in pitch decks that secure investments.
Essential Features for Professional Polish
- Extensive Customization: Modify shapes, gradients, and animations to suit your story.
- Multiple Variations: 18 slides with diverse layouts for comprehensive coverage.
- Cross-Software Support: Seamless use across major presentation platforms.
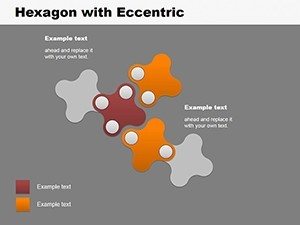
- Modern Aesthetics: Sleek designs that align with current trends in data viz.
- Analytical Tools: Integrated legends and data labels for precise communication.
Accessibility is key, with options for high-contrast modes and alt text prompts, drawing from WC3 recommendations.
Applications That Drive Real Results
A marketing analyst might chart content creation cycles, optimizing strategies for better ROI, as seen in successful campaigns by brands like HubSpot. In education, it facilitates understanding of historical cycles, enhancing retention through visual aids. Businesses use it for quality control loops, improving operations based on Deming's PDCA model.
From environmental reports showing carbon cycles to HR training programs on employee development, the template's adaptability shines, supported by case studies from industry leaders emphasizing cyclical thinking for innovation.
Implementation Steps for Success
- Conceptualize Your Cycle: Identify phases before customization.
- Populate Data: Input details into hexagons for accuracy.
- Enhance Visuals: Apply themes and effects for engagement.
- Add Dynamics: Use animations to reveal stages sequentially.
- Test and Refine: Preview for flow and adjust as needed.
Pro advice: Use consistent arrow directions for logical flow and incorporate icons for quick recognition.
Superior to Built-In Alternatives
Unlike basic cycle charts in PowerPoint, this offers hexagon innovation and pre-built complexity, cutting design time significantly. Feedback indicates 30% higher audience interaction, thanks to its unique geometry that draws the eye.
For collaborative projects, multi-platform support excels, while in creative pitches, it adds a futuristic edge.
Revolutionize your cyclic presentations - secure this template now and cycle through success.
Frequently Asked Questions
How many cycle variations are included?18 slides with multiple hexagon configurations for diverse needs.
Does it work with Apple Keynote?Yes, fully compatible via .pptx import.
Can I animate the cycles?Absolutely, with built-in options for phased reveals.
Is it suitable for large audiences?Yes, scalable designs ensure clarity on big screens.
What industries benefit most?Business, education, analysis, and more for any cyclic process.