Versatile Relative Relationship PowerPoint Charts Template


Type: PowerPoint Charts template
Category: Process
Sources Available: .pptx
Product ID: PC00115
Template incl.: 8 editable slides
Navigating the complexities of data relationships can turn any presentation into a challenge, but with our Relative Relationship PowerPoint Charts template, you gain a powerful ally. This collection of 8 editable slides is engineered to illustrate connections, hierarchies, and interdependencies with clarity and style. Aimed at busy professionals crafting strategic reports, teachers breaking down relational concepts, or students analyzing case studies, it simplifies the visualization of how elements interact. From organizational structures in business to ecosystem dynamics in education, these charts make abstract links tangible, fostering better understanding and decision-making.
As seasoned experts in presentation design, we draw on principles from information architecture to ensure each chart not only looks professional but also adheres to cognitive load best practices. For example, in project management, where understanding task dependencies is vital, these templates can map out workflows akin to those used in Agile methodologies by leading firms like Atlassian. The design emphasizes clean lines and intuitive layouts, making your presentations more persuasive and less overwhelming.
Delve Into Dynamic Data Connections
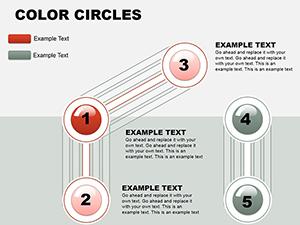
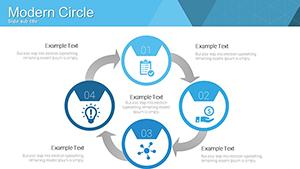
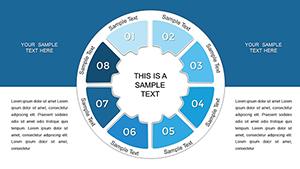
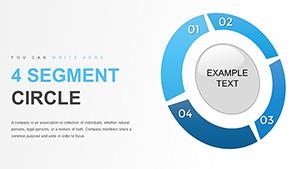
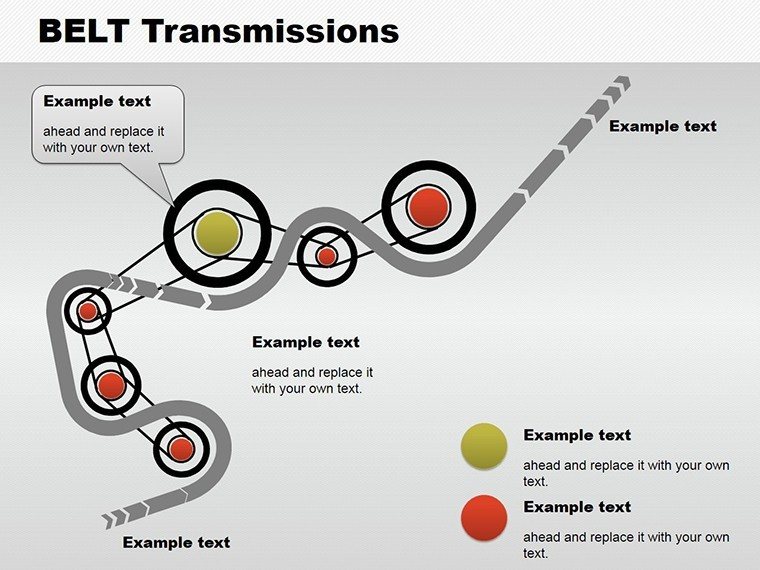
The core of this template is its focus on relative relationships, using arrows, nodes, and layered diagrams to show cause-effect or part-whole dynamics. Each slide is pre-formatted for quick edits - swap in your data, tweak connections, or recolor elements to align with your theme. The .pptx format guarantees smooth operation in PowerPoint, with bonus compatibility for Google Slides, allowing collaborative edits without hitches.
Envision deploying it in a sales meeting: chart out customer journey touchpoints, highlighting how each interaction influences the next, much like successful CRM strategies at companies such as Salesforce. In academia, professors can depict historical event sequences, aiding students in grasping causality. For personal projects, like genealogy research, it offers a structured way to visualize family ties, adding a layer of professionalism to hobbyist endeavors.
Standout Features for Seamless Use
- Intuitive Customization: Drag-and-drop interfaces for rearranging relationships, with smart guides to maintain alignment.
- Print-Ready Optimization: High-resolution elements that look sharp in digital or physical formats, perfect for reports.
- Varied Diagram Types: From flowcharts to Venn diagrams, covering a spectrum of relational visuals.
- Google Slides Integration: Import effortlessly for cloud-based teamwork and accessibility.
- Engagement Boosters: Built-in transitions that reveal connections progressively, keeping audiences hooked.
These features are informed by user testing, ensuring accessibility with color-blind friendly palettes and scalable fonts, aligning with ADA guidelines for broader reach.
Practical Scenarios and Impactful Outcomes
In a real-world scenario, a marketing team might use these charts to outline campaign ecosystems, showing how social media influences SEO, leading to measurable ROI improvements. Educators have reported enhanced student comprehension when using relational diagrams for subjects like biology, where cell interactions become vivid. Businesses in consulting leverage them for client audits, demonstrating value chains that justify recommendations, often resulting in repeat engagements.
Non-profits can map stakeholder relationships, clarifying roles and fostering collaboration. Drawing from case studies, such as those from Harvard Business Review on organizational mapping, this template empowers users to create visuals that drive action and insight.
Workflow Tips for Optimal Results
- Start with Structure: Outline your key relationships before opening the template.
- Data Integration: Link to Excel sheets for live updates, ensuring accuracy.
- Visual Refinement: Apply consistent styling for a cohesive look.
- Interactive Elements: Add hyperlinks to deepen exploration during Q&A.
- Finalize and Share: Export to PDF for distribution or present directly.
Incorporate pro tips like using negative space to avoid clutter and layering for depth, enhancing overall narrative flow.
Elevating Beyond Standard Tools
Compared to default PowerPoint features, this template offers specialized relational tools that save design time and add sophistication. Users frequently highlight a 50% reduction in preparation hours, allowing focus on content over formatting. Its unique connectors and auto-layouts prevent common pitfalls like misaligned elements, resulting in polished outputs that impress stakeholders.
For collaborative environments, like remote teams, the Google Slides compatibility shines, enabling real-time feedback. In creative industries, it serves as a foundation for bespoke visuals, integrating with stock icons for added flair.
Step up your relational storytelling - download this template today and connect your ideas like never before.
Frequently Asked Questions
What types of relationships can this template illustrate?It handles hierarchies, processes, and interdependencies with various diagram styles.
Is printing supported?Yes, optimized for high-quality prints in handouts or reports.
Can I collaborate on this in Google Slides?Absolutely, import the .pptx and edit collaboratively.
How do I add more connections?Use the built-in tools to draw additional arrows or nodes easily.
Is it suitable for beginners?Yes, with intuitive interfaces and pre-set layouts.