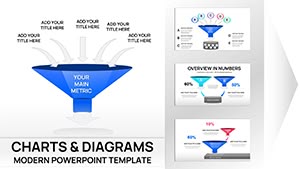
Flow Funnel PowerPoint Charts Template - 14 Editable Slides | Instant Download for Process Mapping


Type: PowerPoint Charts template
Category: Flow
Sources Available: .pptx
Product ID: PC00110
Template incl.: 14 editable slides
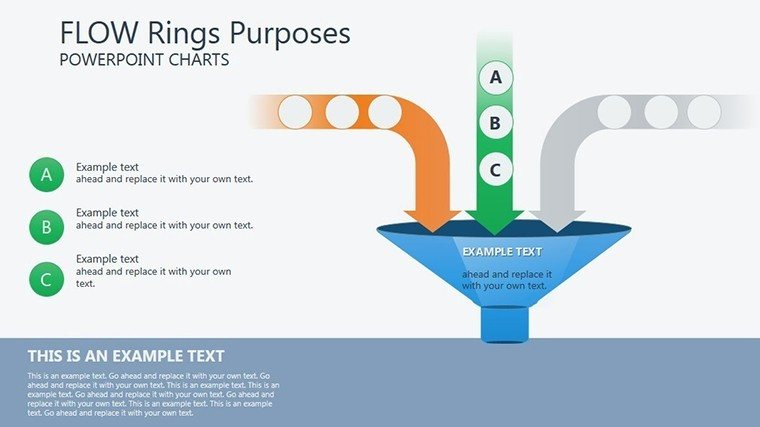
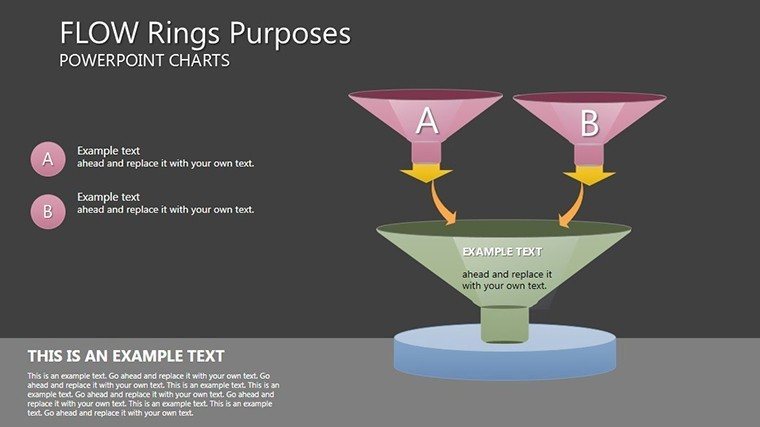
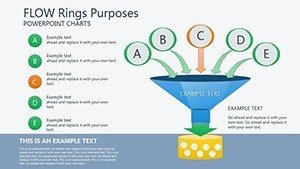
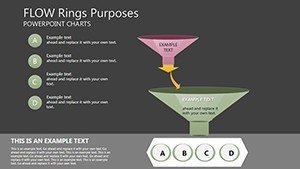
When mapping complex processes or customer journeys in executive presentations, static diagrams fail to capture the interconnected flow of modern business operations. This flow funnel PowerPoint charts template delivers 14 professionally designed slides that transform abstract processes into clear visual narratives your stakeholders can follow instantly.
I've used funnel charts in quarterly reviews to walk leadership through conversion bottlenecks - showing exactly where prospects drop off and why. The cascading ring design makes it immediately obvious which stage needs attention, turning what could be a confusing data dump into a focused discussion about priorities.
When You Need Flow Funnel Charts in Your Presentations
Sales teams use these slides to visualize pipeline progression from lead generation through closed deals. Marketing departments map customer journeys across touchpoints. Operations managers diagram workflow stages to identify process inefficiencies. Product teams illustrate user onboarding flows to spot friction points.
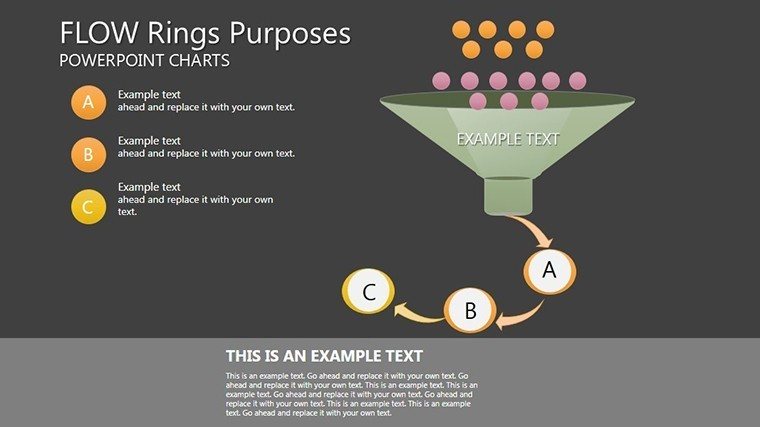
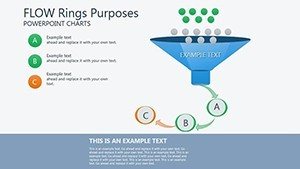
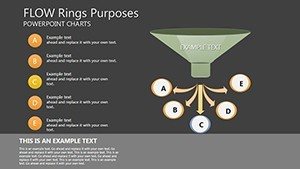
The template works particularly well when you need to show progressive narrowing - whether that's conversion rates, resource allocation, or decision trees. Each ring in the funnel represents a distinct stage, making it simple to communicate how volume changes as prospects, projects, or resources move through your process.
What's Inside This Flow Funnel Template
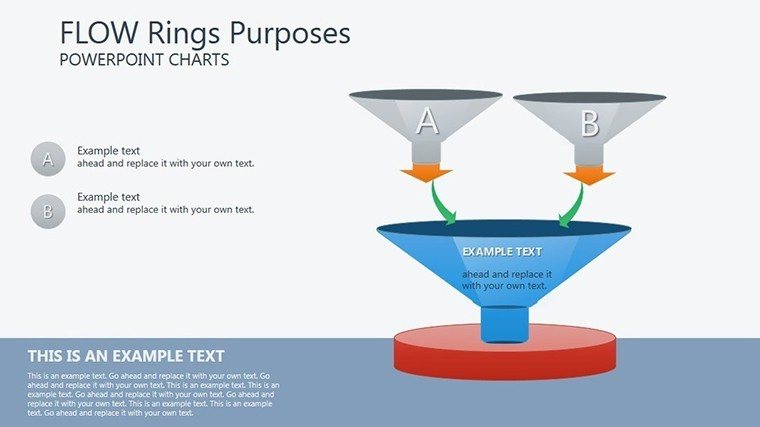
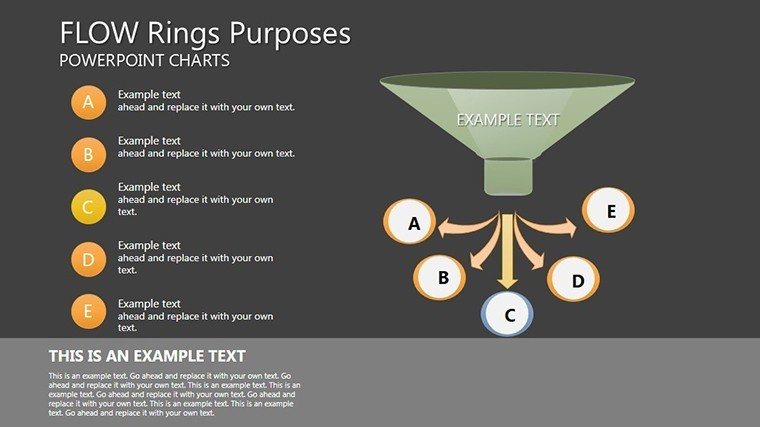
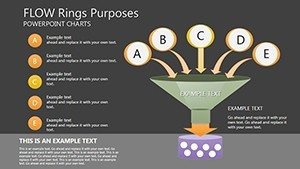
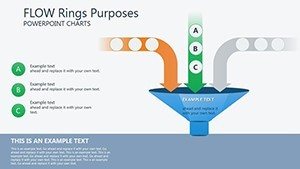
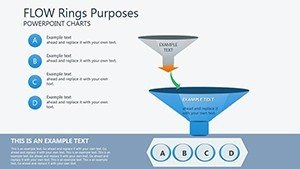
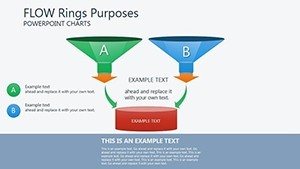
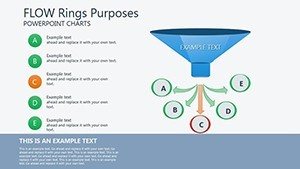
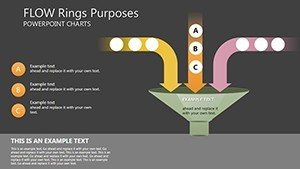
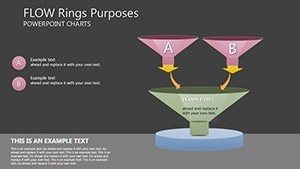
The 14 slides cover multiple funnel configurations: simple 3-stage funnels for basic pipeline overviews, complex 7-stage versions for detailed process mapping, horizontal orientations for timeline-based flows, and vertical layouts for traditional conversion analysis. Vector-based graphics ensure your charts remain crisp on any screen size, from laptop presentations to boardroom projection systems.
Color customization takes seconds - swap the default palette to match your brand guidelines or use contrasting colors to highlight problem areas in your funnel. Built-in placeholders accommodate stage labels, conversion percentages, volume metrics, and action items without breaking the visual layout.
Professional Applications Across Departments
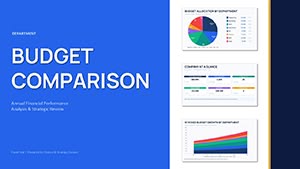
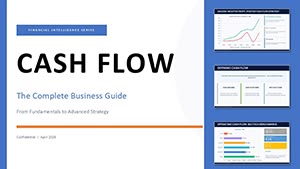
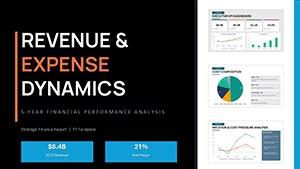
In board meetings, executives use flow funnels to report on sales performance, showing how lead quality impacts close rates. HR teams present recruitment funnels that track candidates from application through offer acceptance. Finance departments illustrate budget allocation flowing from annual planning down to departmental execution.
During strategy sessions, I've watched teams use these charts to debate resource allocation - the visual immediately shows where investment produces the biggest impact versus where you're losing momentum. The funnel shape makes it intuitive: wider sections need more support, narrow sections indicate efficiency or potential problems.
Editing Workflow for Quick Customization
Open the template and select the funnel configuration matching your process complexity. Click any text box to update stage names - "Awareness," "Consideration," "Decision," or whatever terminology fits your business. Add your conversion metrics or volume numbers directly into the pre-formatted fields.
Adjust colors by selecting funnel segments and choosing from your brand palette or PowerPoint's color picker. If your process has more or fewer stages, duplicate or remove rings as needed - all elements are fully ungrouped for granular control. Apply subtle gradient fills to add depth, or keep it flat for modern minimalist aesthetics.
Comparison: When to Use Each Funnel Type
| Funnel Type | Best For | Audience |
|---|---|---|
| 3-Stage Vertical | Simple pipeline overview, high-level metrics | Executives, board members |
| 5-Stage Detailed | Complete customer journey mapping | Marketing teams, product managers |
| Horizontal Flow | Time-based process tracking | Operations, project management |
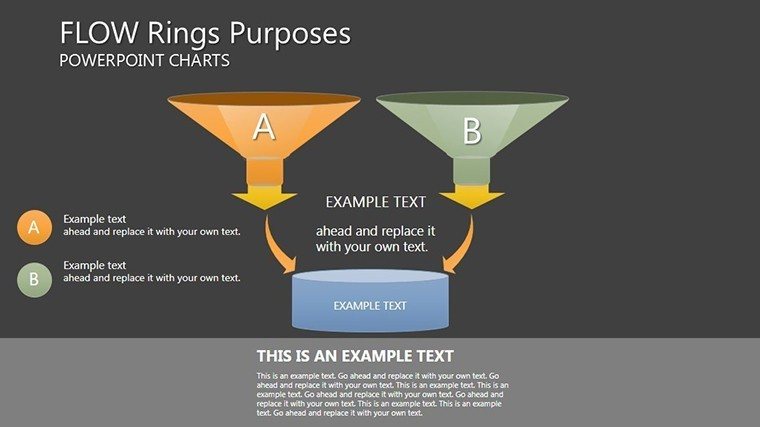
| Multi-Layer Funnel | Comparing parallel processes or segments | Strategy sessions, comparative analysis |
Industry-Specific Use Cases
SaaS companies track freemium-to-paid conversion funnels, showing where trial users churn. E-commerce businesses map checkout flows to reduce cart abandonment. Healthcare organizations illustrate patient care pathways from initial contact through treatment completion. Educational institutions visualize enrollment funnels from inquiry through matriculation.
Real estate firms use funnels to track leads from open houses to closings. Consulting practices map client engagement from proposal through contract renewal. Manufacturing operations show production flows highlighting quality control checkpoints and yield rates at each stage.
Download and Start Visualizing Your Processes
Stop struggling with generic shapes and inconsistent formatting. Download this flow funnel template and turn your process data into presentations that drive decisions.
Frequently Asked Questions
When should I use a flow funnel instead of a bar chart or line graph?
Flow funnels work best when showing progressive volume reduction through sequential stages - like conversion rates or process attrition. Use them when the narrowing shape reinforces your message about filtering, qualification, or selection. Choose bar charts when comparing discrete categories without sequential relationship, or line graphs when tracking changes over continuous time periods.
Can I customize the number of stages in the funnel?
Yes, all funnel elements are fully editable vector shapes. Select any stage ring and duplicate it to add more levels, or delete stages to simplify the funnel. Adjust the width of each stage by dragging corner handles to reflect your actual conversion rates or volume changes. The template accommodates anywhere from 3 to 8 stages comfortably.
How do executives typically respond to funnel visualizations?
Leadership teams appreciate funnels because the visual metaphor is instantly recognizable - everyone understands that wide-to-narrow progression. They quickly identify problem stages where the drop-off is steeper than expected and ask focused questions about those specific bottlenecks. The format naturally drives strategic conversations about resource allocation and process improvement.
What data should I include in each funnel stage?
Each stage should show the stage name, volume or count at that level, and ideally the conversion rate to the next stage. For sales funnels, include dollar values or deal counts. For marketing funnels, show visitor counts and percentage drop-off. Label problem areas clearly and use contrasting colors to highlight stages requiring attention.
Are these slides compatible with Google Slides and Keynote?
The template is designed for PowerPoint but can be imported into Google Slides with full editing capability. When uploading to Google Slides, fonts may substitute to Google's library, and some gradient effects might simplify, but core functionality and layout remain intact. For Keynote, import as PowerPoint format and verify custom fonts are available on your Mac.