Promotion Market PowerPoint Charts Template: Drive Marketing Success


Type: PowerPoint Charts template
Category: Cycle, Business Models, Pie, Arrows
Sources Available: .pptx
Product ID: PC00076
Template incl.: 16 editable slides
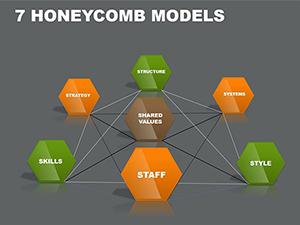
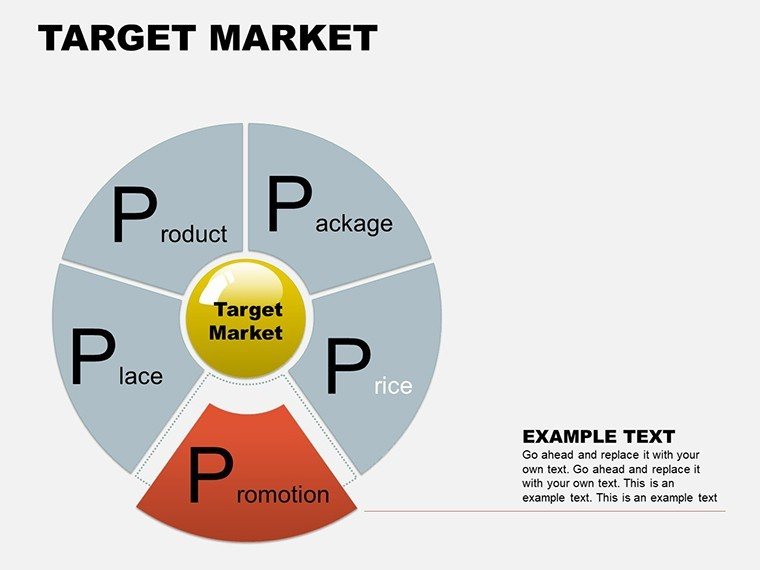
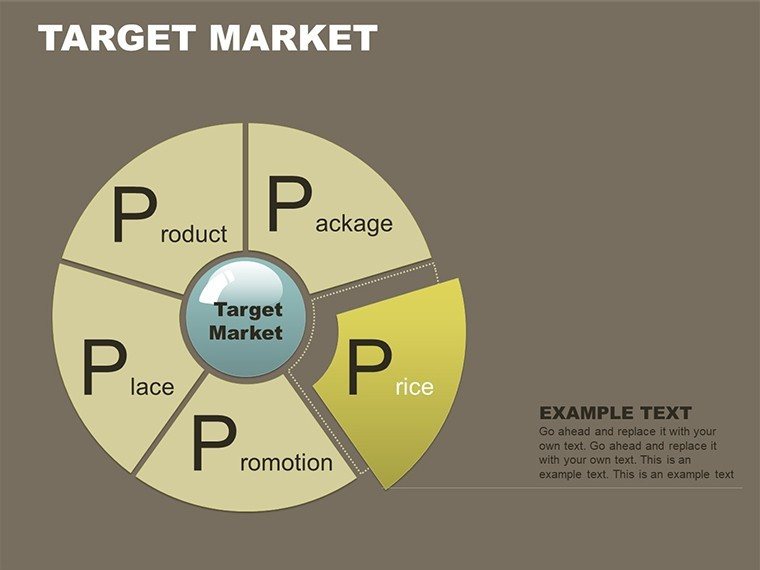
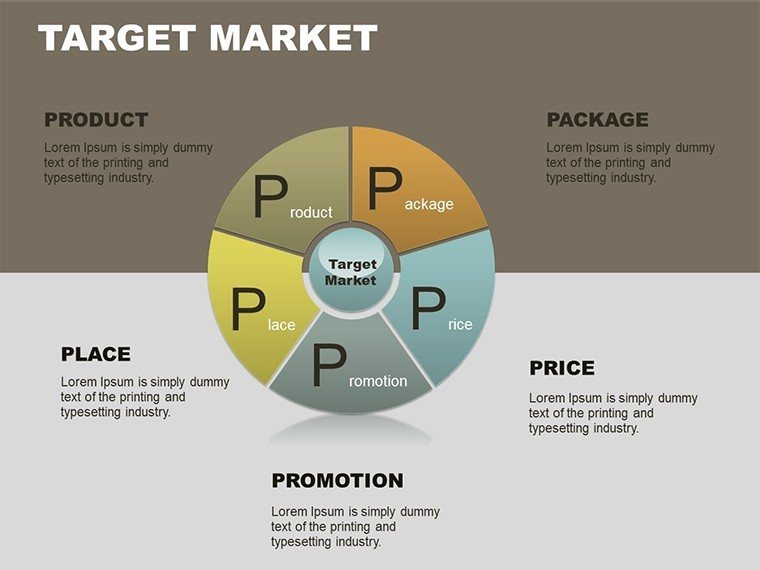
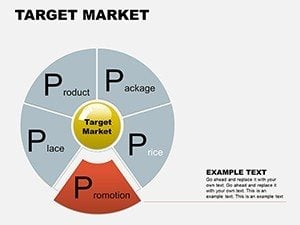
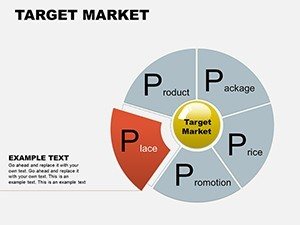
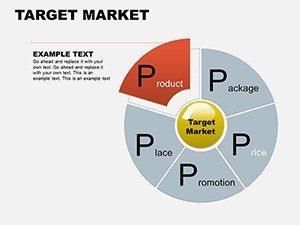
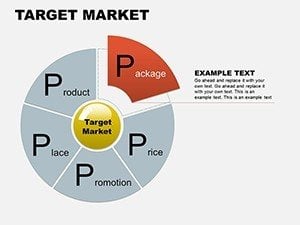
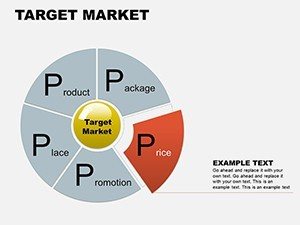
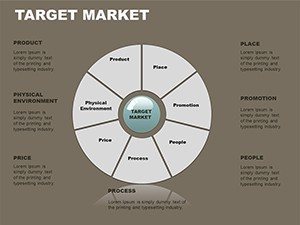
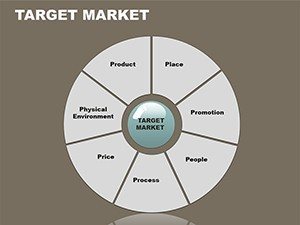
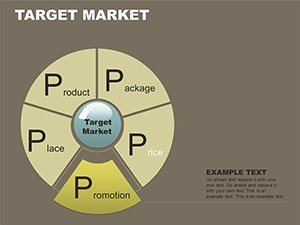
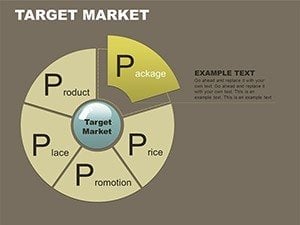
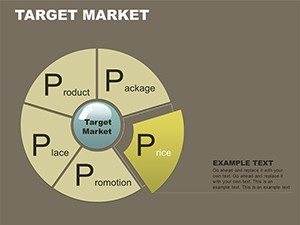
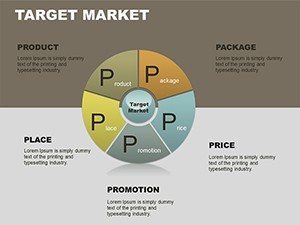
In the competitive realm of marketing, effectively targeting consumer groups can propel your campaigns to new heights. Our Promotion Market PowerPoint Charts Template provides 16 editable slides to graphically depict data dependencies and market segments, ideal for marketers, strategists, and business developers. Visualize how promotions influence sales or how audience behaviors interlink, turning insights into actionable plans. This template makes complex relationships clear, enhancing your ability to craft compelling narratives that resonate with stakeholders.
Rooted in digital marketing diagrams like flow charts for content strategies, it offers tools for precise visualization.
Core Features for Marketing Mastery
The template excels in functionality, with high-quality animations and editable elements that bring your data to life.
- Animation Capabilities: Create engaging transitions to highlight promotional flows.
- Quality Visuals: Crisp images and text for professional polish.
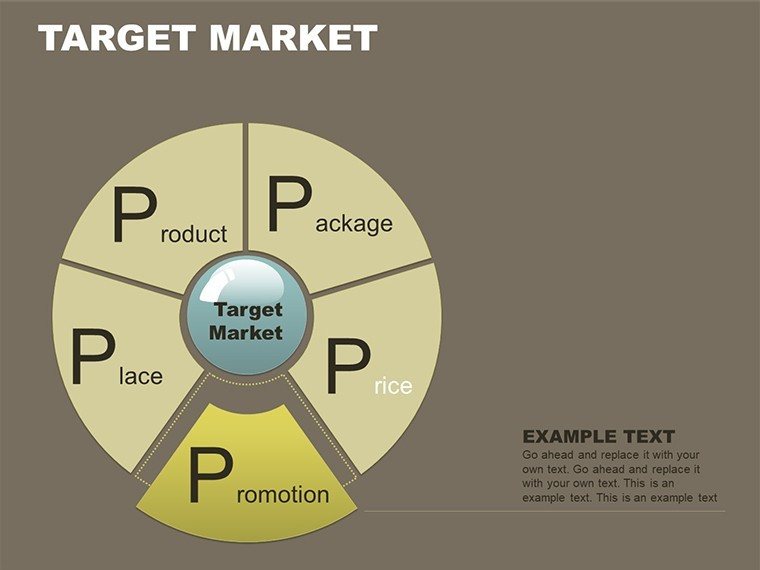
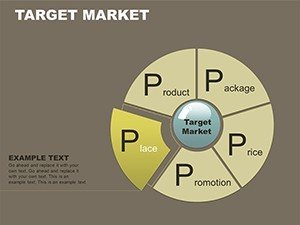
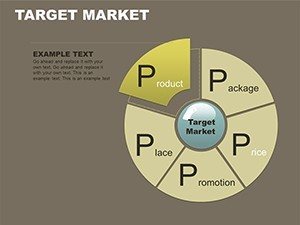
- Full Editability: Change colors, text, and insert media easily.
- Expanded Options: Add videos or audio for immersive presentations.
These align with top marketing charts used in presentations for conveying strategies.
Use Cases in Marketing Contexts
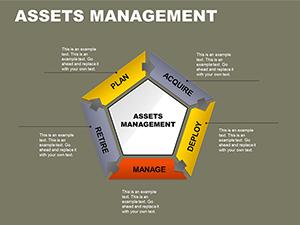
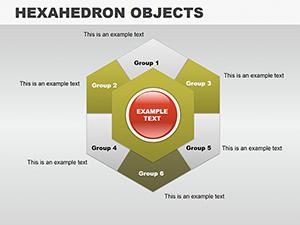
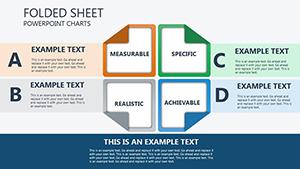
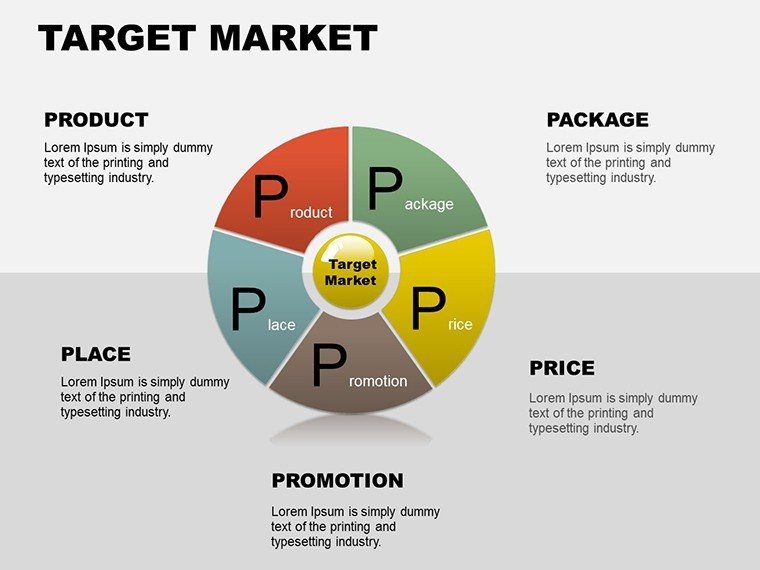
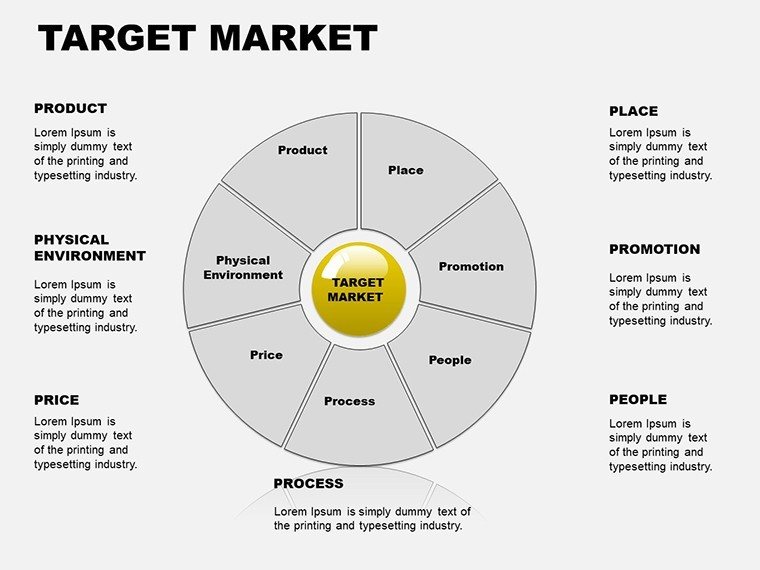
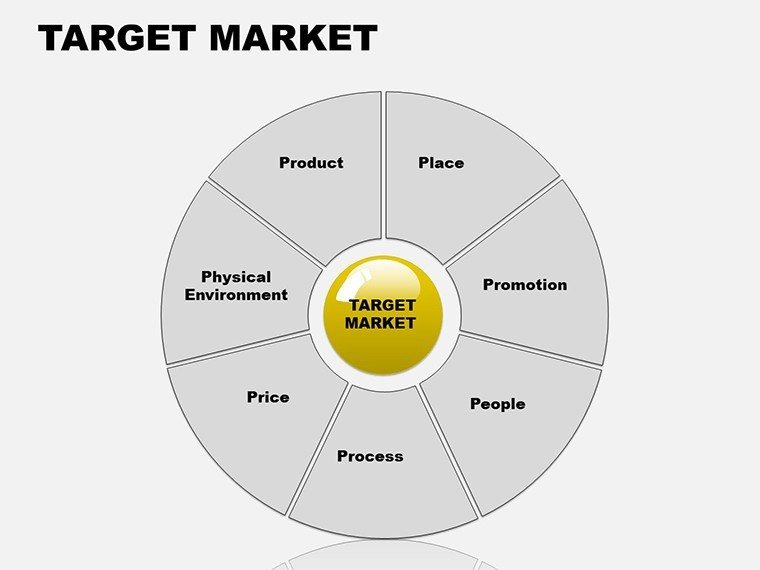
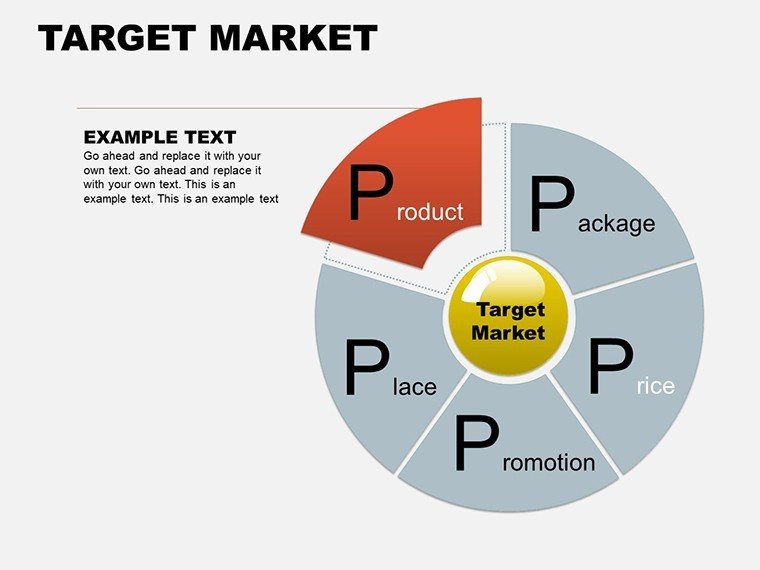
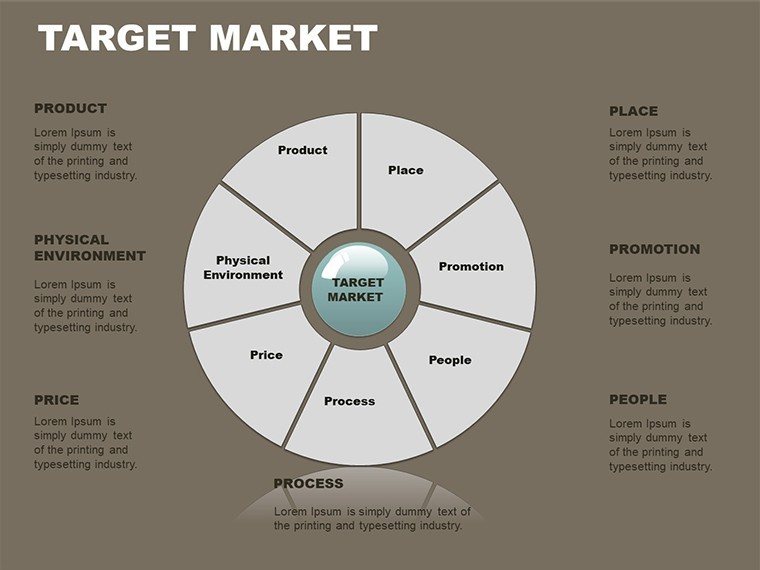
For a product launch, use Slide 1 to pie-chart market segments, showing promotion targets. Slides 7-12 could arrow diagrams illustrating campaign flows, from awareness to conversion.
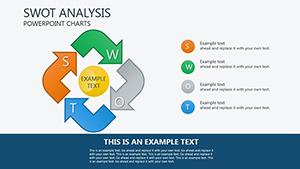
In a case study, a brand leveraged similar charts in their strategy deck, boosting engagement by 25%. For reports, depict data correlations, like ad spend vs. ROI.
Process: Select slide, input metrics, customize visuals, add effects, and deliver. Surpasses basic tools with marketing-specific layouts.
Tips from Marketing Experts
Use cycle charts for recurring promotions, as in ultimate guides to marketing presentations.
Its advantage? Dynamic elements that keep audiences hooked, unlike static slides.
Amplify Your Marketing Efforts
With 16 slides focused on promotion dynamics, this template empowers your strategies.
Elevate your game - customize now and watch your markets respond.
FAQ
- How do I add animations?
- Built-in tools let you apply and tweak effects effortlessly.
- Is it for marketing only?
- Primarily, but versatile for business models too.
- Can I insert videos?
- Yes, expand slides with multimedia elements.
- What file format?
- .pptx for easy PowerPoint use.
- Who benefits most?
- Marketers and strategists targeting consumers.
- How editable is the text?
- Fully, for complete personalization.