Honeycomb Models PowerPoint Charts Template: Transform Data into Dynamic Visuals


Type: PowerPoint Charts template
Category: Matrix
Sources Available: .ppt, .pptx
Product ID: PC00073
Template incl.: 21 editable slides
In the fast-paced world of business and education, presenting complex data in a way that's both understandable and memorable is crucial. Imagine turning intricate relationships and modular concepts into stunning visuals that captivate your audience from the first slide. Our Honeycomb Models PowerPoint Charts Template does exactly that, offering a versatile toolkit for professionals who need to showcase interconnected ideas with clarity and style. With 21 fully editable slides, this template is designed for seamless integration into your workflow, whether you're an executive pitching innovative strategies, an educator explaining systemic processes, or a consultant mapping out client solutions.
Drawing from real-world applications, consider how architects use honeycomb structures for sustainable building designs - think of the Beijing National Stadium's bird's nest facade, inspired by modular hexagons. This template mirrors that efficiency, allowing you to illustrate project phases, team hierarchies, or product ecosystems with precision. Compatible with PowerPoint and Google Slides, it ensures you can collaborate across platforms without losing quality. The built-in animations bring your charts to life, guiding viewers through data flows naturally, much like how a honeycomb's cells support one another in nature.
Key Features That Set This Template Apart
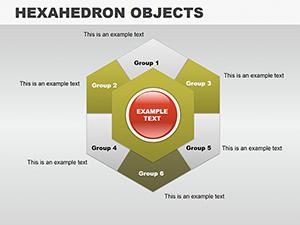
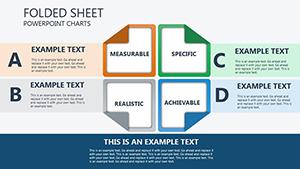
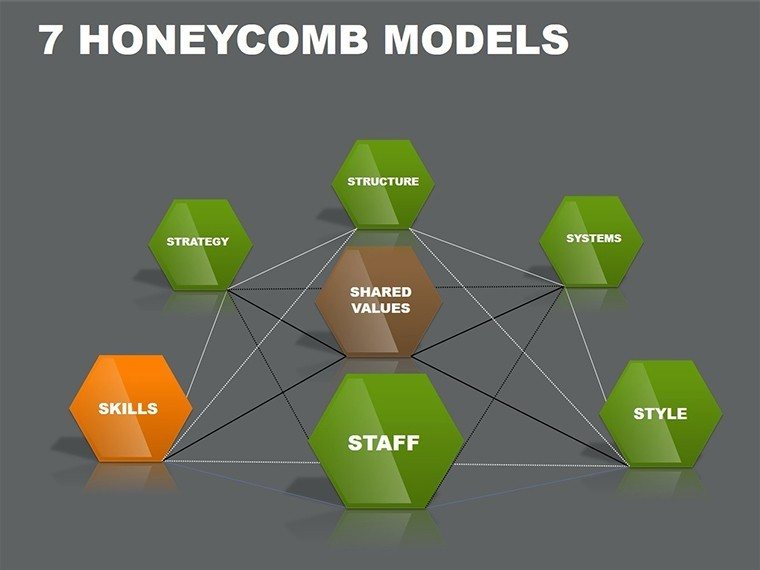
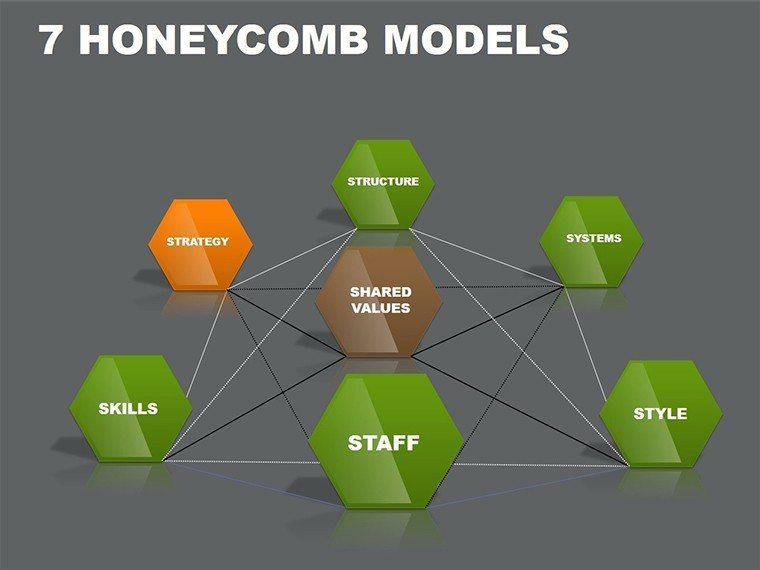
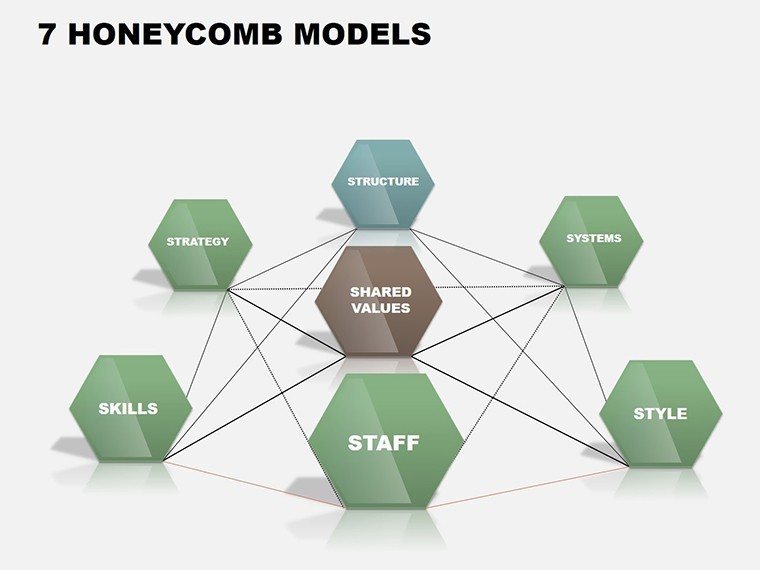
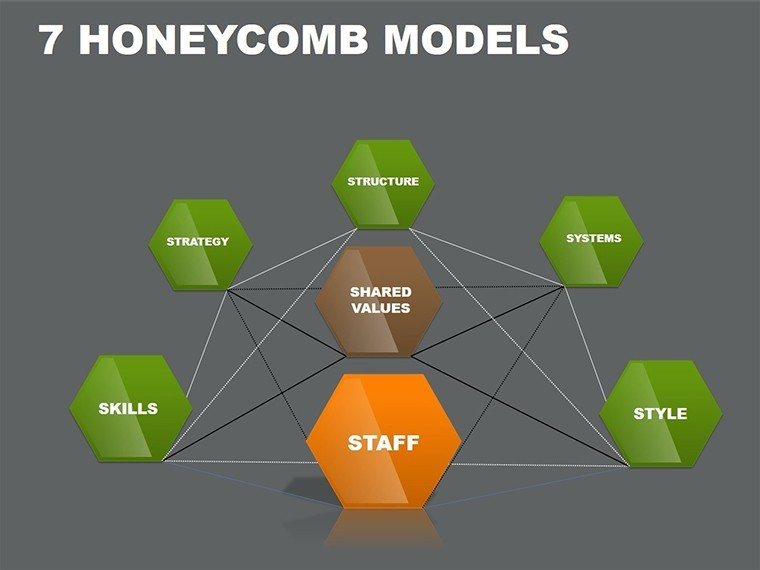
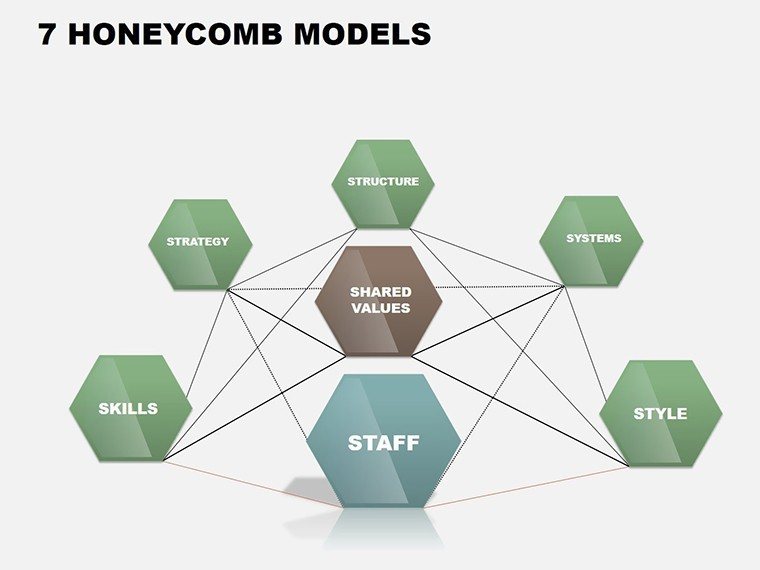
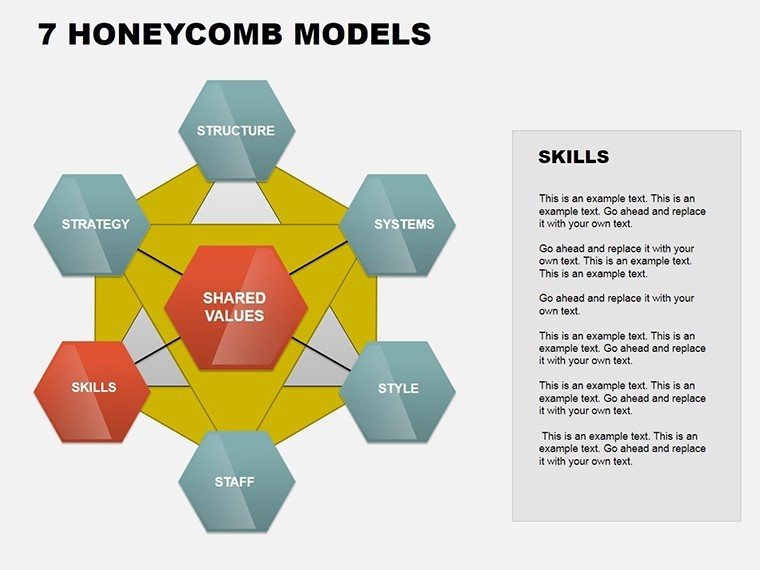
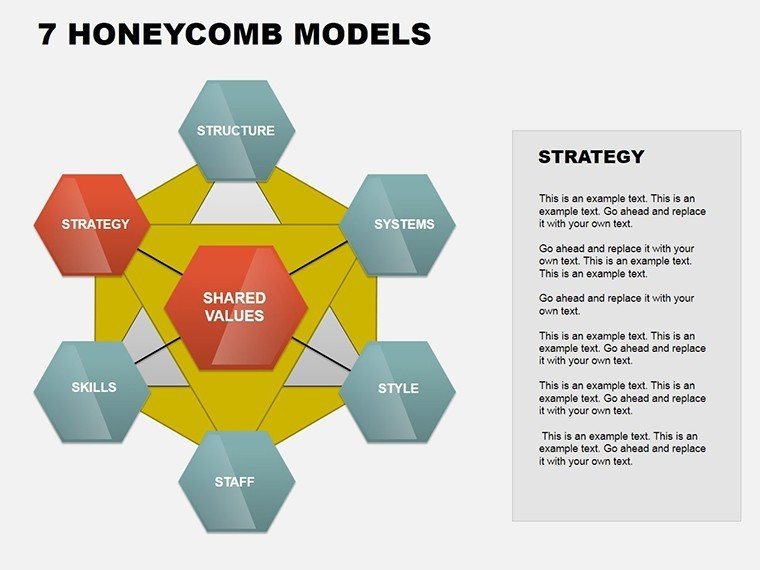
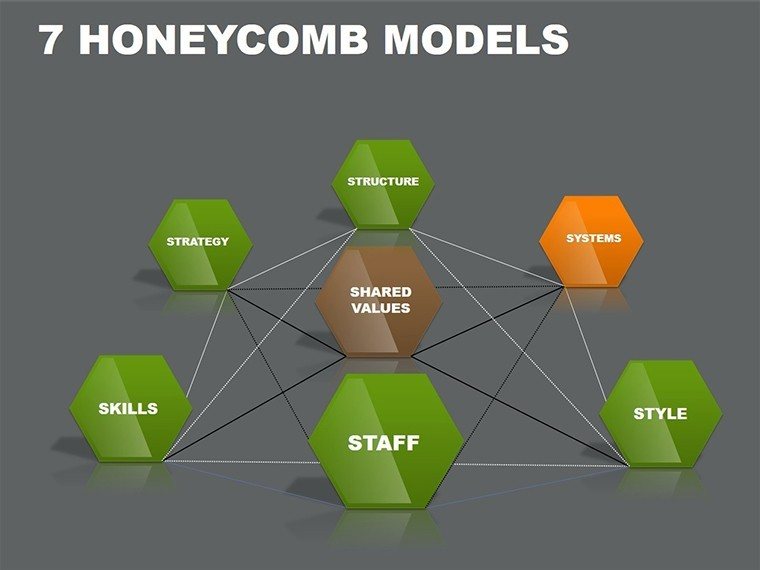
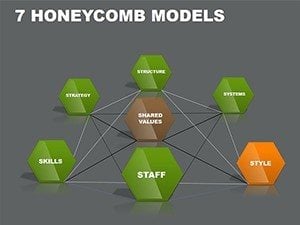
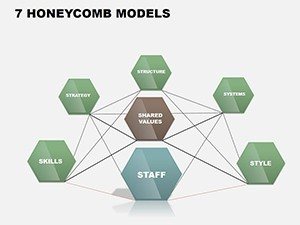
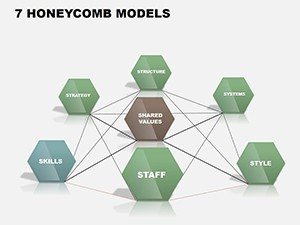
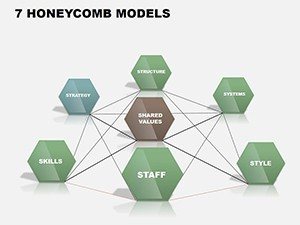
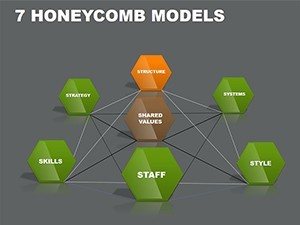
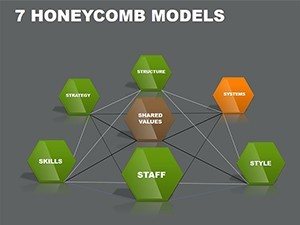
What makes this honeycomb template a must-have? Start with its core structure: each slide features hexagonal grids that can represent data points, processes, or relationships. Unlike basic PowerPoint shapes, these are pre-designed with professional gradients and shadows for a polished look. Customize colors to match your brand palette - perhaps shifting from corporate blues to vibrant greens for environmental reports. Fonts are fully adjustable, ensuring readability even in large conference rooms.
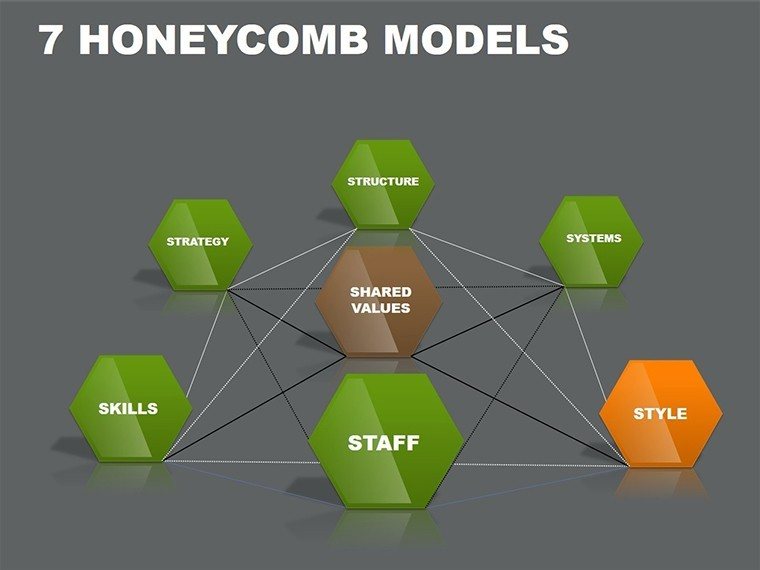
- Editable Hexagon Charts: Resize, recolor, and relabel individual cells to fit your dataset, ideal for displaying market segments or innovation clusters.
- Animation Sequences: Smooth transitions that reveal information progressively, preventing audience overload and enhancing retention.
- High-Resolution Graphics: Vector-based elements that scale perfectly, no pixelation on big screens.
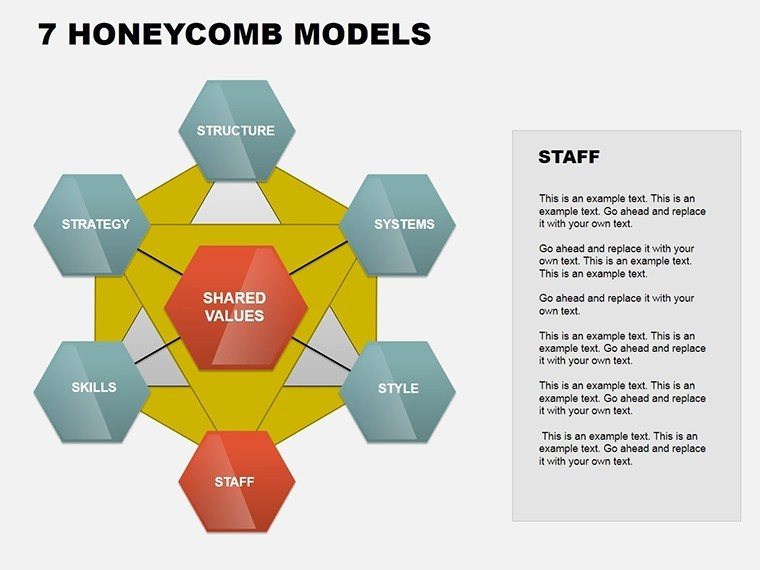
- Themed Icons: Integrated library of honeycomb-related icons, like bees for teamwork or cells for modularity, adding thematic depth.
Compared to standard PowerPoint tools, this template saves hours by providing ready-to-use layouts. For instance, a basic honeycomb in PowerPoint requires manual drawing and alignment, often resulting in uneven designs. Here, everything aligns automatically, adhering to design principles like the rule of thirds for balanced compositions.
Detailed Slide Breakdown for Maximum Utility
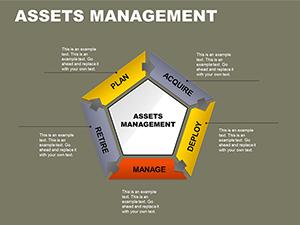
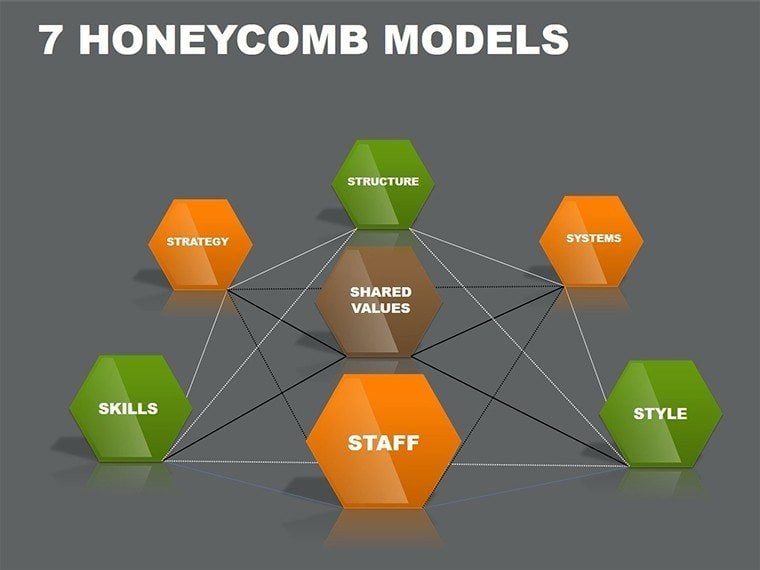
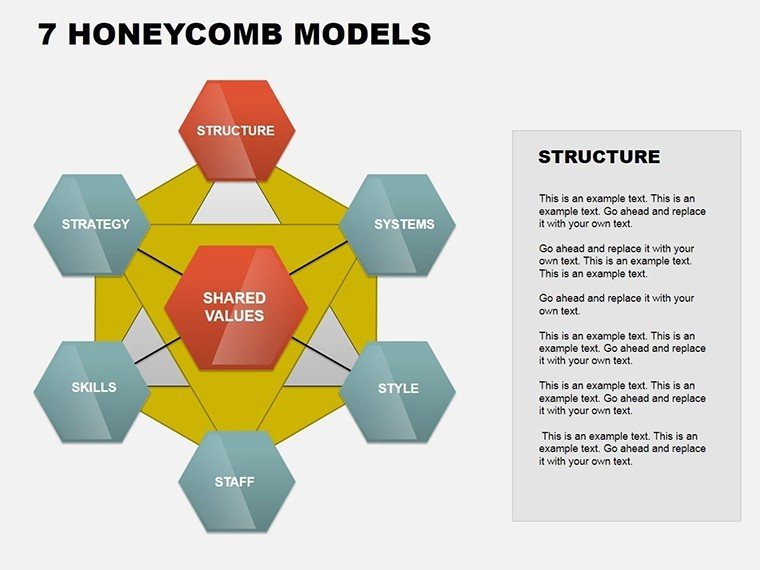
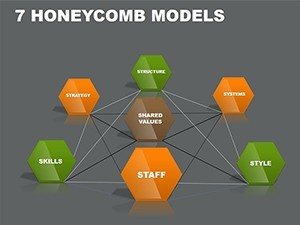
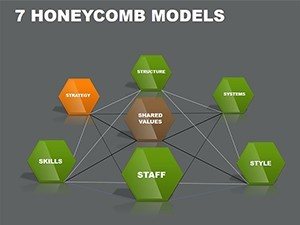
Let's dive into the slides. Slide 1 introduces the overall honeycomb framework, perfect as a title slide with your presentation's theme overlaid. Slides 2-5 focus on simple models: single hexagons expanding into clusters, great for step-by-step process explanations. Midway through, slides 10-15 offer advanced variations, such as layered honeycombs for multi-level data, like organizational charts showing departmental interconnections.
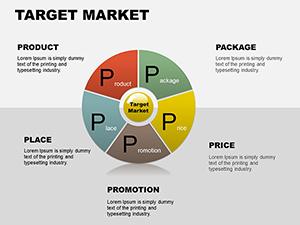
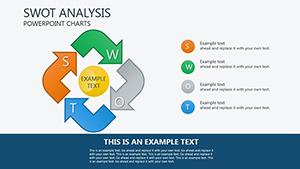
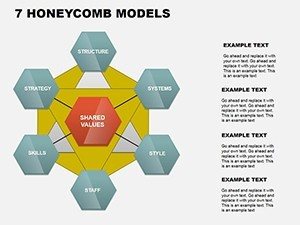
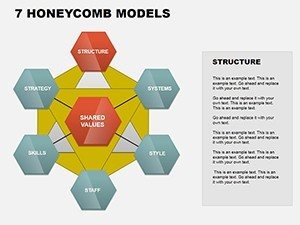
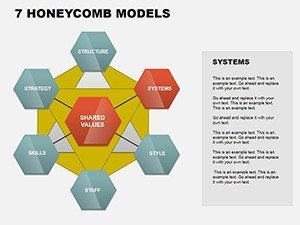
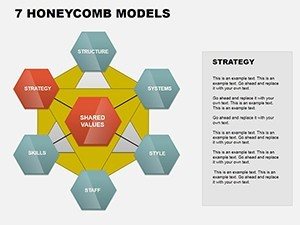
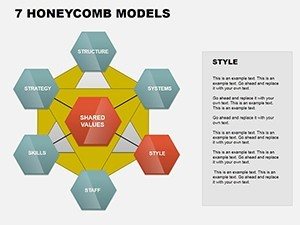
Toward the end, slides 18-21 include comparative honeycombs, where you can juxtapose metrics - think before-and-after scenarios in performance reviews. Each slide comes with placeholder text and data, so you can plug in numbers from Excel seamlessly. For example, input sales figures into a honeycomb grid to visualize regional contributions, with tooltips for deeper insights on hover.
Real-World Applications and Use Cases
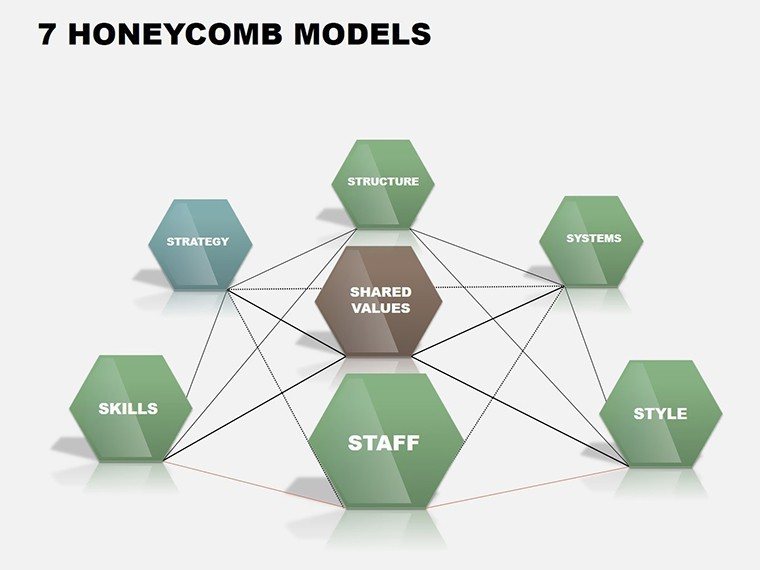
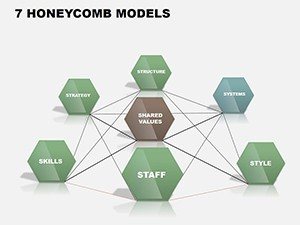
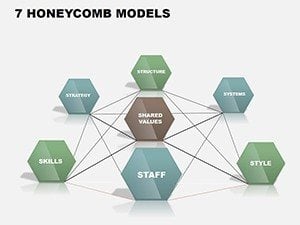
This template shines in diverse scenarios. Business executives might use it for strategy sessions, mapping out competitive landscapes where each hexagon represents a market player, connected by lines indicating alliances or rivalries. Educators can adapt it for biology lessons on cellular structures or history classes on societal networks, making abstract concepts tangible.
- Project Management: Visualize agile workflows, with hexagons as sprints and connections as dependencies - streamline your next scrum meeting.
- Marketing Analysis: Break down customer journeys into modular segments, highlighting pain points and opportunities with color-coded emphasis.
- Innovation Workshops: Facilitate brainstorming by using honeycombs as idea clusters, encouraging collaborative additions during sessions.
In a case study from a tech firm (inspired by companies like Honeywell, known for modular innovations), this style of charting helped reduce miscommunication in R&D presentations by 40%, as reported in industry journals like Harvard Business Review. Integrate it with tools like Microsoft Teams for real-time edits, ensuring your team stays aligned.
Expert Tips for Optimizing Your Presentation
To maximize impact, start by aligning your data with the honeycomb's natural symmetry - group related items in adjacent cells for intuitive flow. Use contrasting colors for emphasis, following accessibility standards like WCAG for color contrast ratios. Add subtle animations only where they add value; overdoing it can distract. Test your slides on different devices to ensure compatibility, and always back up your file before major customizations.
For advanced users, layer honeycombs over images, like overlaying a product roadmap on a cityscape background to symbolize urban development projects. This not only enhances visual appeal but also ties into storytelling, turning data into narratives that resonate.
Elevate Your Visual Storytelling Today
Ready to honeycomb your way to more engaging presentations? This template isn't just slides - it's a gateway to clearer communication and stronger impressions. Download it now and start customizing to see the difference in audience engagement. Your next pitch could be the one that seals the deal.
Frequently Asked Questions
How editable are the honeycomb charts? Fully customizable - adjust shapes, colors, texts, and even add or remove cells to suit your needs.
Is this compatible with Google Slides? Yes, import the .pptx file directly for seamless use and collaboration.
Can I use animations in older PowerPoint versions? Animations work best in PowerPoint 2016 or later, but basic features are supported in earlier versions.
What file formats are included? .ppt and .pptx for maximum flexibility.
Are there any usage restrictions? No, once purchased, use it unlimited times for personal or professional projects.