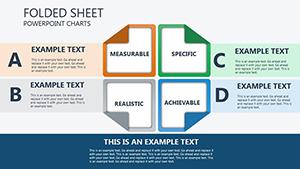
Assets Management PowerPoint Charts Template: Master Financial Visualization


Type: PowerPoint Charts template
Category: Matrix, Business Models
Sources Available: .ppt, .pptx
Product ID: PC00074
Template incl.: 16 editable slides
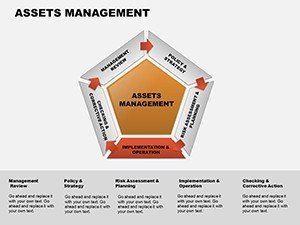
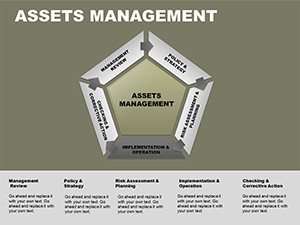
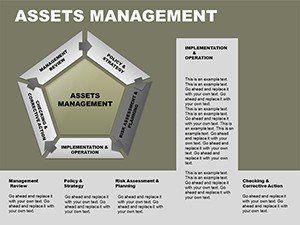
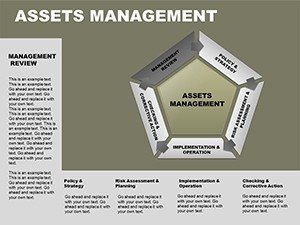
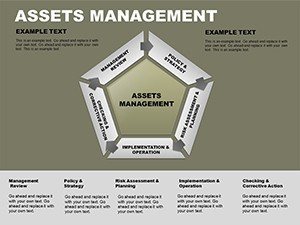
Navigating the complexities of assets management requires tools that simplify data while amplifying insights. Our Assets Management PowerPoint Charts Template delivers exactly that, with 16 meticulously crafted slides designed for financial analysts, business consultants, and managers. This template turns dense balance sheets and portfolio overviews into intuitive visuals, helping you communicate asset allocation, performance trends, and risk assessments with precision and flair. Whether you're preparing quarterly reports or strategic pitches, these charts ensure your audience grasps key metrics instantly, fostering better decision-making.
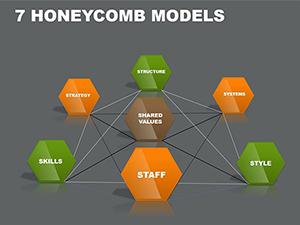
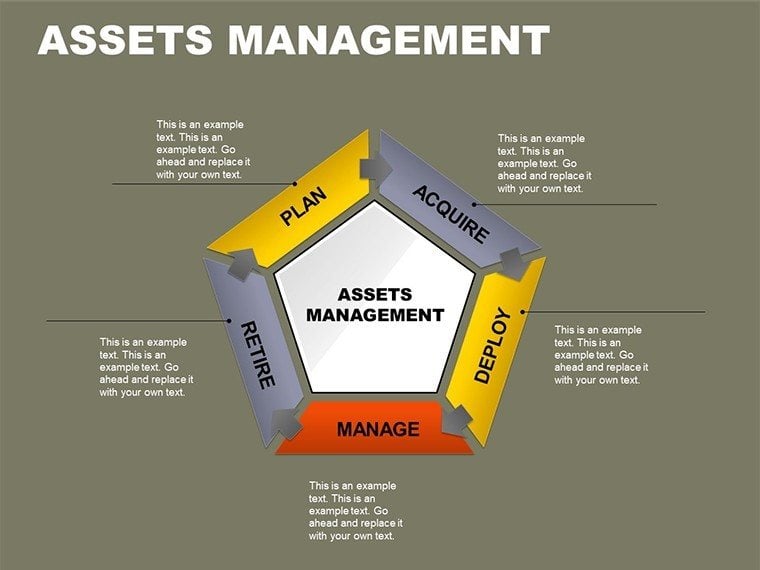
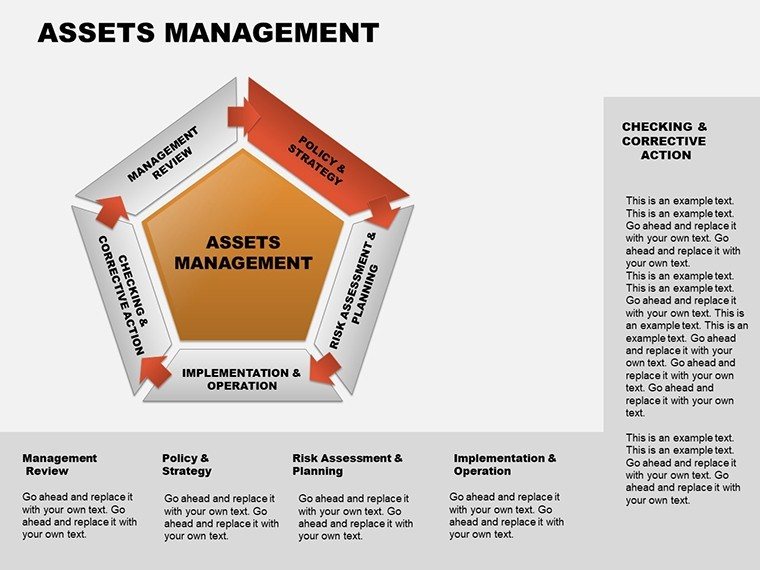
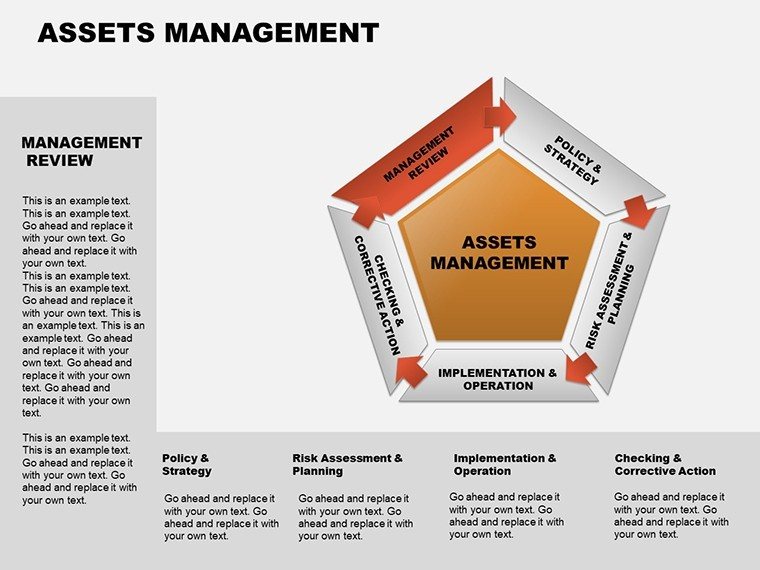
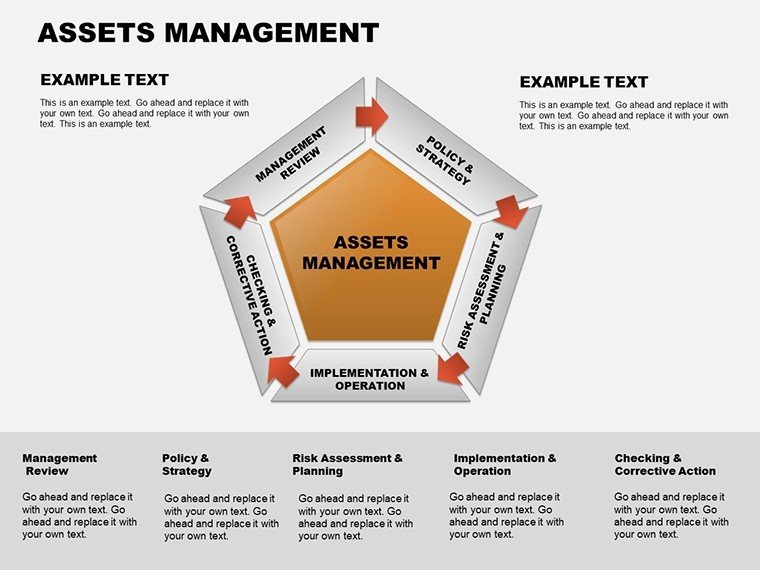
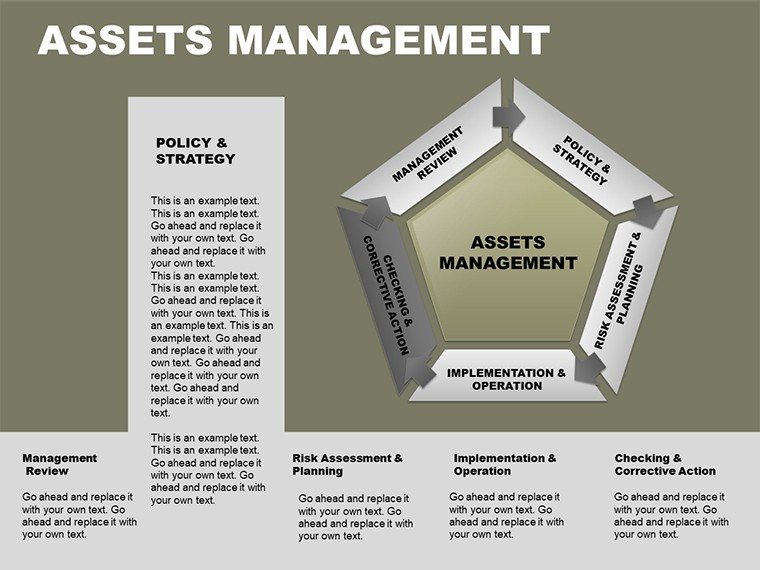
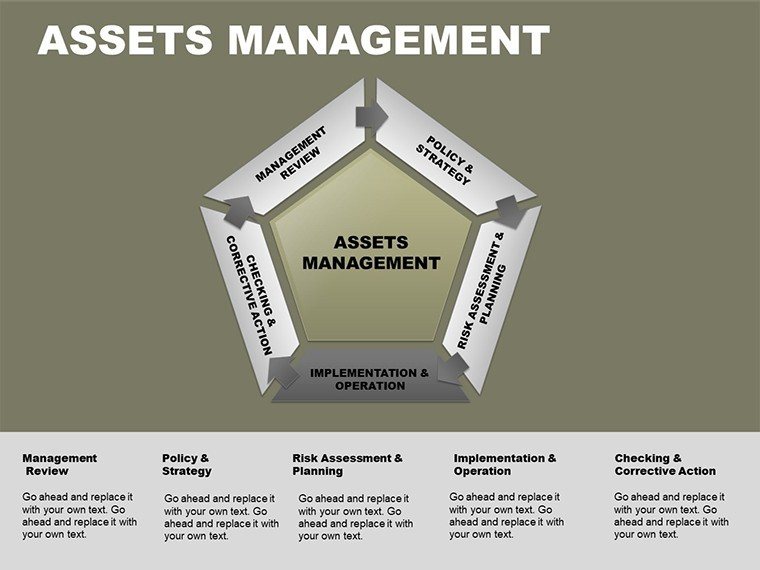
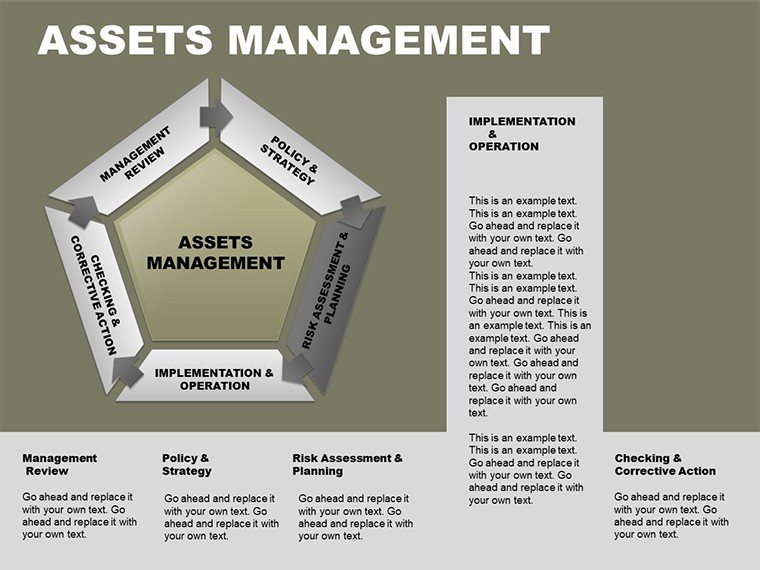
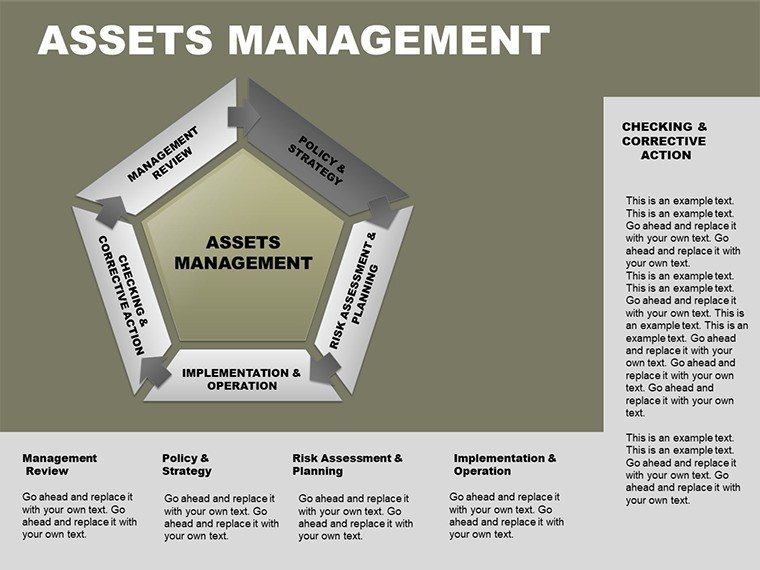
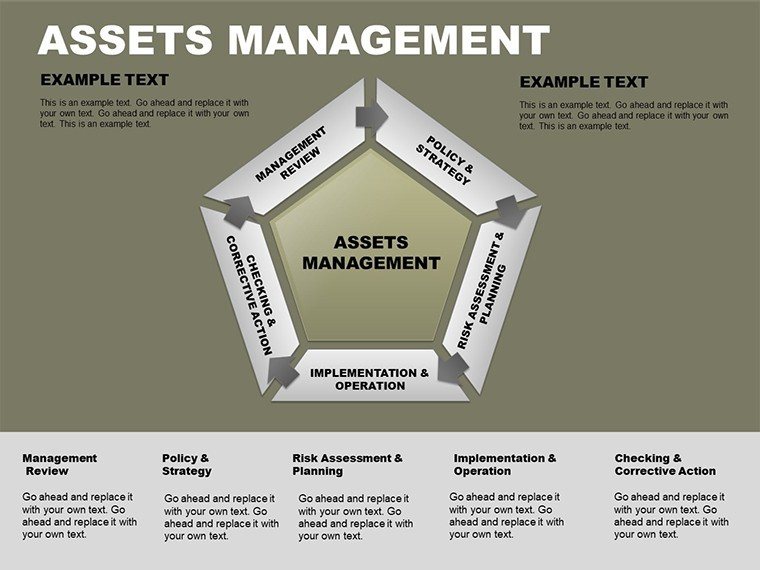
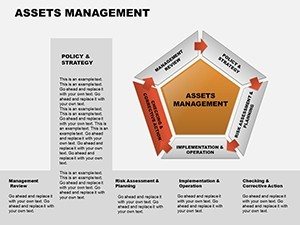
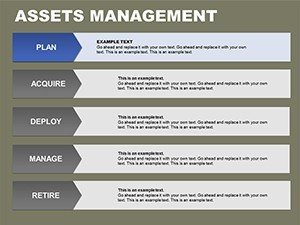
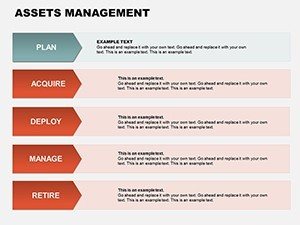
Built for real-world demands, this template draws inspiration from process flow diagrams used in global asset management, where stages like valuation and risk assessment are visualized clearly.
Essential Features for Financial Pros
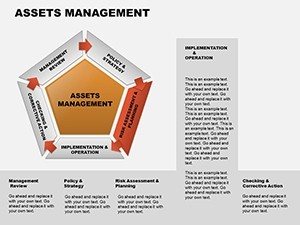
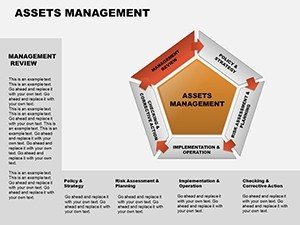
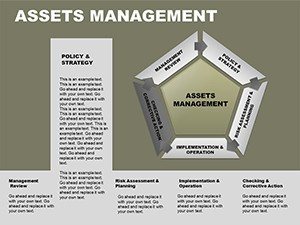
This template shines through its user-centric design, packed with features that cater to the nuances of assets management. Customization is at the core: edit data placeholders effortlessly, switch color schemes to align with corporate branding, and incorporate high-quality icons for added context.
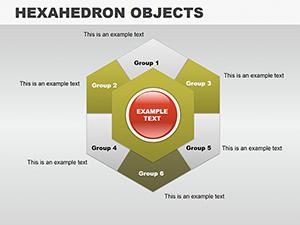
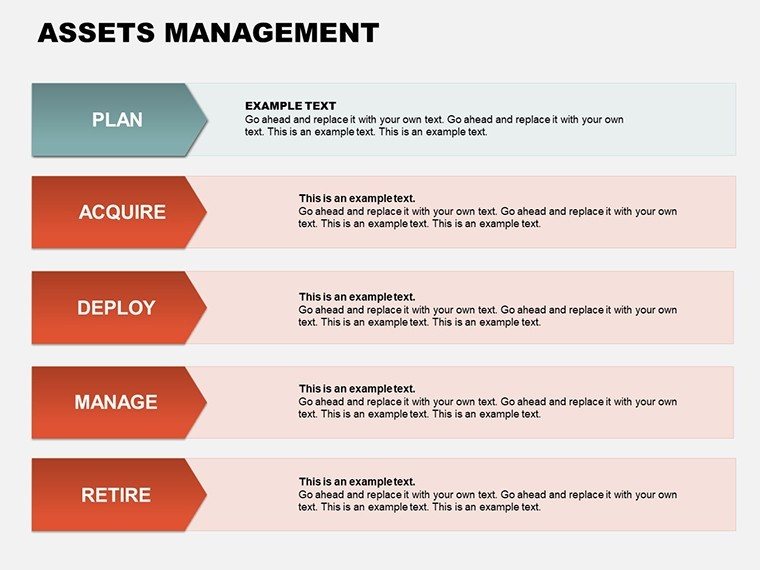
- Comprehensive Chart Variety: From flow diagrams to bar graphs, cover every aspect of asset tracking.
- Modern Graphics: Sleek visuals that maintain clarity even in complex datasets.
- Easy Edits: Drag-and-drop functionality for quick updates.
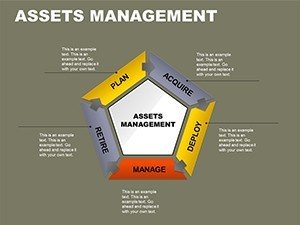
- Multiple Themes: Choose from professional palettes to suit different report tones.
These elements are grounded in best practices, similar to those in outsourcing transition plans where asset flows are diagrammed.
Use Cases Tailored to Business Needs
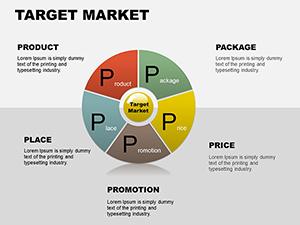
Envision a financial analyst using Slide 1 to outline asset allocation in a client meeting, with pie charts breaking down portfolios by category. Slides 6-10 could delve into performance timelines, using line charts to track returns over quarters. This structured approach not only organizes information but also highlights trends, like identifying underperforming assets for reallocation.
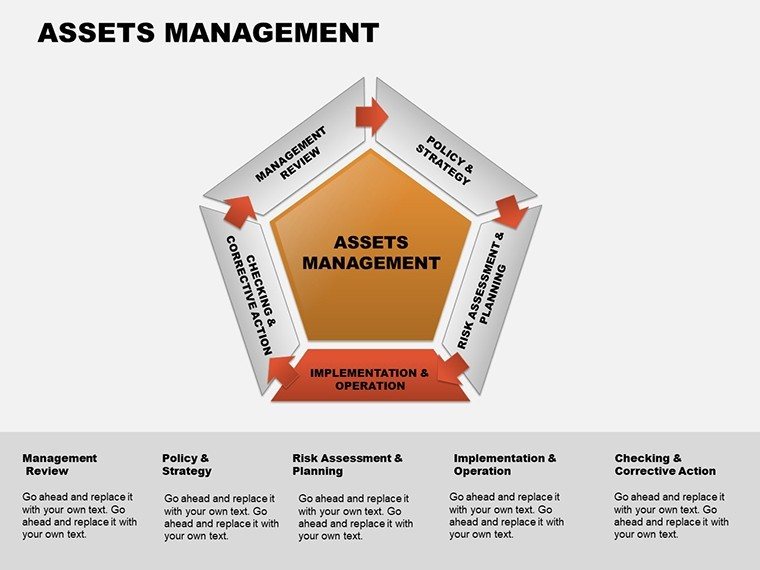
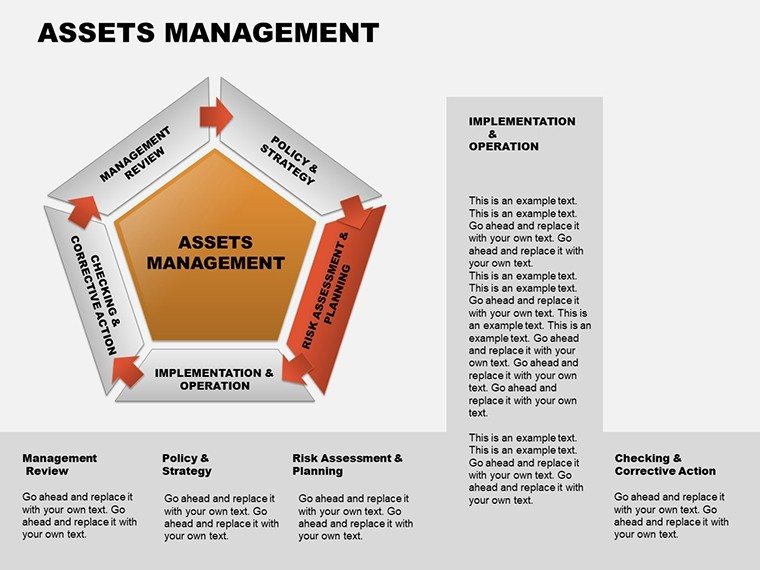
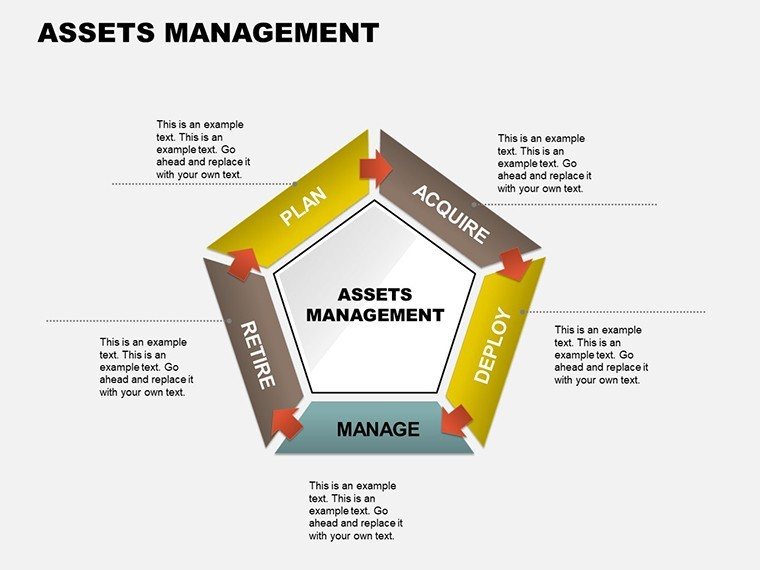
In corporate settings, managers employ these charts for internal audits, mapping processes from acquisition to disposal. A case in point: A mid-sized firm streamlined their enterprise asset management using similar flowcharts, reducing errors by 20% as per industry benchmarks. For pitch decks, consultants integrate these visuals to demonstrate value, showing how strategic asset management drives growth.
Step-by-step integration: Import your Excel data, select a chart type, customize labels, and apply filters for focus. This template outperforms basic PowerPoint tools by offering pre-optimized layouts, reducing design time while increasing visual impact.
Expert Tips for Maximum Impact
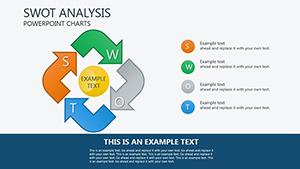
To enhance your presentations, use consistent color coding - greens for growth, reds for risks - as recommended in asset management complete decks.
Unlike generic charts that clutter slides, ours prioritize simplicity, making complex info accessible. This user-focused design helps you stand out in competitive environments.
Invest in Better Presentations Today
With 16 slides covering core assets management needs, this template is your gateway to more effective communication. Ideal for anyone in finance seeking to impress and inform, it's a smart addition to your toolkit.
Don't settle for ordinary - customize this template and transform your financial narratives. Secure your download now and lead with confidence.
FAQ
- What types of charts are included?
- A mix of flow diagrams, pie charts, and line graphs tailored for assets tracking and analysis.
- Can I link this to Excel data?
- Yes, dynamic links allow real-time updates from spreadsheets.
- Who is this template best for?
- Financial analysts, managers, and consultants handling reports and strategies.
- Are the slides fully editable?
- Completely, including graphics, text, and colors for full customization.