Free 6-Month Gantt Chart PowerPoint Template


Type: PowerPoint Charts template
Category: Free Templates
Sources Available: .pptx
Product ID: PC00067
Template incl.: 12 editable slides
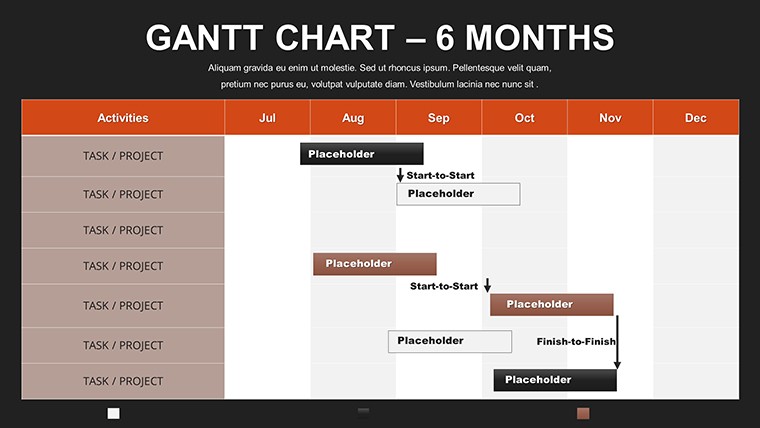
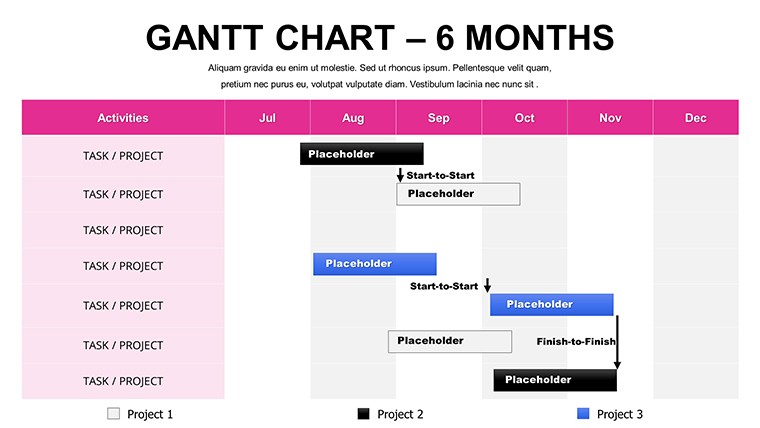
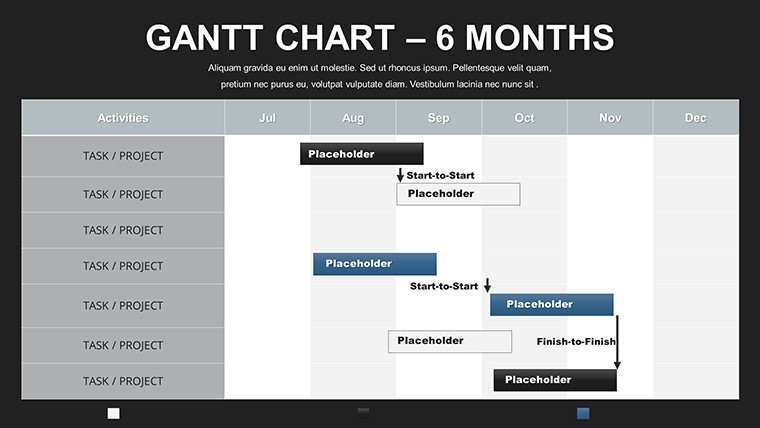
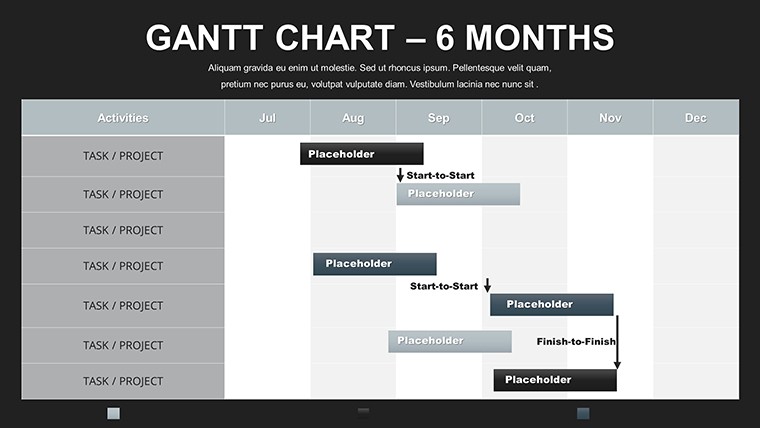
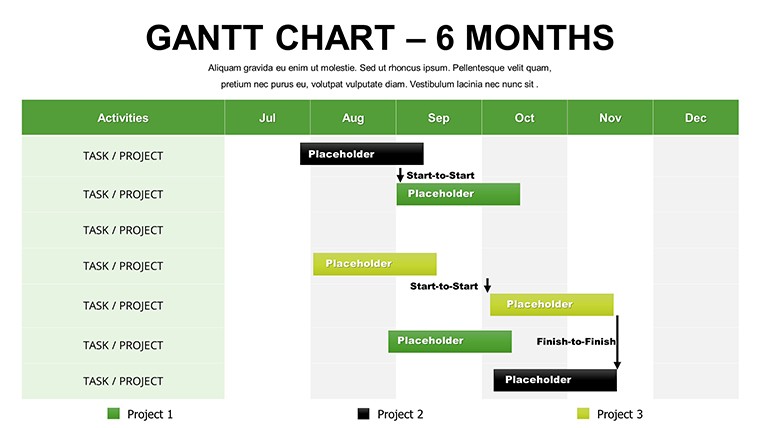
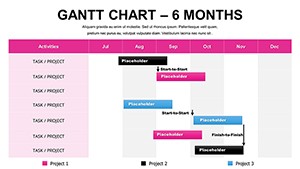
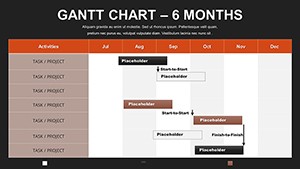
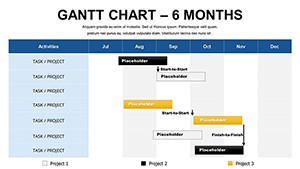
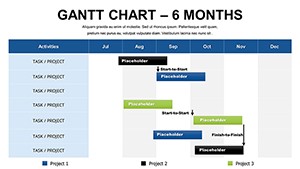
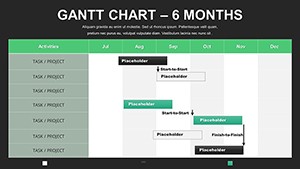
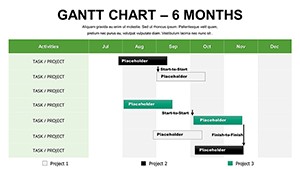
Spanning half a year, projects demand foresight and flexibility - enter our free 6-month Gantt chart PowerPoint template, your ally in long-range visualization. Boasting 12 editable slides, it's engineered for those charting extensive endeavors, from research initiatives to product rollouts. This isn't merely a charting tool; it's a strategic canvas that transforms abstract plans into tangible paths, helping teams anticipate challenges and celebrate milestones along the way.
Drawing on proven methodologies, the template facilitates risk identification and resource optimization, as highlighted in PMI's risk management frameworks. For event planners coordinating festivals, it could detail from vendor sourcing in Month 1 to post-event analysis in Month 6, ensuring seamless execution akin to successful cases at events like Coachella.
Core Features for Strategic Depth
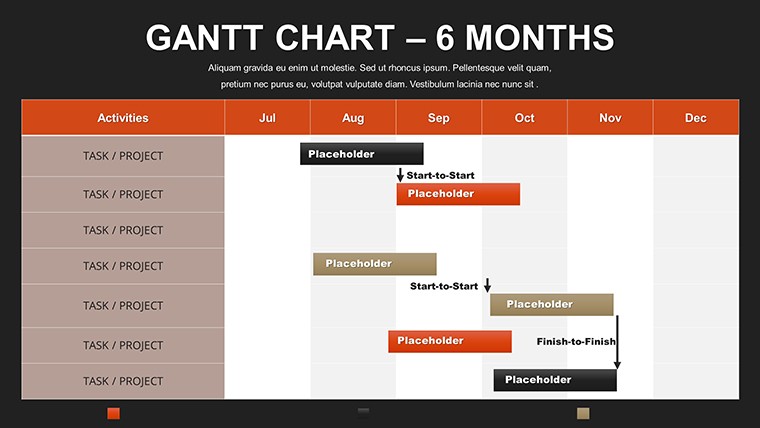
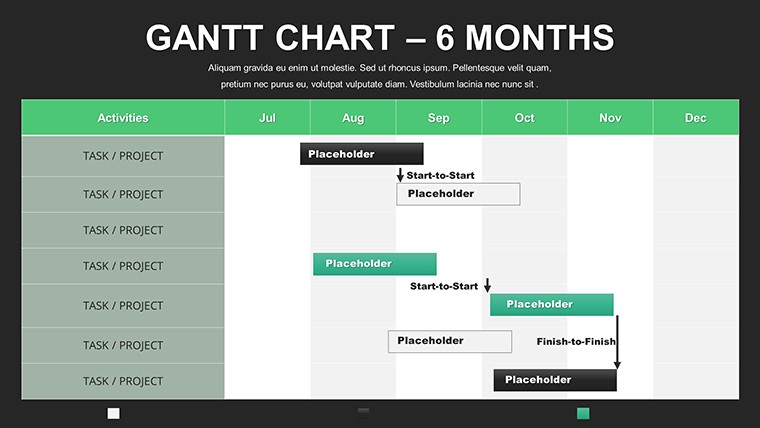
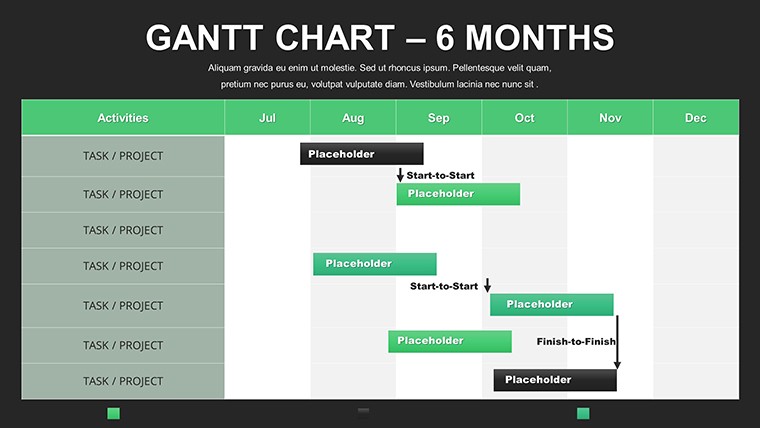
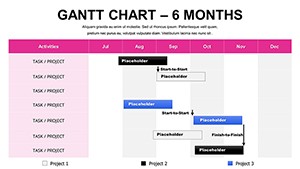
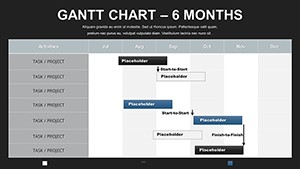
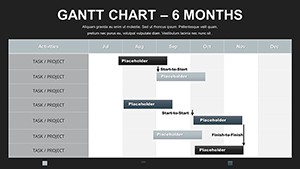
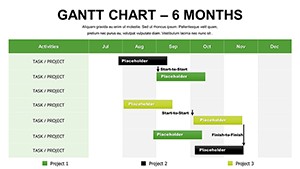
This template's strength lies in its robust features for 6-month horizons. Slides feature elongated Gantt bars with milestone diamonds, dependency chains, and progress sliders that update visually. Full customization extends to themes, where you can infuse elements like risk matrices or resource pie charts, enriching LSI coverage for comprehensive planning.
Ease of use is paramount - no design expertise needed; just populate and personalize. Outshining native PowerPoint by offering layered dependencies and auto-scaling, it's a time-saver. In research projects, scientists might use it to sequence experiments, data analysis, and publications, mirroring protocols from institutions like NIH for grant compliance.
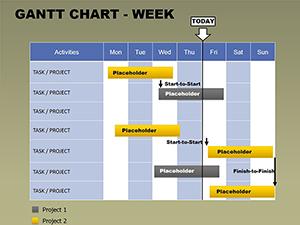
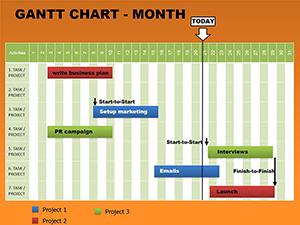
- Extended Timeline Views: Cover 6 months with granular weekly breakdowns.
- Risk Highlighting: Flag potential issues with color alerts and notes.
- Resource Allocation: Integrate charts showing team assignments over time.
- Custom Milestones: Add icons for key events, enhancing memorability.
These draw from authoritative sources, promoting best practices in visual project management.
Targeted Applications and Scenarios
Adaptability defines its use cases. Team leaders in marketing can plan campaigns, from concept in Month 1 to metrics review in Month 6, boosting ROI as per insights from Gartner reports. Freelancers track client deliverables across quarters, building portfolios with clear timelines.
For students, it's a boon for thesis planning, outlining literature reviews through defenses. The utilization guide is simple: Download, define scope, input elements, refine visuals, and iterate. This surpasses simplistic charts with its depth, fostering better decision-making.
- Acquire the template via instant download.
- Outline your 6-month objectives and tasks.
- Apply customizations for aesthetic and functional fit.
- Simulate scenarios to test dependencies.
- Deploy in meetings or reports for stakeholder buy-in.
Compatible with collaborative platforms, it enhances group dynamics.
Pro Tips for Optimal Utilization
Elevate your charts with expert advice: Employ buffer zones for uncertainties, inspired by critical chain methods. In product development, overlay competitor timelines for competitive analysis, drawing from strategies in "Blue Ocean Strategy."
Combine with budget trackers for holistic views, increasing trustworthiness. Reports indicate 30% better on-time delivery with such tools, per Project Management Journal studies. This template positions you as a forward-thinker.
Seize control of your 6-month visions - download this empowering Gantt template today and chart a course to achievement.
Frequently Asked Questions
- How does this handle project risks?
- Incorporate risk indicators and notes directly on the timeline for proactive management.
- Compatible with older PowerPoint versions?
- Yes, works with PowerPoint 2010 and later, with full features in newer editions.
- Can I scale it beyond 6 months?
- Easily extend by duplicating and adjusting slides for longer periods.
- Suitable for agile projects?
- Yes, adapt for sprints within the 6-month frame, supporting hybrid approaches.
- How to add team members?
- Use labels or integrated tables to assign and visualize responsibilities.