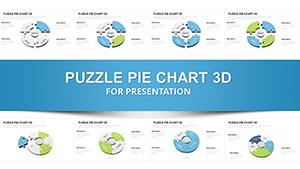
Editable PowerPoint Charts Template for Board Meetings - Fully Editable


X Diagrams Across Y Layouts: Full Contents
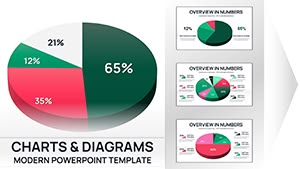
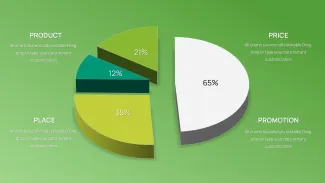
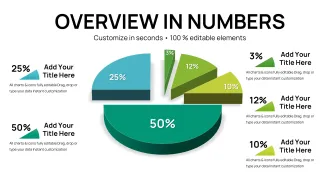
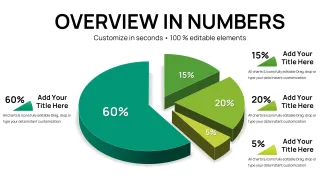
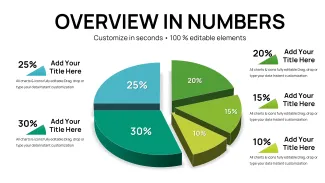
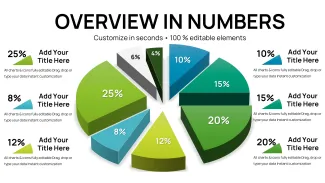
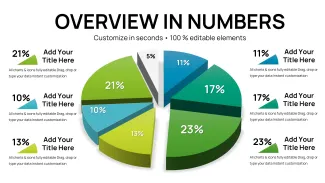
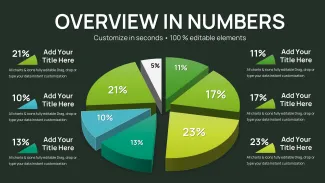
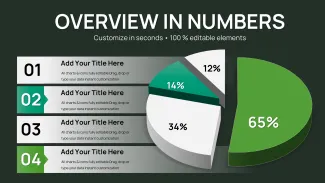
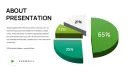
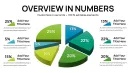
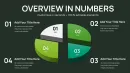
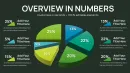
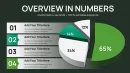
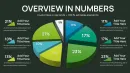
32 slides focus on pie and distribution charts designed for executive clarity. Every layout supports independent segment editing and the file maintains 16:9 aspect ratio.
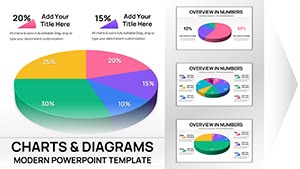
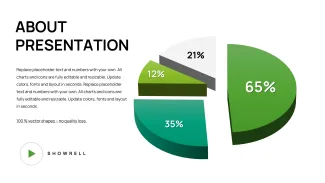
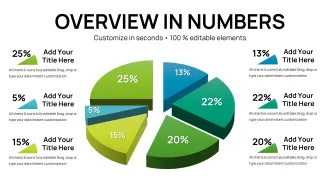
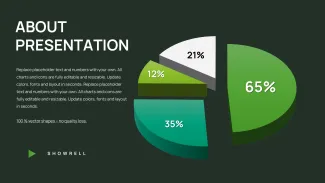
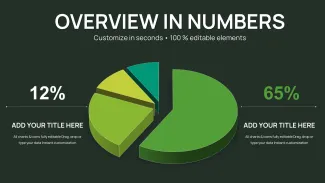
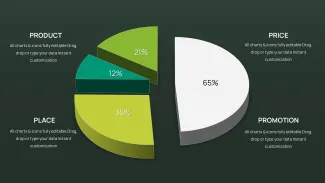
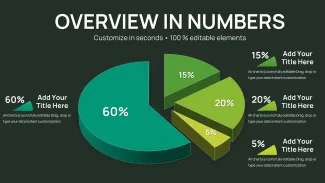
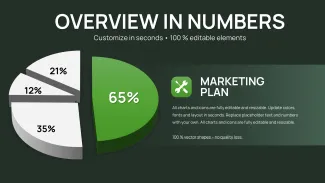
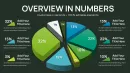
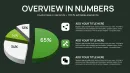
External labels and leader lines keep small slices readable while color contrast guides the eye through comparisons.
Unlike generic pie collections this template groups related distribution views into one deck for quick switching during live discussion. Segment labels sit outside the chart for a specific reason when a slice represents less than 12 percent interior text no longer fits. It works best for board meetings because the ready comparison layouts eliminate the need to build each chart manually.
What is a PowerPoint diagram template? A PowerPoint diagram template is a pre-built .pptx file with editable charts and graphs that professionals customize in Microsoft PowerPoint for business presentations.
Editing Capabilities at a Glance
| Feature | Details |
|---|---|
| Editable shapes | pie segments resize recolor independently |
| Text placeholders | labels update without regrouping |
| Color theme adjustments | slide master palette |
| Diagram connectors | leader lines adjustable |
| Export options | PPTX PDF |
| PowerPoint compatibility | 2019 and 365 |
Customization in 5 Steps
- Open .pptx in PowerPoint 2019 or later (1 minute)
- Update data tables on each pie slide (4 minutes)
- Apply brand colors via master (2 minutes)
- Reposition external labels (3 minutes)
- Save and export (1 minute)
State editing difficulty: Beginner.
Real Scenarios
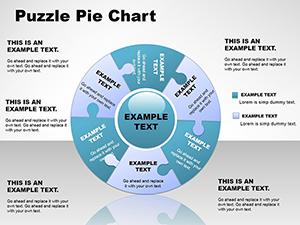
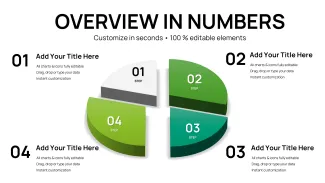
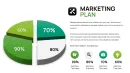
The project lead asked for a maturity model slide by end of day. The analyst had never built one. Here is what happened he opened the template replaced numbers and presented 25 minutes later.
The board understood distribution at a glance and approved the next quarter budget the same afternoon.
Download and start editing immediately
Compared to Starting From Zero
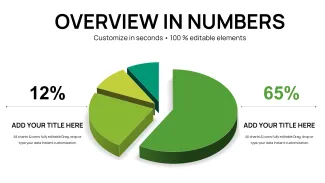
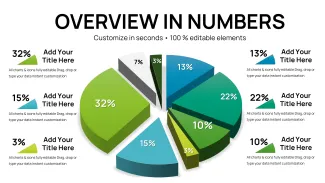
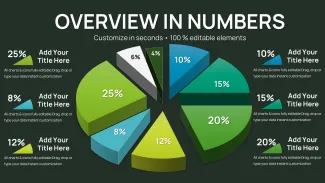
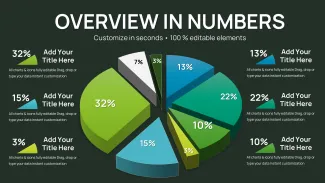
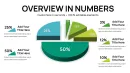
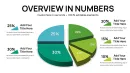
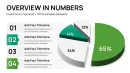
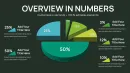
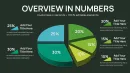
Creating 32 comparison charts manually consumes an entire afternoon and risks inconsistent label placement. External labels with leader lines maintain accuracy for every segment size including the 4 percent and 7 percent slices. This template delivers that precision automatically so executives focus on insights rather than chart legibility.
Download and start editing immediately
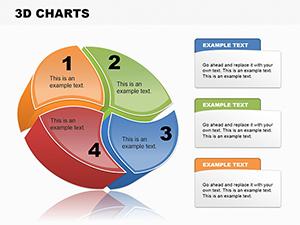
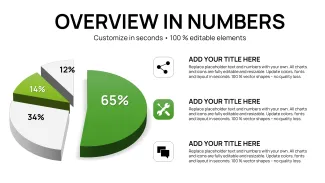
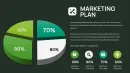
Board meeting presenters often link this file to the pie PowerPoint chart templates collection or combine it with 3-D pie PowerPoint charts when they need both flat and volumetric views in investor presentations.
Which PowerPoint version works with this template?
PowerPoint 2019 and Microsoft 365 open every layout with full 3D and label support. Earlier versions may require minor label repositioning.
How do I change the color scheme?
Edit theme colors in the slide master to update all pies at once. Individual slice overrides keep flexibility for highlight segments.
What does the license allow?
Use inside your company or for client deliverables. The final exported deck can be shared freely.
What is included in the paid versus free version?
Paid delivers the full 32 editable slides. Free previews show only images without data tables.
What is the refund policy?
Refund available within 30 days if the distribution layouts do not match your board meeting needs. Support reviews any compatibility issue first.
How do I update chart data?
Right-click the chart choose Edit Data and enter new percentages. Labels and leader lines reposition automatically.