Gantt Timeline Charts PowerPoint - Fully Editable


Type: PowerPoint Charts template
Category: Business Models, Organizational, Tables
Sources Available: .potx, .pptx
Product ID: PC00056
Template incl.: 18 editable slides
18 Slides, Timeline Layouts: What You Get
18 editable slides arrive in both POTX and PPTX formats.
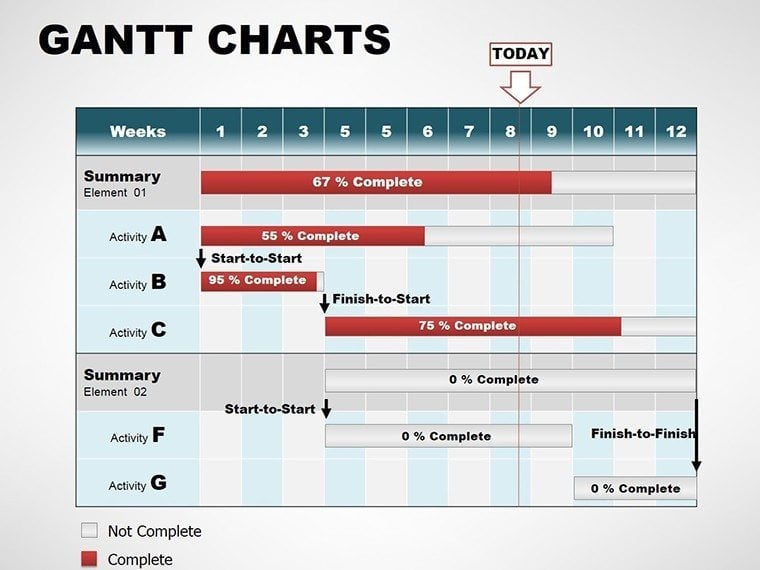
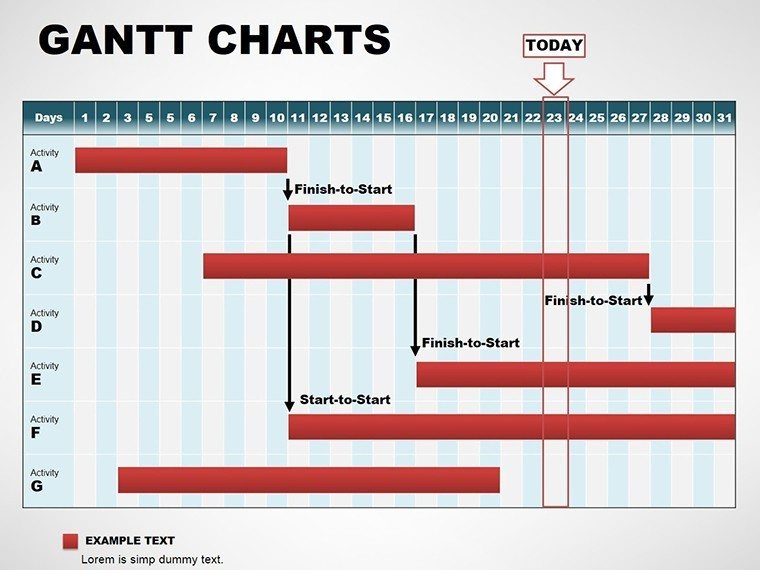
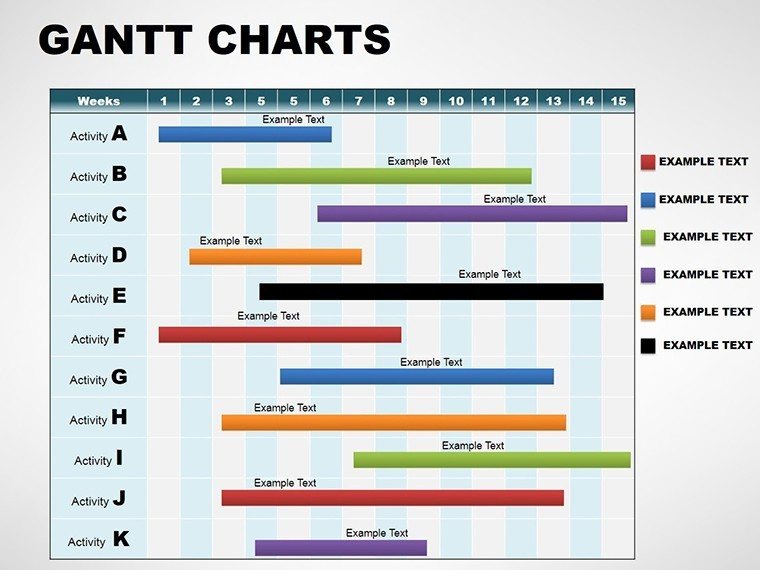
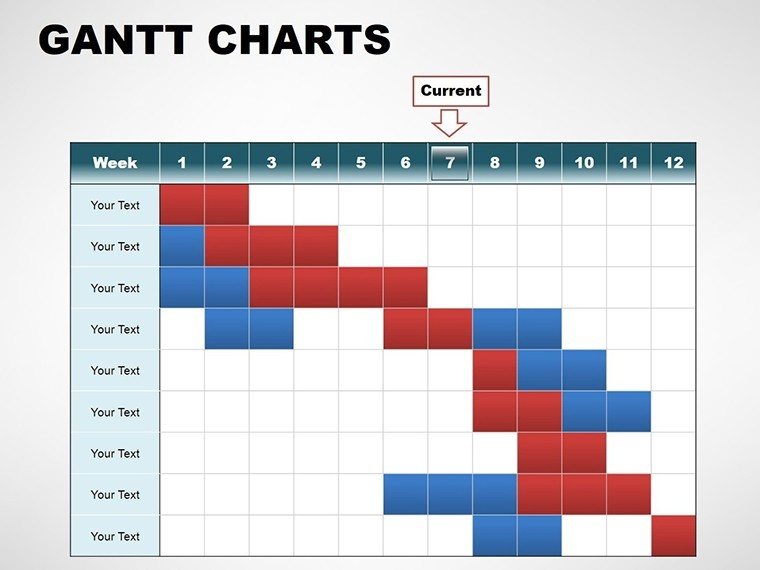
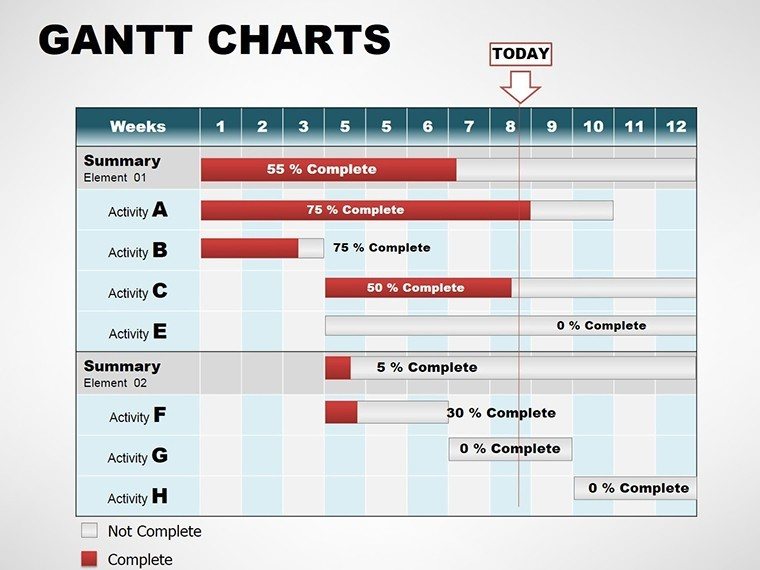
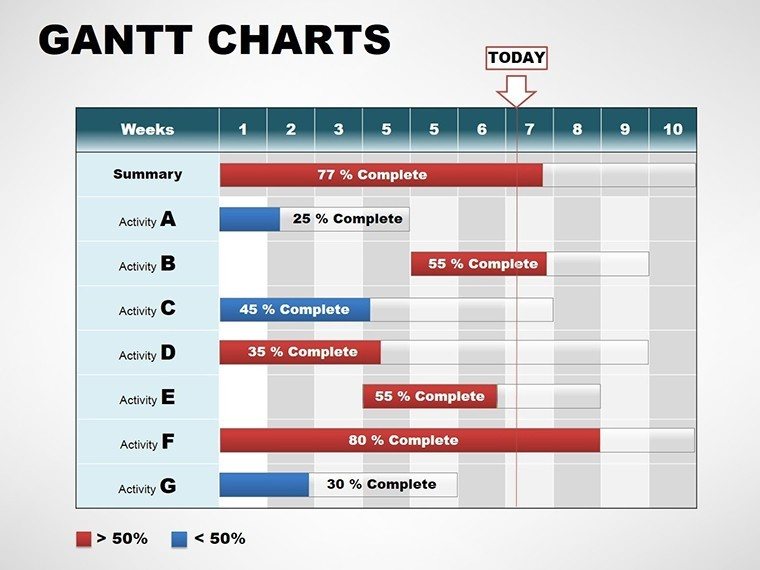
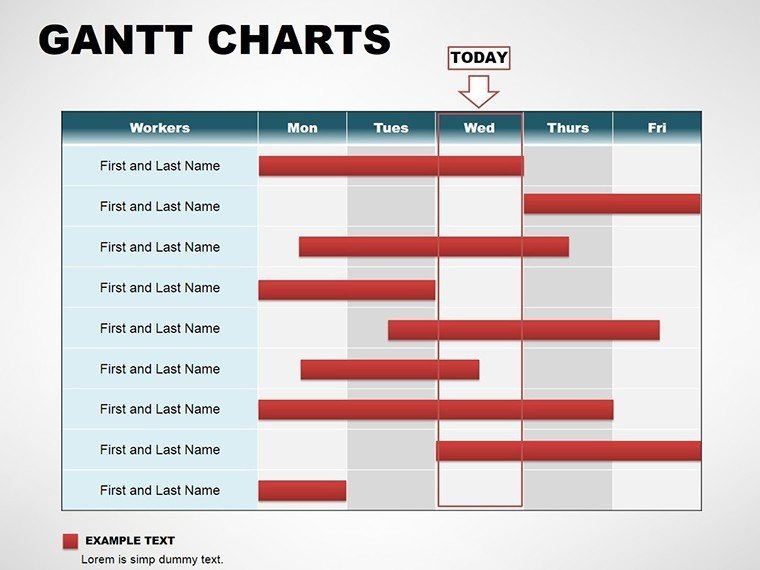
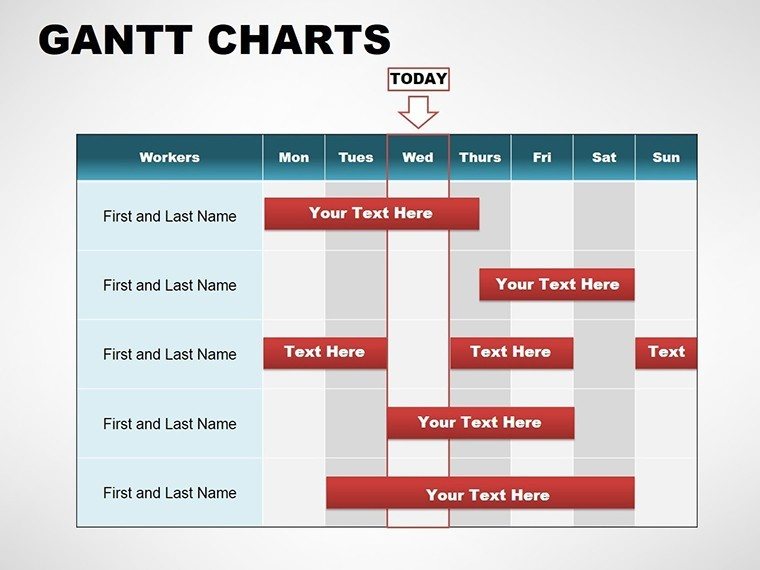
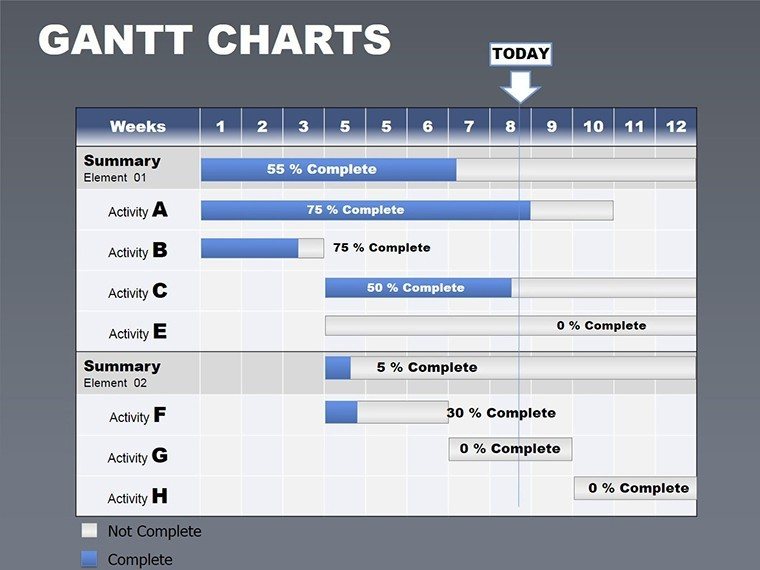
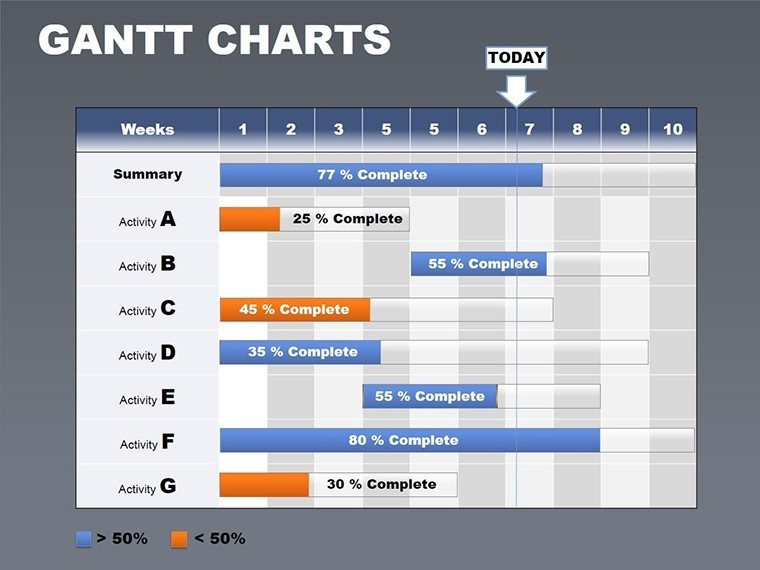
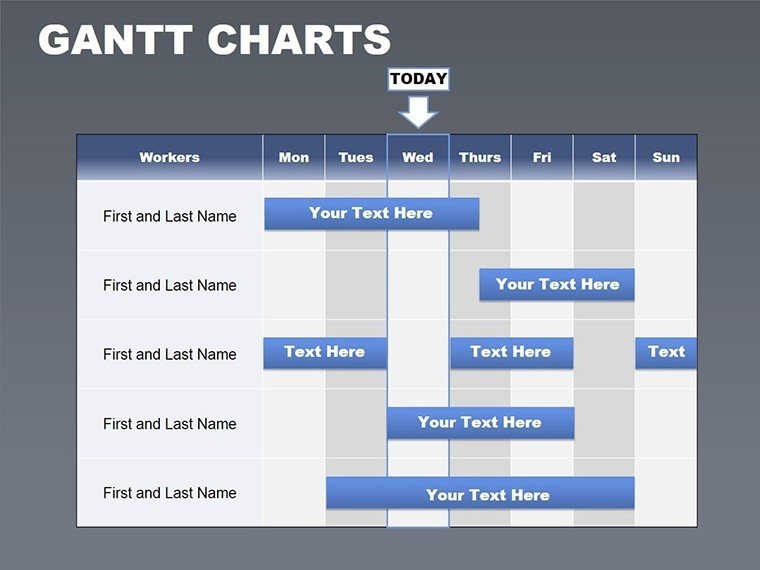
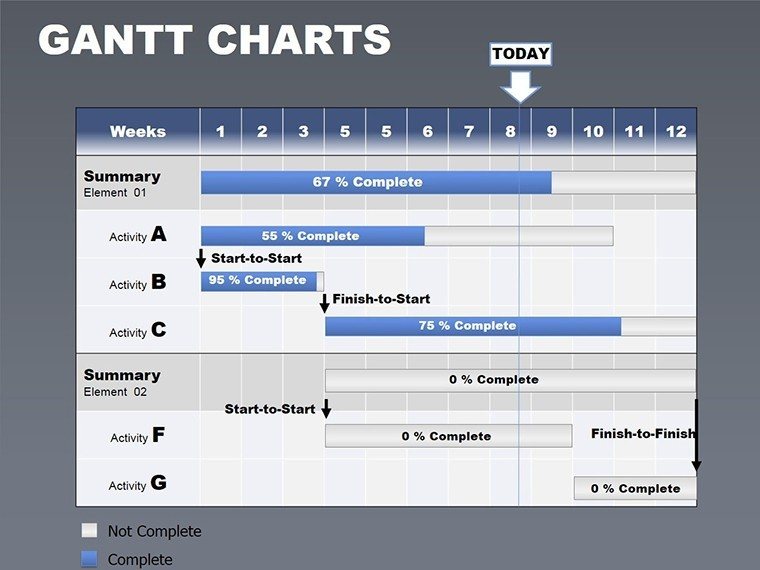
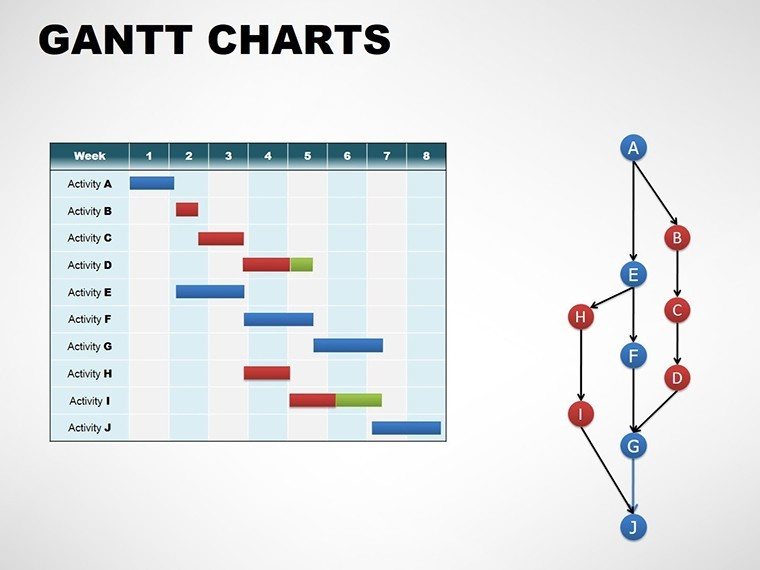
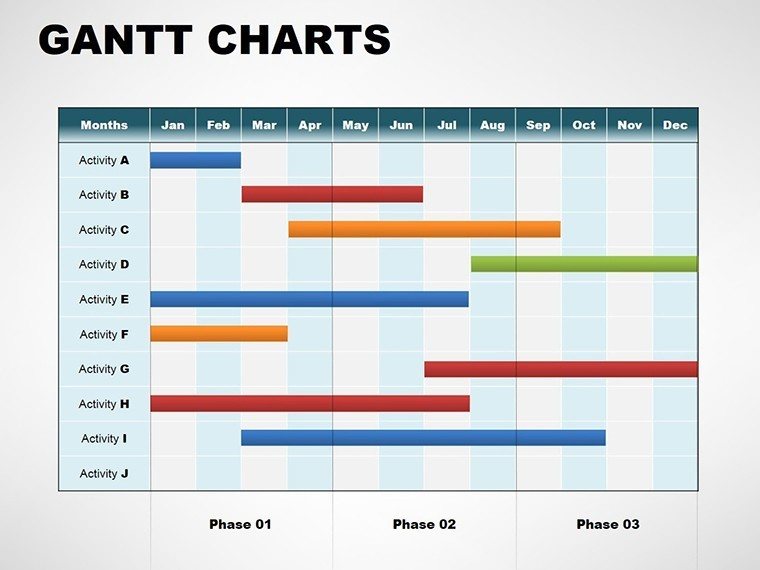
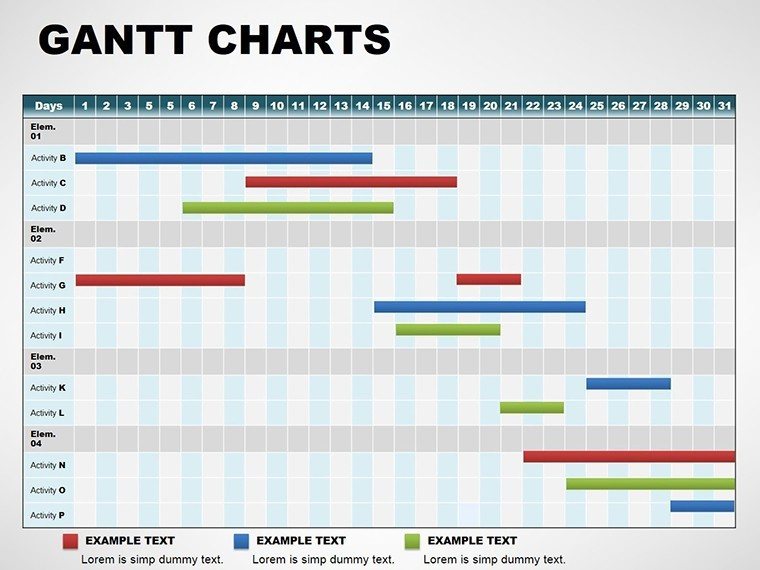
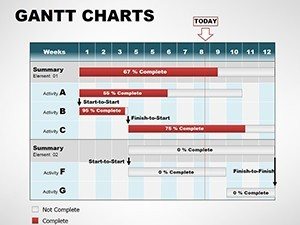
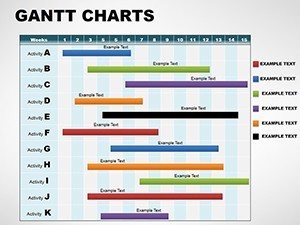
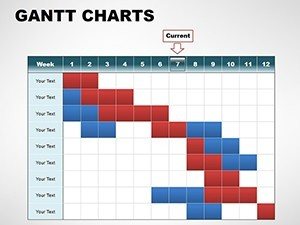
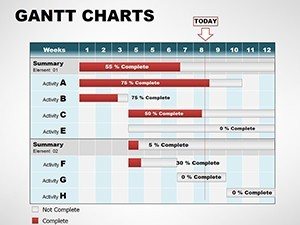
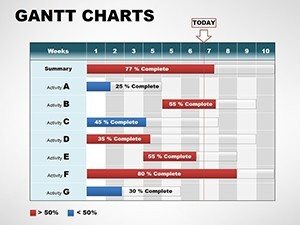
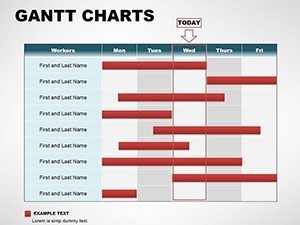
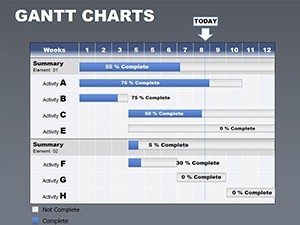
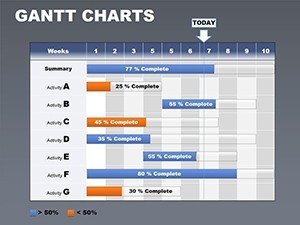
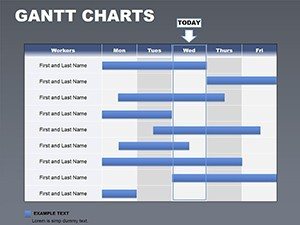
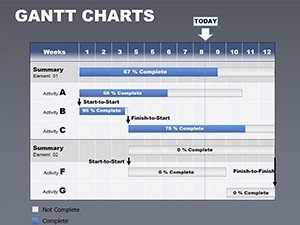
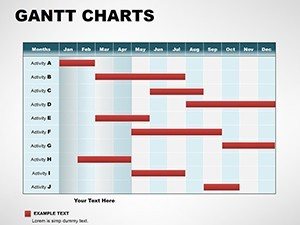
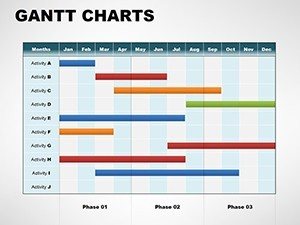
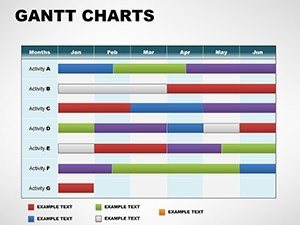
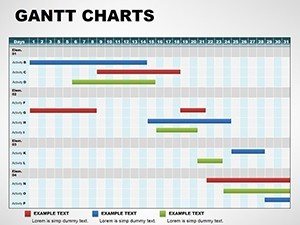
Each slide contains dedicated Gantt bars for task sequencing plus separate dependency lines and milestone markers that snap into place during edits.
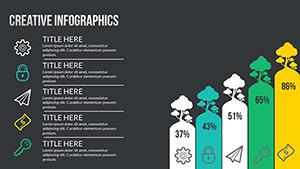
Horizontal timeline bars with external connectors set this layout apart from workflow-focused sets that rely on vertical flow arrows instead of time-based sequencing.
Editing Capabilities at a Glance
| Feature | Details |
|---|---|
| Slides / diagrams included | 18 Gantt timeline slides |
| Diagram categories | Task bars, dependency connectors, milestone flags |
| Editable elements | Bars resize and recolor independently, text placeholders update without group unlock |
| Aspect ratio | 16:9 standard |
| PowerPoint compatibility | 2016, 2019, 365 on Windows and Mac |
| Color theme adjustments | Slide master palette swap in one click |
Typical Use Cases by Role
A construction project manager in the infrastructure sector prepares a client proposal and reuses the same file across three reports by swapping milestone dates.
A marketing campaign coordinator adapts the Gantt bars for quarterly reviews and cuts deck preparation from three hours to 45 minutes.
Download the Gantt PowerPoint Charts Template now
Adapting the Template to Your Brand
- Open the .pptx or .potx file in PowerPoint 2016 or later (1 minute)
- Replace placeholder text with your content (3 minutes)
- Adjust brand colors via the slide master (2 minutes)
- Edit diagram labels and connectors (4 minutes)
- Export as PPTX or PDF (1 minute)
Editing difficulty: Moderate.
Why This Template, Not a Blank Slide
Building equivalent Gantt slides from scratch takes four hours even for an experienced user because alignment of bars and dependency lines demands precise manual positioning.
This layout places labels outside the shapes connected by thin lines so readability holds during live meetings without extra editing steps.
Many presentations place labels directly inside diagram shapes yet that approach fails on projection screens.
Download the Gantt PowerPoint Charts Template now
Which PowerPoint versions support these files?
The template opens in PowerPoint 2016, 2019 and Microsoft 365 on both Windows and Mac systems. Earlier versions may show limited editing for advanced connectors. Test the free download first to confirm compatibility with your exact build. The POTX master slide format also works in the same versions.
How do I change the color scheme?
Open the slide master view, select the color palette dropdown and pick your corporate theme. All Gantt bars and connectors update automatically. Save the master once and every slide inherits the new scheme. No manual recoloring of individual elements is required.
Can I use this in paid client work?
The license permits internal company use and client deliverables. You may not resell the file or offer it as a standalone product. Attribution is not required. Contact support for enterprise licensing if your agency distributes decks to multiple clients.
What is the difference between free and paid versions?
The paid version includes the complete set of 18 editable slides with full Gantt bars and dependency connectors. Free tier details are not listed on the page. The purchase covers both POTX and PPTX formats ready for immediate editing.
What file formats are included and which software opens them?
You receive .potx and .pptx files. Both open in Microsoft PowerPoint 2016 or newer. The template does not include Keynote or PDF versions. Export options remain available after editing.
What is the refund policy?
Refunds are available within 14 days if the file does not open in your version of PowerPoint. Contact support with your order ID and a screenshot of the error. Digital products are non-returnable after successful download and use.