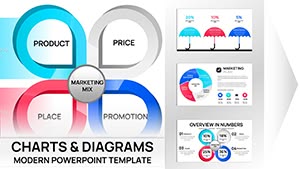
Marketing Mix PowerPoint Template 4Ps 7Ps 31 Slides


Type: PowerPoint Charts template
Category: Matrix, Business Models, Tables
Sources Available: .pptx
Product ID: PC00022
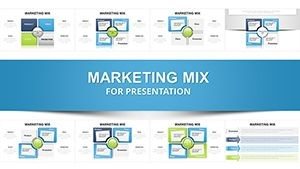
Template incl.: 31 editable slides
In the competitive landscape of modern business, a marketing strategy is only as strong as its execution and communication. Our Marketing Mix PowerPoint Template is a powerhouse of 31 professional slides designed to help you articulate every facet of your market positioning. Whether you are navigating the classic 4Ps, the expanded 7Ps, or the customer-centric 4Cs, this template provides the visual infrastructure to turn complex strategic theories into actionable roadmaps. As a presentation consultant who builds decks for global brands, I know that stakeholders don't just want to see data—they want to see a cohesive story of how your product will dominate the market. This suite is engineered to deliver that narrative with clarity and authority.
The Master Blueprint for Market Positioning
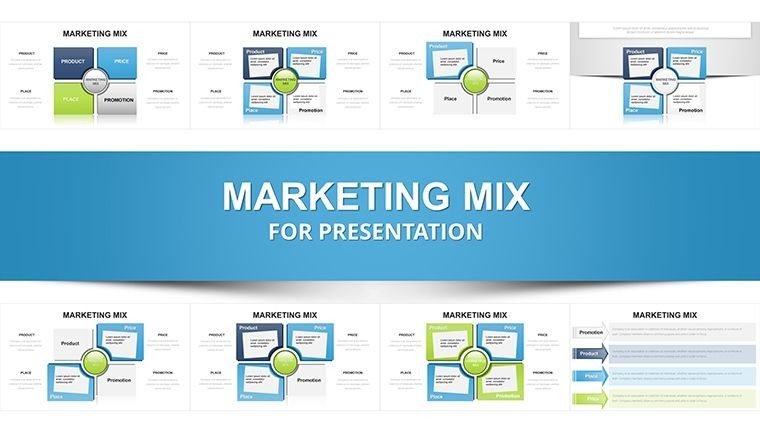
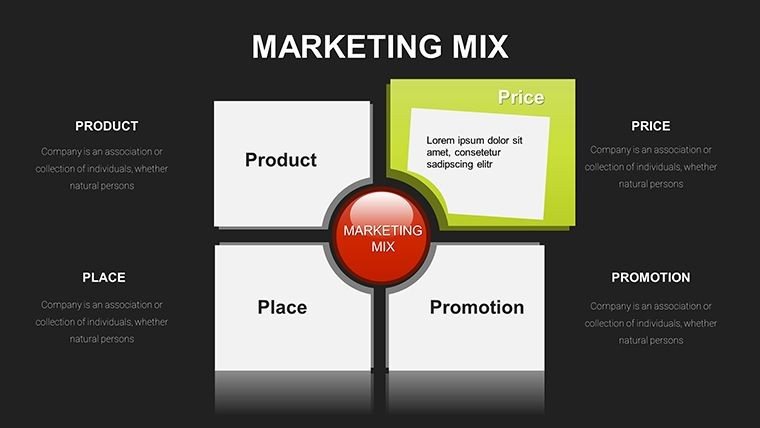
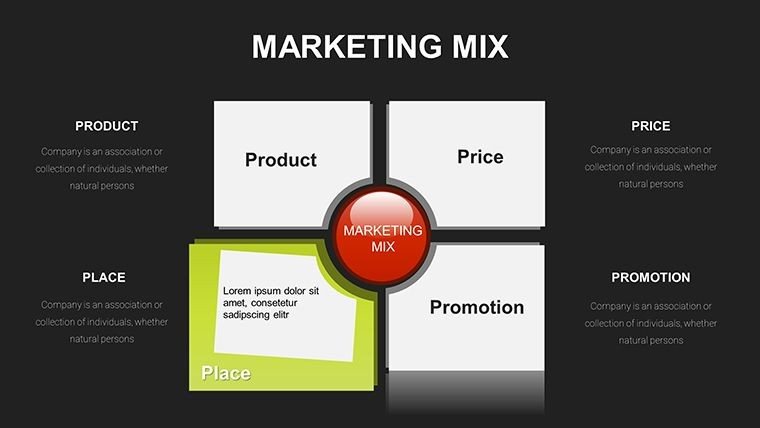
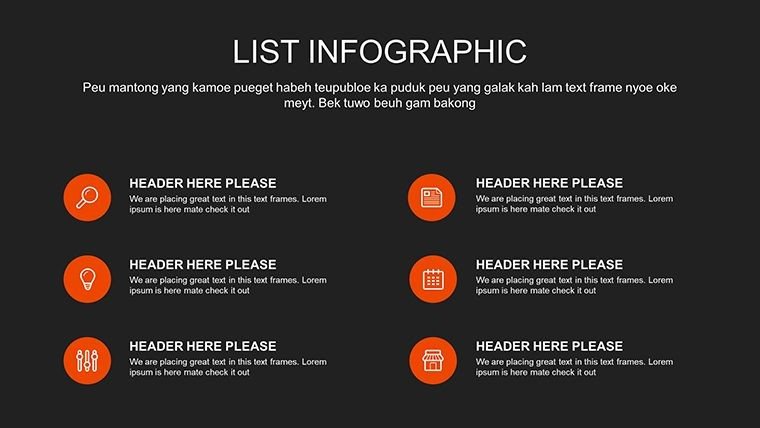
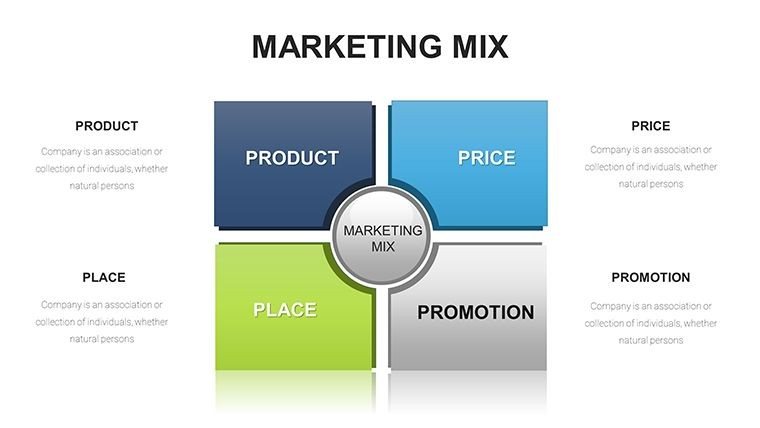
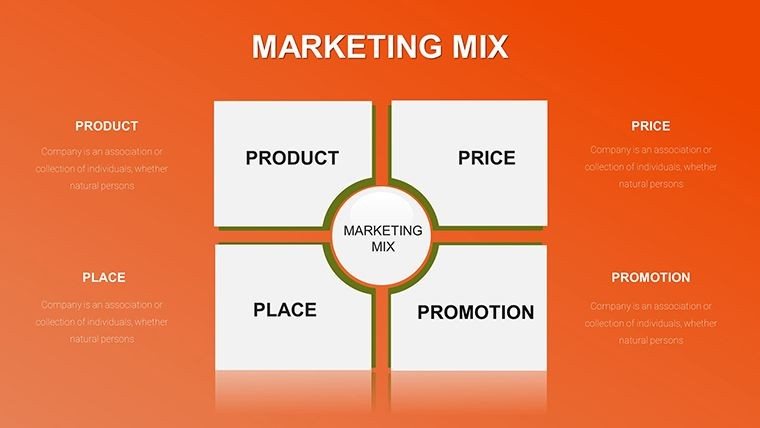
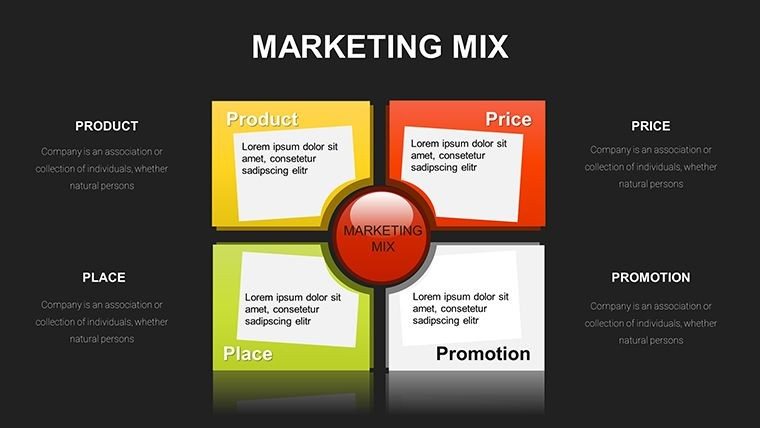
This 31-slide collection acts as a master blueprint for your marketing department. We have moved beyond simple bullet points to create high-impact visualizations that represent the synergy between Price, Product, Place, and Promotion. Each slide is crafted to handle different levels of detail, from high-level executive summaries to deep-dive tactical breakdowns of physical evidence, processes, and people. The design philosophy emphasizes modularity; you can use the entire deck for a comprehensive annual marketing plan or pull individual slides for specialized project briefs. By using this template, you ensure that your strategic framework is presented with the same level of sophistication as the products you are bringing to market.
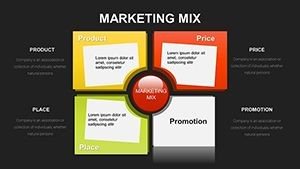
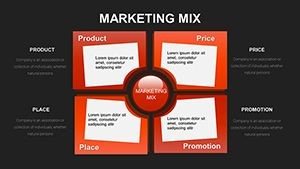
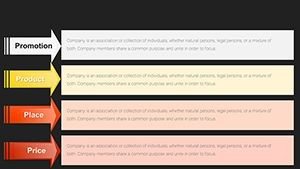
Dynamic Frameworks for Every Strategic Model
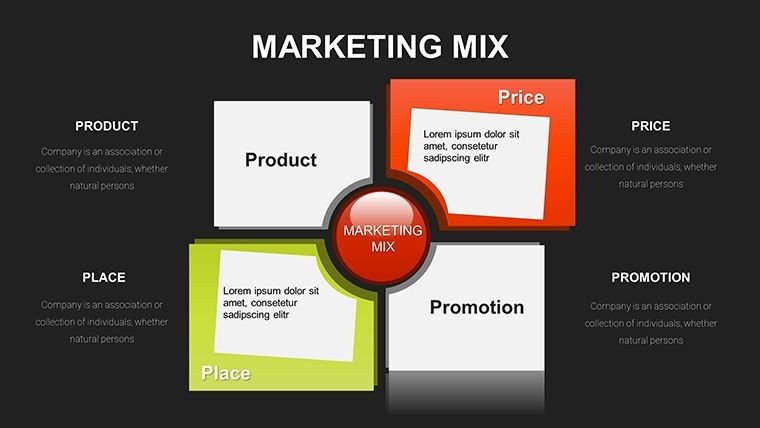
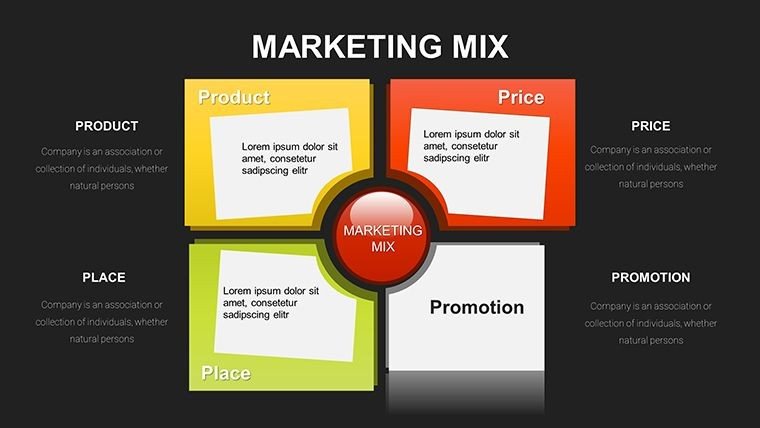
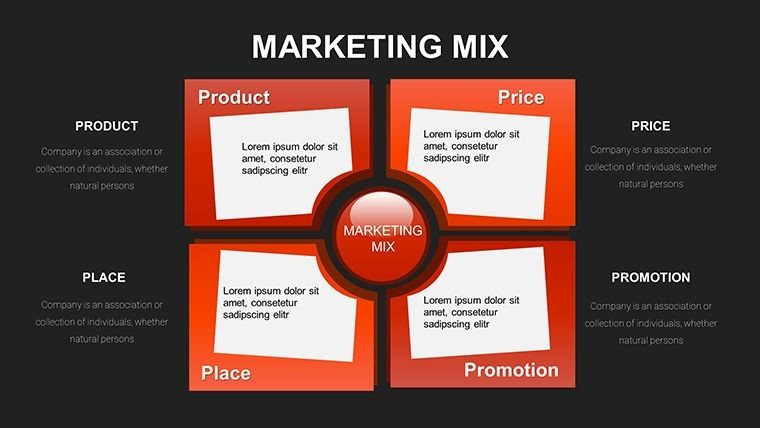
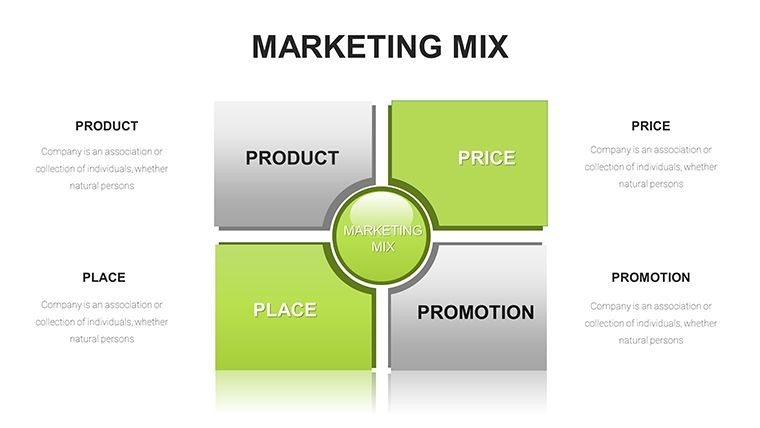
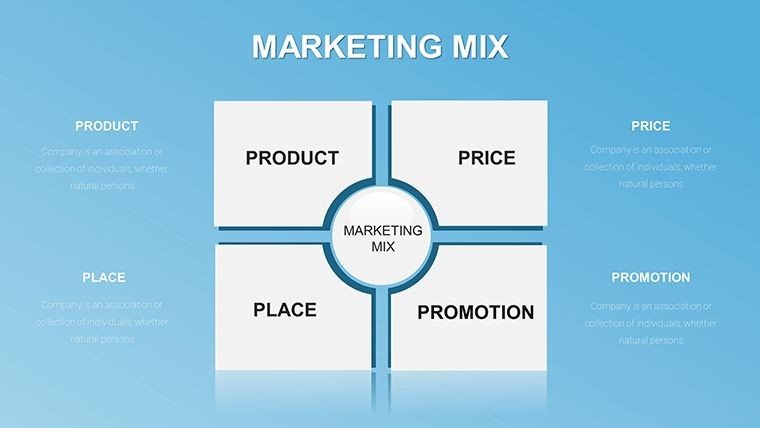
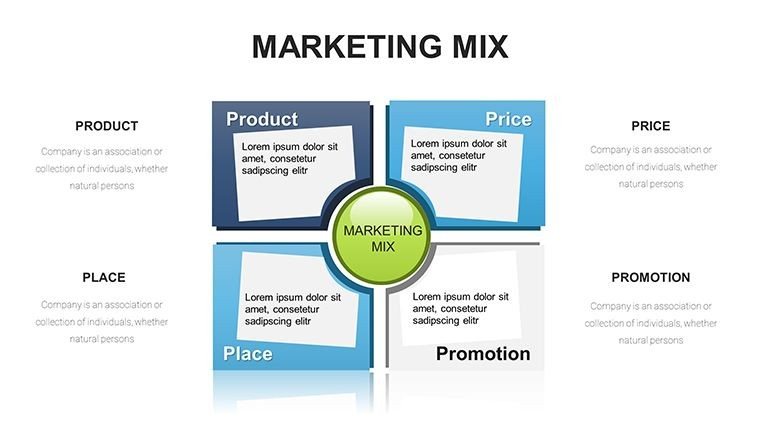
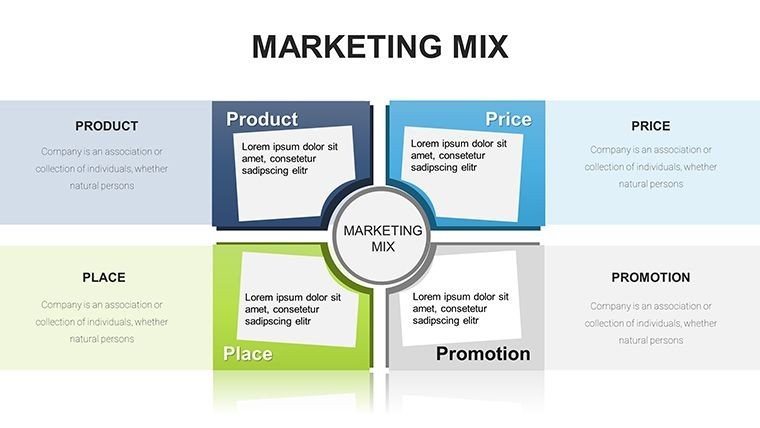
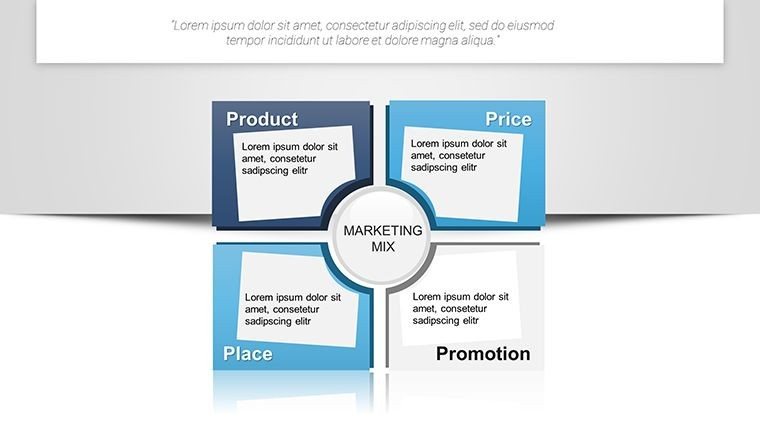
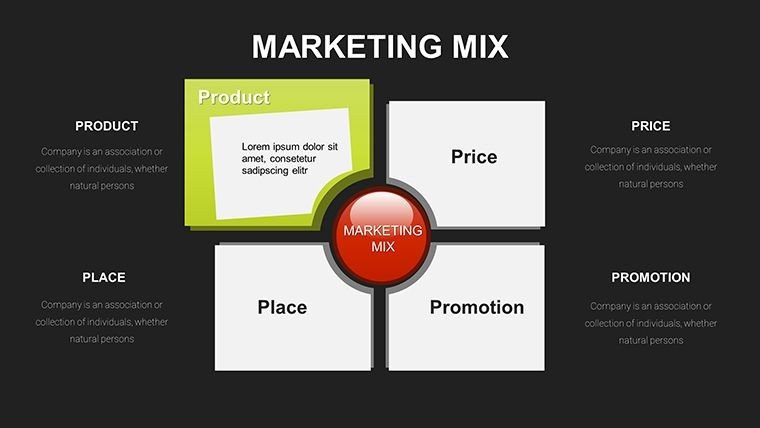
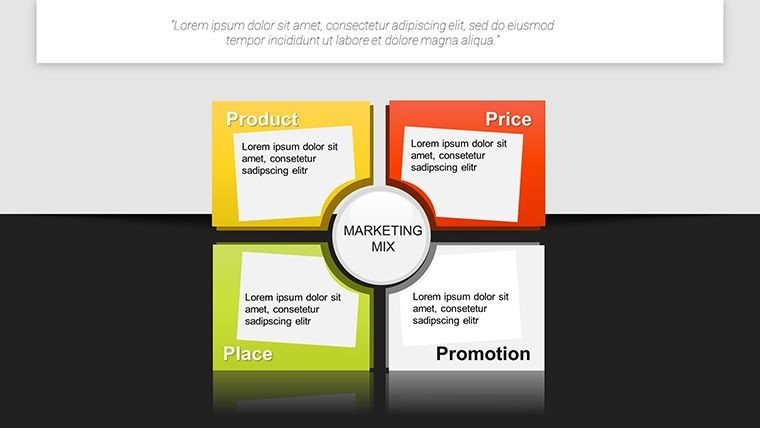
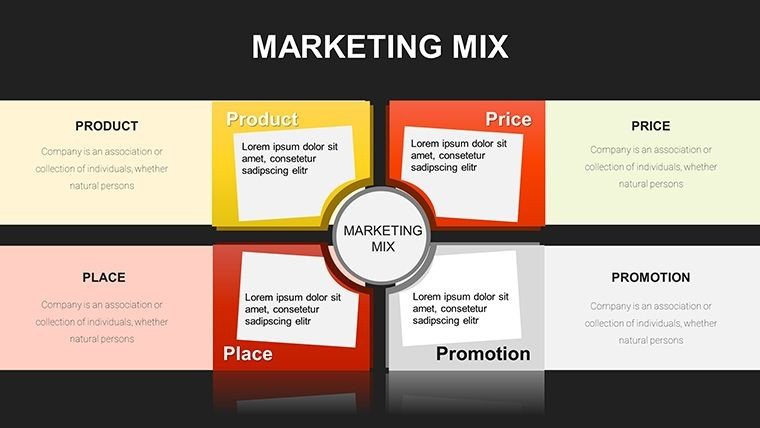
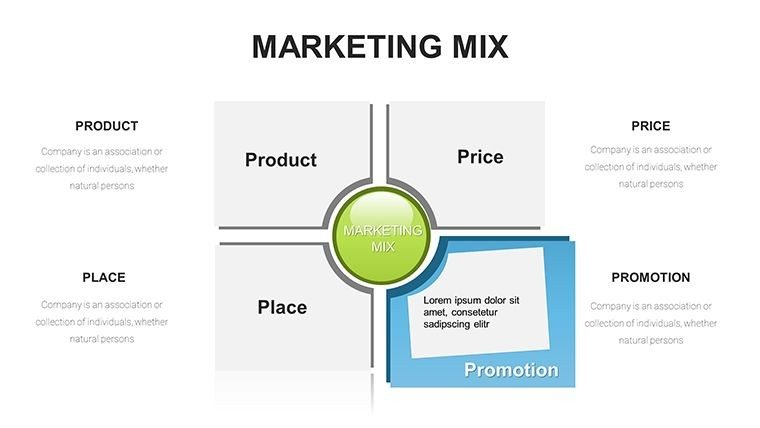
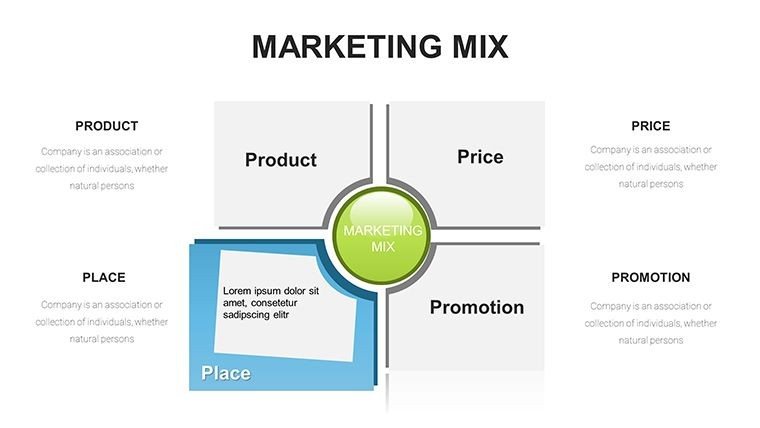
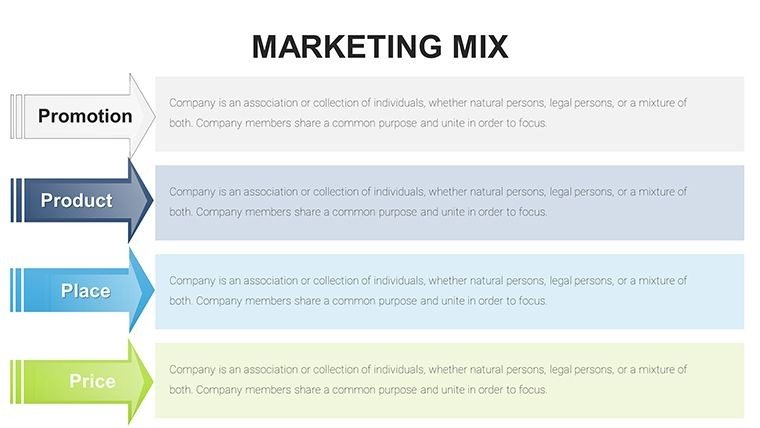
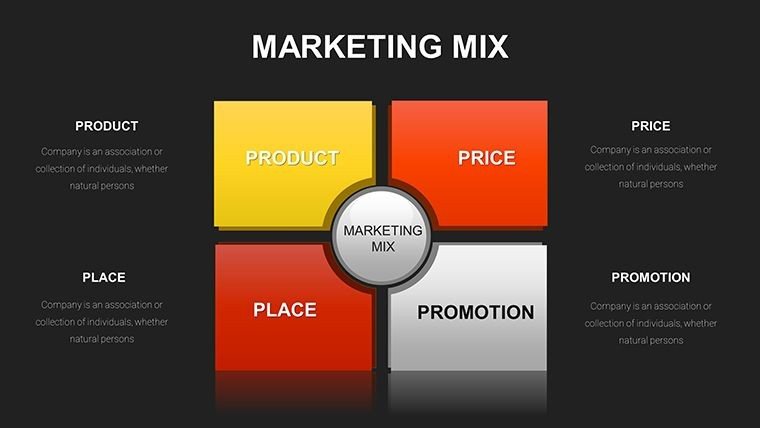
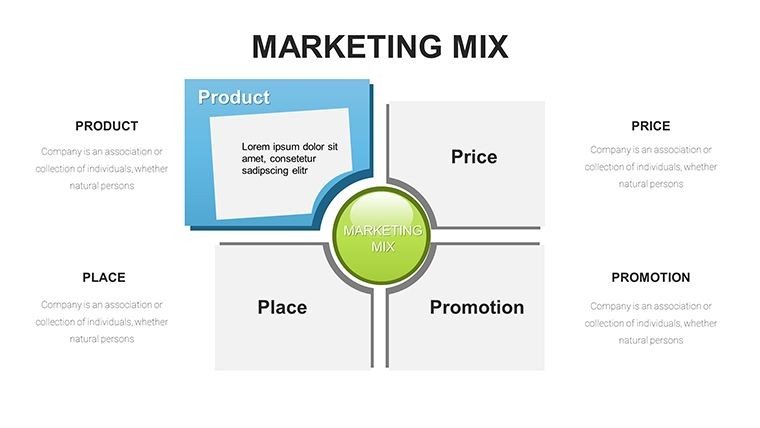
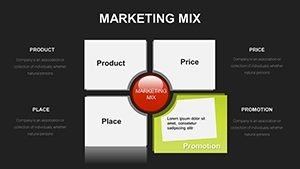
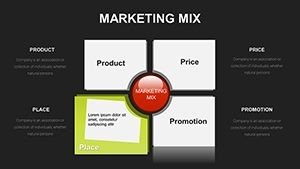
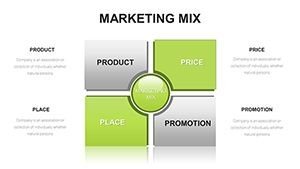
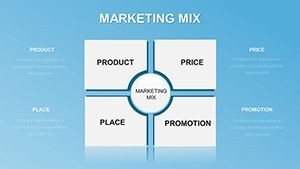
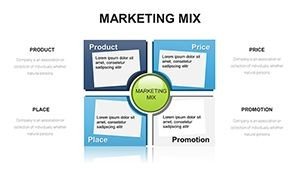
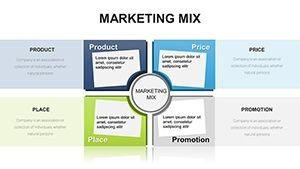
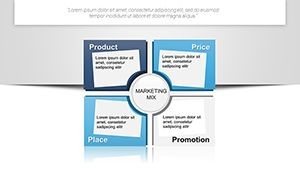
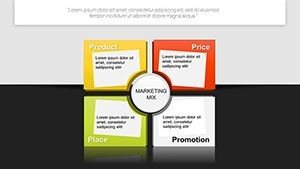
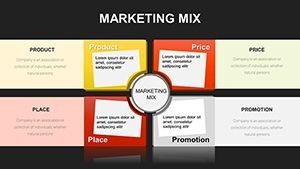
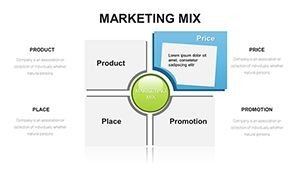
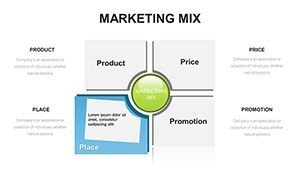
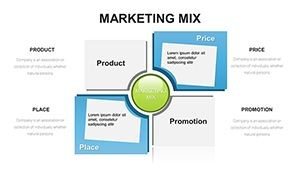
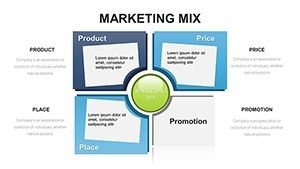
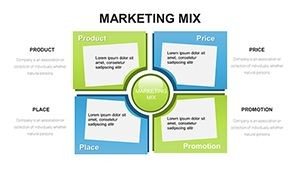
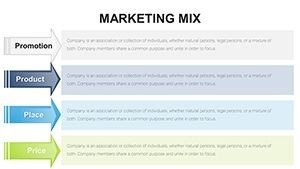
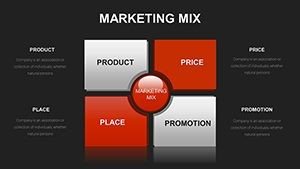
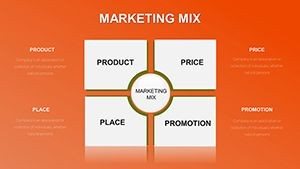
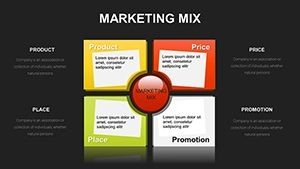
One size never fits all in marketing, which is why this template includes variations for multiple frameworks. You will find dedicated layouts for the traditional 4Ps (Product, Price, Place, Promotion), the service-oriented 7Ps (adding People, Process, and Physical Evidence), and the 4Cs (Consumer, Cost, Convenience, Communication). Each model is presented through unique graphics—from circular flows and Venn diagrams to interlocking puzzles and matrix grids. This variety allows you to choose the visualization that best fits your specific industry context, whether you are launching a digital SaaS product or a tangible consumer good. Every element is a native PowerPoint shape, allowing for instant adjustments to color, size, and text without losing professional polish.
Strategic Applications in High-Stakes Environments
Throughout my years of consulting, I have seen these Marketing Mix slides serve as the "anchor" for critical business decisions. In a product launch meeting, use the 4Ps breakdown to align your sales and logistics teams on distribution channels and pricing tiers. For a brand repositioning workshop, the 7Ps slides are invaluable for auditing the customer experience at every touchpoint, especially the "Process" and "People" elements that often go overlooked. Educators and marketing trainers also find this deck essential for breaking down academic concepts into digestible, visual lessons that stick with students long after the lecture ends. This is not just a slide deck; it is a tactical toolkit for anyone serious about market success.
Workflow Integration and Customization Excellence
Time is your most valuable asset, and this template is designed to protect it. Instead of spending days building complex diagrams from scratch, you can import this suite into your existing workflow in seconds. The template is fully optimized for PowerPoint 2016+, Keynote, and Google Slides, ensuring consistent performance regardless of your preferred platform. I recommend using the "Slide Master" feature to apply your brand colors globally across all 31 slides instantly. This ensures that your presentation looks custom-built for your company, even if you only had an hour to prepare. The high-resolution vector graphics ensure that your slides look razor-sharp on everything from a laptop screen to a professional projector.
Value Comparison: ImagineLayout vs. Generic Solutions
| Feature | ImagineLayout 31-Slide Suite | Default Chart Tools | Basic Online Templates |
|---|---|---|---|
| Framework Depth | 4Ps, 7Ps, 4Cs, and more | Basic bar/pie charts only | Single, generic 4P slide |
| Slide Variety | 31 unique strategic layouts | Zero strategic frameworks | 3-5 repetitive slides |
| Customization | Full vector-based control | Rigid and hard to style | Limited to text changes |
| Professionalism | C-suite and Investor ready | Standard office look | Cluttered and amateur |
Vertical-Specific Implementation
The beauty of a comprehensive 31-slide deck is its adaptability across diverse industries. In the tech sector, marketing managers use the "Place" slides to map out digital ecosystems and app store presence. In retail, the "Physical Evidence" layouts are used to visualize store layouts and packaging design. Financial services firms utilize the "Process" slides to explain the complexity of client onboarding and service delivery. Every slide in this pack is a canvas for your specific industry expertise. Start creating professional presentations today and give your marketing strategy the visual weight it deserves to win over stakeholders and secure budget approval.
Maximizing Impact with Visual Hierarchy
To truly master this template, focus on the visual hierarchy provided by our expert designers. Use the slides with central icons for your primary goal and the surrounding nodes for your supporting tactics. If you are presenting a budget-heavy promotion plan, utilize the dedicated "Promotion" slides that feature integrated data callouts for ROI projections. This structure prevents "information overload" by compartmentalizing different aspects of the marketing mix, allowing your audience to focus on one strategic pillar at a time. The result is a more engaged audience and a much clearer path to project approval.
Frequently Asked Questions
What is the difference between the 4Ps and 7Ps slides in this deck?
The 4Ps slides focus on the core marketing pillars: Product, Price, Place, and Promotion, which are ideal for traditional goods. The 7Ps slides expand this to include People, Process, and Physical Evidence, making them essential for service-based businesses or organizations focused on the total customer experience. Our template provides distinct, professionally designed layouts for both models.
Can I change the icons to better reflect my specific industry?
Yes, all icons in the 31-slide template are fully editable vectors. You can easily swap them out for other icons from PowerPoint’s built-in library or upload your own SVG files. The layout will maintain its alignment and formatting regardless of the icons you choose, allowing for total brand customization.
Is this 31-slide template too large for a short 10-minute pitch?
Not at all. Think of this deck as a library. For a short pitch, you might only select 3 or 4 key slides that highlight your most important marketing strategies. Having the full 31-slide suite ensures that you have the right visual for any specific question that might come up during the Q&A session, making you appear more prepared and professional.
Final Command of Your Strategy
Your marketing plan deserves to be seen, understood, and acted upon. The Marketing Mix PowerPoint Template (31 Slide Suite) provides the professional edge you need to command the room and drive results. Don't settle for mediocre visuals when you can have a comprehensive set of strategic frameworks at your fingertips. Download instantly and customize in minutes to elevate your marketing discourse to the highest professional standard. Your journey to market leadership begins with a clear, visual plan.