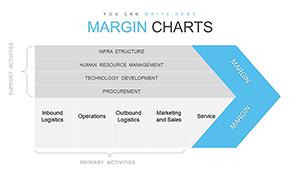
Hotel Occupancy by Region PowerPoint Template and Charts


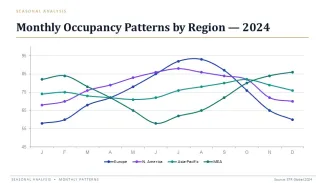
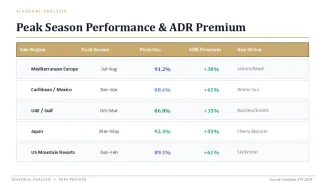


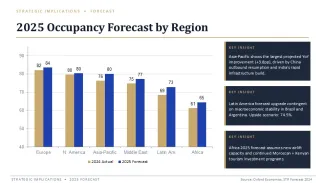
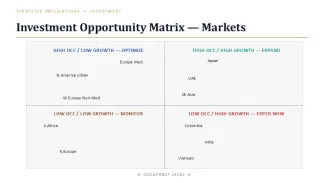


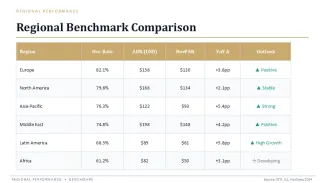
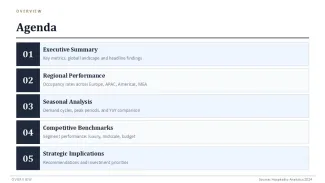


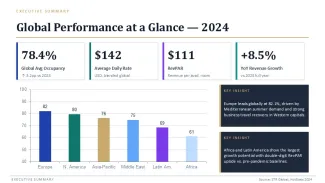


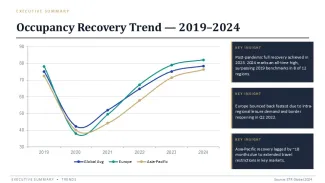


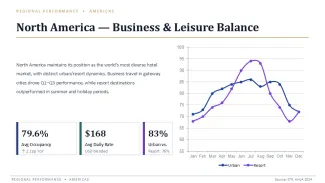


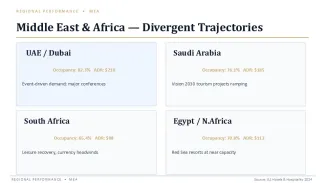
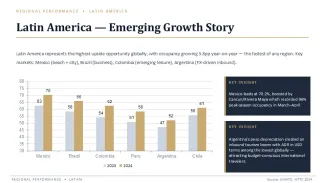


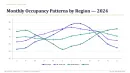

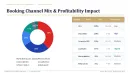

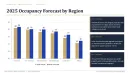
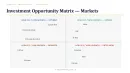


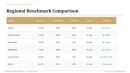


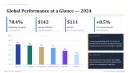


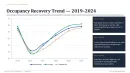

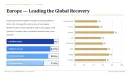
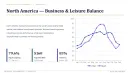


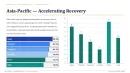
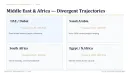
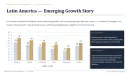

This PowerPoint chart template provides pre-built layouts for hotel occupancy data segmented by region. Revenue managers and hospitality analysts use these slides for quarterly performance reviews, market share comparisons, and forecasting presentations. The structure solves the problem of manually aligning regional data into readable charts.
Data placeholders resize proportionally when you edit values, keeping axis labels readable. Color accents update through Slide Master changes, applying to all charts simultaneously. Grouped chart elements remain aligned after duplication, so you can create regional breakdowns without repositioning individual bars.
- 36 pre-formatted chart slides for regional occupancy data
- Data labels maintain readable font sizes when values change
- Consistent color coding across all regional charts
- PPTX format works with PowerPoint 2016 and newer
- Clean layout grid keeps charts aligned after edits
| Feature | Specification |
|---|---|
| Slides | 36 editable slides |
| Formats | .pptx |
| Aspect Ratio | 16:9 widescreen |
| Editable Elements | All charts, data labels, text placeholders, color accents |
| Color Customization | Slide Master controls global palette |
| Compatibility | PowerPoint 2016-2021, Office 365 |
Frequently Asked Questions
How do I edit the chart data in PowerPoint?
Right-click any chart and select "Edit Data" to open the embedded Excel sheet. Update the numbers there, and the chart bars or lines will adjust automatically while keeping the original formatting.
Can I use this template for commercial client presentations?
Yes, the standard license allows you to use the template for client work, internal business presentations, and proposals. You may not resell the template file itself.
Are the charts vector-based and scalable?
Yes, all charts are built with native PowerPoint shapes and data graphics. They scale without pixelation and remain fully editable, unlike pasted images or static charts.
Related: PowerPoint Charts - PowerPoint Templates