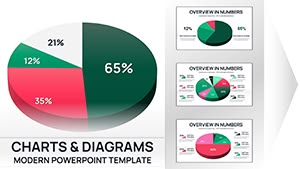
Editable PowerPoint Charts Template for Board Meetings | Fully Editable, Instant Download


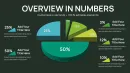
Executive presentations fail when charts confuse instead of clarify. This editable PowerPoint chart template is designed for professionals who need to explain structure, distribution, or comparisons clearly in board meetings, investor presentations, and management reports. I use layouts like this weekly when time is limited and the audience expects clarity, not decoration.
The template helps you turn raw numbers into a clean visual story without rebuilding charts from scratch. It works especially well when decisions depend on fast understanding - budget reviews, performance summaries, or strategic updates. You focus on the message; the slide handles alignment, spacing, and visual balance.
Slide & Chart Breakdown
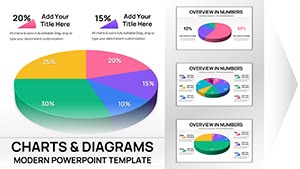
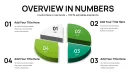
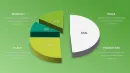
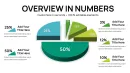
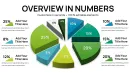
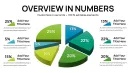
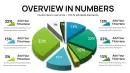
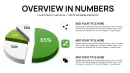
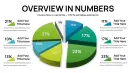
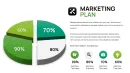
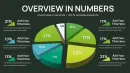
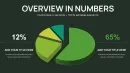
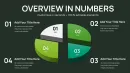
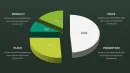
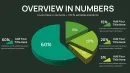
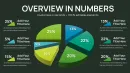
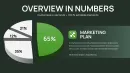
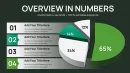
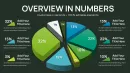
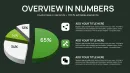
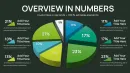
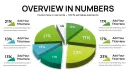
- Clean, professional chart layout optimized for executive screens
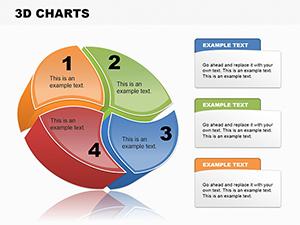
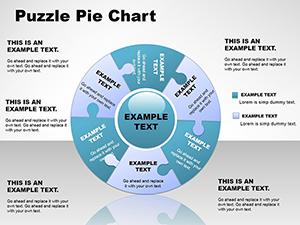
- Editable text placeholders for titles, labels, and key takeaways
- Balanced spacing to avoid clutter in data-heavy slides
- Consistent style suitable for report slides and board decks
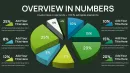
Professional Use Cases
- Board meetings requiring fast data interpretation
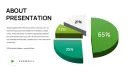
- Investor presentations explaining structure or performance share
- Quarterly and annual report slides
- Internal strategy and management reviews
Workflow Integration
I typically drop this slide directly into an existing deck and replace the sample data in under five minutes. You can edit it in PowerPoint without add-ins, adjust colors to match brand guidelines, and duplicate the slide for comparisons. The layout also works well when exported to PDF for reports or shared decks.
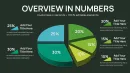
Real-World Presentation Scenarios
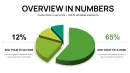
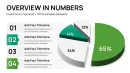
In a board meeting, this chart helps directors quickly see how values are distributed. In an investor update, it supports a narrative without distracting design elements. For team reviews, it keeps discussions focused on insights rather than slide explanations.
Internal Comparison Table
| Slide Purpose | Audience | Outcome |
|---|---|---|
| Performance Overview | Board & Executives | Faster alignment and decisions |
| Structure Explanation | Investors | Clear understanding of proportions |
| Internal Review | Management Teams | Focused discussion on results |
Industry Applications
- Finance and consulting reports
- Corporate strategy decks
- Technology and SaaS updates
- Operations and performance reporting
Download now if you need a chart slide that works immediately in executive environments. If speed matters, you can start editing instantly and focus on the story, not the layout.
Frequently Asked Questions
When should I use this chart template?
Use it when you need to explain proportions, structure, or comparisons clearly to executives, investors, or stakeholders.
When is this template not the best choice?
If you need highly detailed technical charts or complex multi-axis data, a specialized analytical chart may be better.
How fast can I edit the slide?
Most users replace data and text in a few minutes using standard PowerPoint chart editing tools.
How do executives usually perceive this slide?
Executives typically appreciate the clean layout because it highlights insights without visual noise.