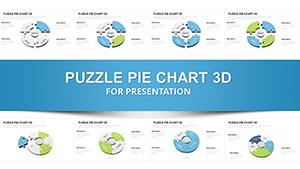
3-D Pie PowerPoint Charts - Fully Editable Template for Board Meetings


Struggling to present complex data in a visually compelling way? Our 3-D Pie PowerPoint Charts template helps executives, analysts, and team leads transform raw data into clear, actionable insights. Perfect for board meetings, investor presentations, or quarterly report decks, this template saves hours of manual design work while ensuring your slides look professional and polished. Designed for rapid customization, each chart is fully editable in PowerPoint, Keynote, and Google Slides. Adjust colors, labels, and data values effortlessly to match your branding or highlight key metrics.
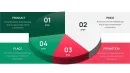
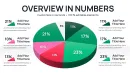
Feature & Slide Breakdown
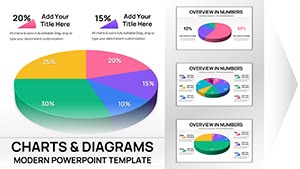
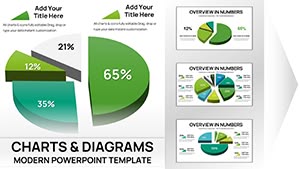
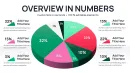
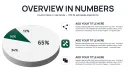
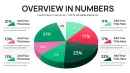
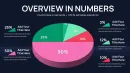
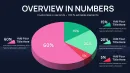
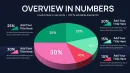
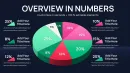
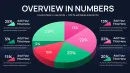
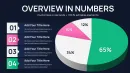
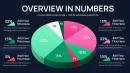
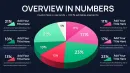
- 3-D Pie Charts with multiple slices and labels
- Customizable colors and fonts for branding consistency
- Pre-designed layouts optimized for executive presentations
- Data-driven charts ready for financial, marketing, or operational metrics
Professional Use Cases
- Board meetings: illustrate revenue breakdowns, market share, or departmental contributions
- Investor presentations: showcase funding allocation or product portfolio distribution
- Team reviews: track project progress, budget spending, or survey results
Workflow Integration
Use directly in PowerPoint for Windows or Mac, import into Keynote for Apple presentations, or edit in Google Slides for collaborative review. Charts are designed to maintain formatting and proportions across platforms, making them ideal for distributed teams.
Real-World Presentation Scenarios
- Quarterly financial review: visualize expense categories and revenue streams
- Marketing campaign results: compare campaign performance by region or channel
- Investor update: highlight portfolio diversification and funding allocation
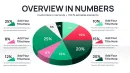
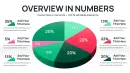
Internal Comparison Table
| Slide Type | Audience | Outcome |
|---|---|---|
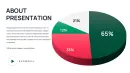
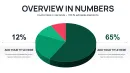
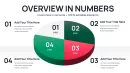
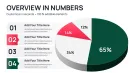
| 3-D Pie Chart | Executives, Investors | Clear visual breakdown of percentages |
| Labelled Pie Sections | Team Leads | Quickly identify key contributors |
Industry Applications
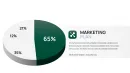
- Finance: expense and revenue breakdowns
- Marketing: campaign performance, customer segmentation
- Consulting: client reporting and insights
- Operations: resource allocation and process tracking
Download now to start building executive-ready slides instantly.
Frequently Asked Questions
When should I use this template?
Use this template for any presentation requiring a clear visual breakdown of data percentages, such as board meetings, investor updates, or internal team reviews.
Can I edit the charts in Google Slides?
Yes, all charts are fully editable in PowerPoint, Keynote, and Google Slides without losing formatting or proportions.
Who is this template designed for?
Executives, analysts, marketing managers, and consultants who need professional, data-driven visuals for presentations.
Is it suitable for financial reports?
Absolutely. The 3-D pie charts clearly display budget allocations, revenue streams, and cost breakdowns in a visually engaging format.