Comprehensive Pie Charts PPT Template Collection


From my experience building presentation materials for enterprise clients, a robust pie chart set can demystify intricate ratios in high-pressure environments like strategy sessions. This 34-slide template tackles the challenge of limited visual options in standard tools, providing a broad array of designs that cater to detailed examinations. It`s a go-to for those who present multifaceted data weekly, ensuring every proportion is conveyed with authority and ease.
Analysts and leaders appreciate how it transforms dense figures into accessible overviews, fostering better decision-making. I`ve incorporated such collections in partner presentations to map out collaboration potentials, always yielding clearer dialogues.
Exploring the Extensive Slide Features
The template`s expanse allows for nuanced storytelling through data, with each slide offering unique tweaks for labels, hues, and add-ons. Grouped by complexity, it supports from simple overviews to advanced composites. Here`s a feature-focused overview to guide your usage.
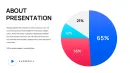
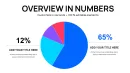
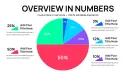
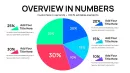
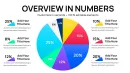
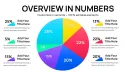
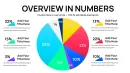
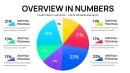
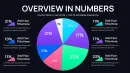
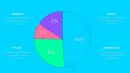
Basic Segment Pies (Slides 1-5)
Start with fundamental divisions, equipped with auto-scaling labels for quick ratio displays. Swap colors to align with themes, perfect for initial project overviews.
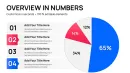
Advanced Explosion Designs (Slides 6-10)
Emphasize outliers by detaching sections, with variable pull-out controls. Layer notes for deeper context in analytical reports.
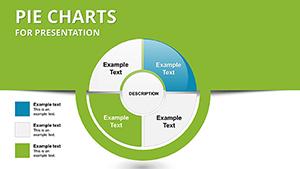
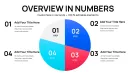
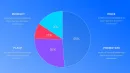
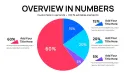
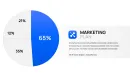
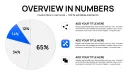
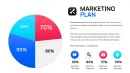
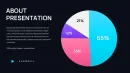
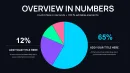
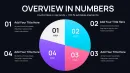
Ring-Style Doughnuts (Slides 11-15)
Central space for key metrics or graphics, adjustable widths for emphasis. Integrate for hybrid views in training materials.
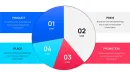
Dimensional 3D Options (Slides 16-20)
Elevate visuals with shadow effects, tiltable for optimal viewing. Icon placements enhance thematic ties in policy documents.
Hierarchical Nests (Slides 21-25)
Embed sub-categories within mains, scalable for intricate structures like organizational hierarchies.
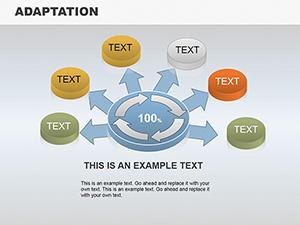
Dynamic Trend Integrations (Slides 26-30)
Add directional indicators for evolution tracking, customizable for scenario planning.
Composite and Custom Builds (Slides 31-34)
Mix elements for bespoke visuals, supporting unique data narratives.
How Experts Deploy This Pie Chart Set
In consulting engagements, these slides clarify client deliverables by segmenting scopes. Educational workshops leverage the variety for interactive concept teachings, while government analyses use them for transparent fiscal explanations.
Tech teams apply in product roadmaps to denote feature priorities, enhancing stakeholder buy-in.
Fitting into Presentation Processes
Compatible with PowerPoint 2016+, Keynote, and Google Slides, it integrates without hitches. Pull data from spreadsheets, refine aesthetics swiftly, and deploy in tight timelines—a staple in my investor prep routines.
Cloud compatibility aids team reviews, maintaining integrity across devices.
Practical Examples from Professional Settings
- Consultants: Analysis reports segment advisory services.
- Managers: Team updates detail performance metrics.
- Educators: Course outlines break down module weights.
- Founders: Partner pitches illustrate equity distributions.
- Analysts: Insight decks highlight variance factors.
Template Comparison Overview
| Feature | This Collection | Standard Software Defaults | Custom Creation | Other Packs |
|---|---|---|---|---|
| Slide Count | 34 diverse options | 1-2 basic types | As needed, labor-intensive | 10-20 generalized |
| Edit Flexibility | Intuitive and extensive | Limited tools | Full, but slow | Moderate restrictions |
| Efficiency Gain | Significant for complex needs | Low | Negative | Variable |
| Design Quality | Expert-level for analysis | Basic | User-dependent | Decent but broad |
Opt for this to enhance your deck-building efficiency.
Applications in Various Sectors
- Finance: Investment breakdowns with hierarchical views.
- Technology: Feature priority rings in launches.
- Healthcare: Funding source explosions in education.
- Education: Student demographic nests in projects.
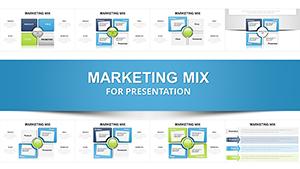
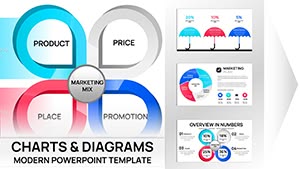
- Marketing: Channel performance trends in strategies.
- Consulting: Deliverable ratios in reports.
Embrace this collection for superior data portrayal.
Frequently Asked Questions
What`s the best way to edit these pie charts?
Access the data pane, input values, and modify visuals through intuitive menus. This setup supports rapid changes, fitting corporate branding seamlessly across compatible software.
Will it work in Keynote?
Certainly, export and edit without loss of functionality. It`s optimized for cross-platform use, handy for mixed-team environments.
Which scenarios suit doughnut variations?
When central summaries add value, like overall totals amid parts. Limit to clear, non-overlapping data for maximum impact.
How to incorporate trends in pies?
Overlay elements via shape tools, aligning with segments for visual flow. This elevates static data in dynamic contexts.
Is Excel integration available?
Yes, embed links for real-time refreshes, essential for ongoing analyses in professional workflows.