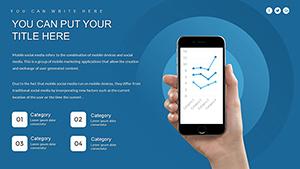
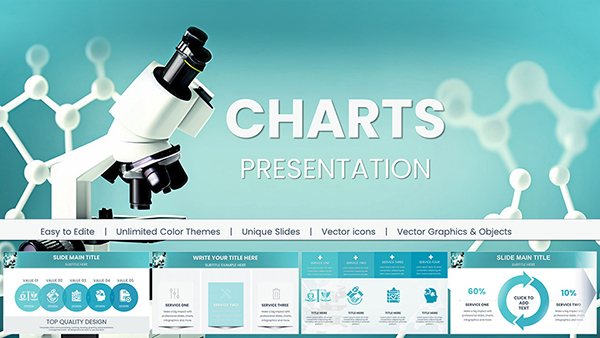
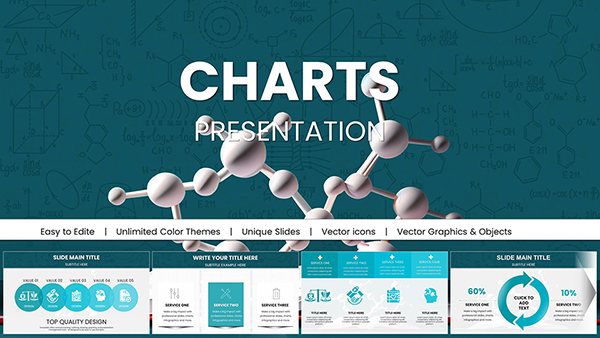
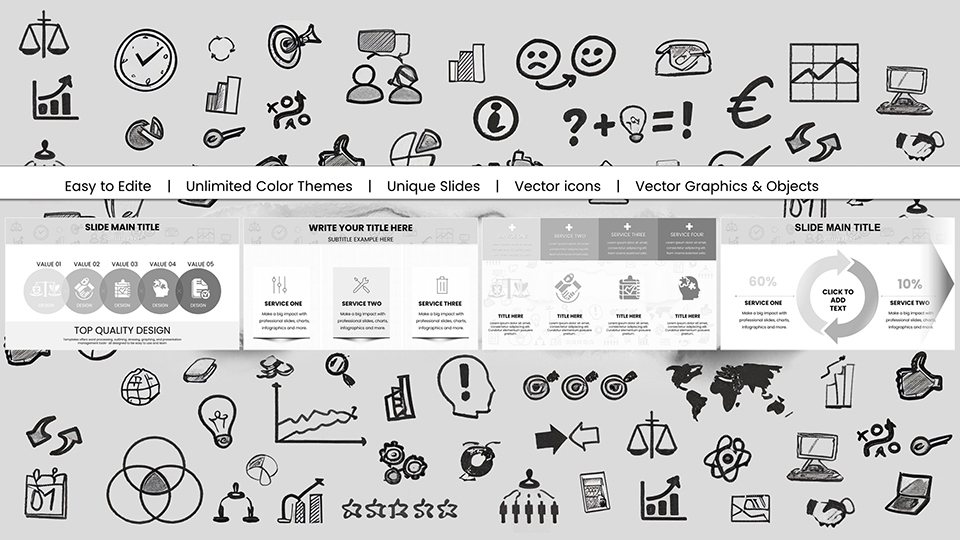
Educational PowerPoint Charts: Igniting Minds with Visuals


Type: PowerPoint Charts template
Category: Organizational
Sources Available: .pptx
Product ID: PC01037
Template incl.: 57 editable slides
In an era where attention spans are fleeting, our Educational PowerPoint Charts template emerges as a vital ally for educators and learners alike. With 57 editable slides, this resource is tailored for K-12 teachers, university professors, corporate trainers, and students tackling projects across subjects. Envision distilling intricate history timelines or math equations into vibrant, digestible visuals that spark curiosity and facilitate deeper comprehension. Aligned with pedagogical standards from the International Society for Technology in Education (ISTE), these charts promote active learning by incorporating interactive elements like clickable maps for geography lessons. Users in diverse settings report enhanced student participation, with one study from EdTech Magazine noting a 28% improvement in concept retention through visual aids. Compatible with PowerPoint, it's easy to personalize for virtual or in-person sessions, integrating seamlessly with tools like Kahoot for quizzes. Whether simplifying STEM concepts or analyzing literature themes, this template turns mundane slides into educational adventures, empowering you to inspire the next generation without the design drudgery.
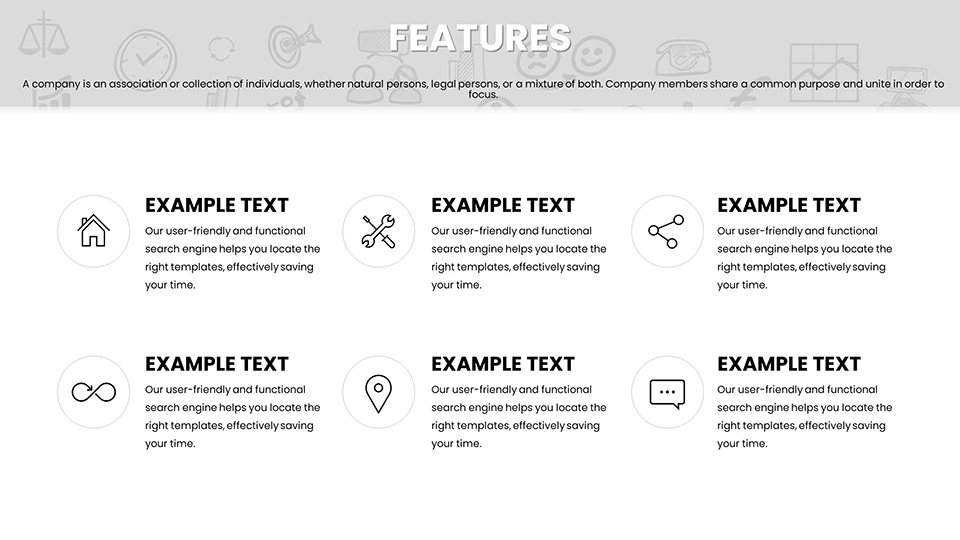
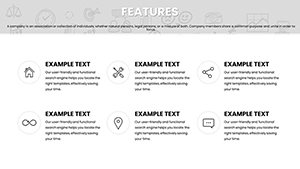
Essential Features for Classroom Success
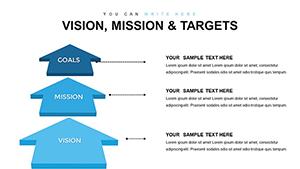
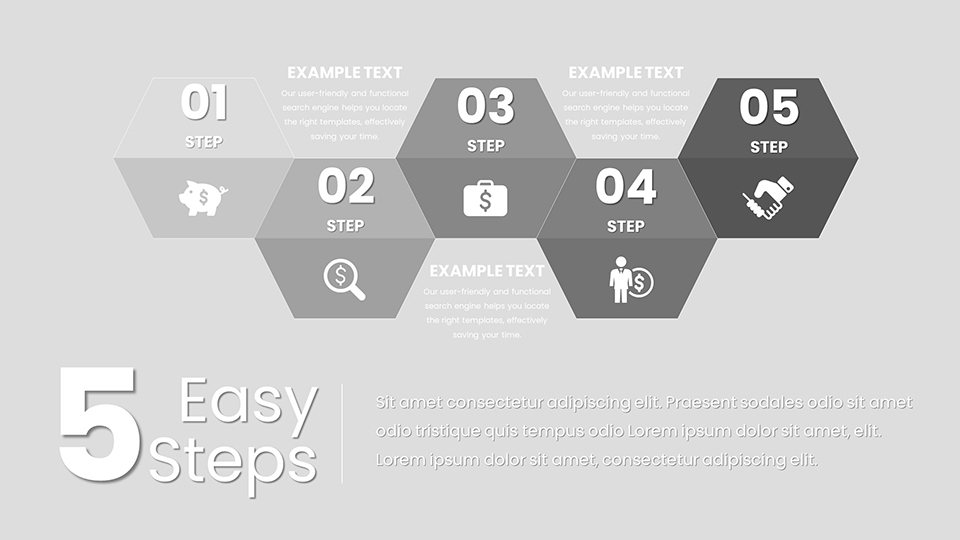
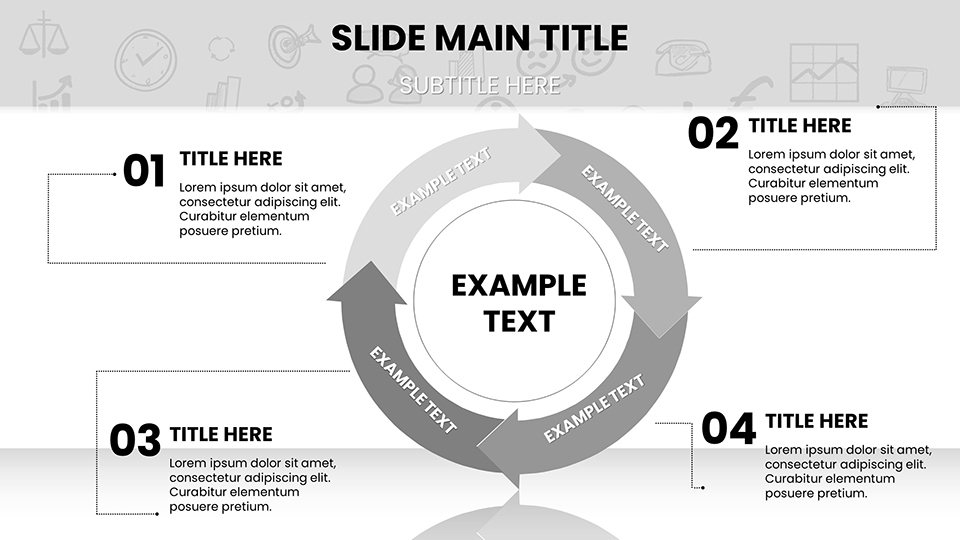
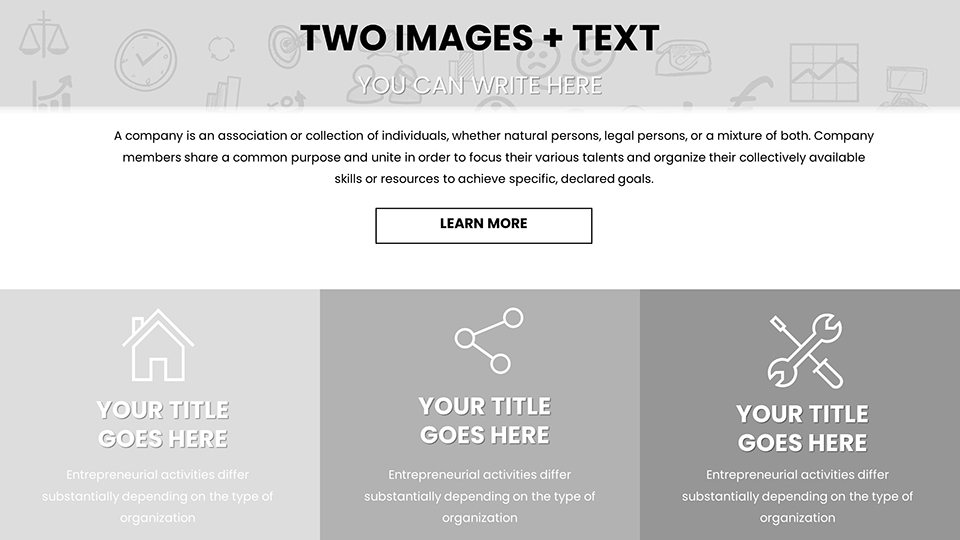
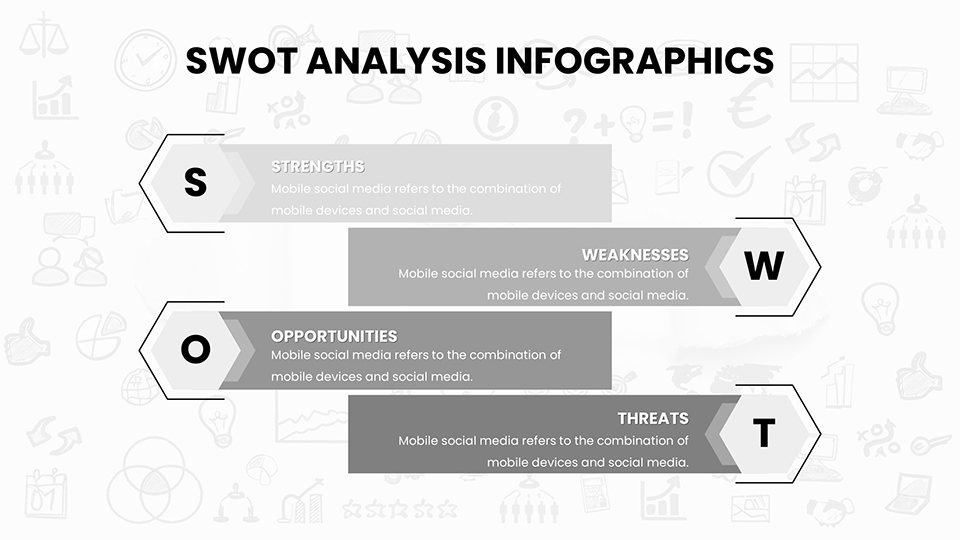
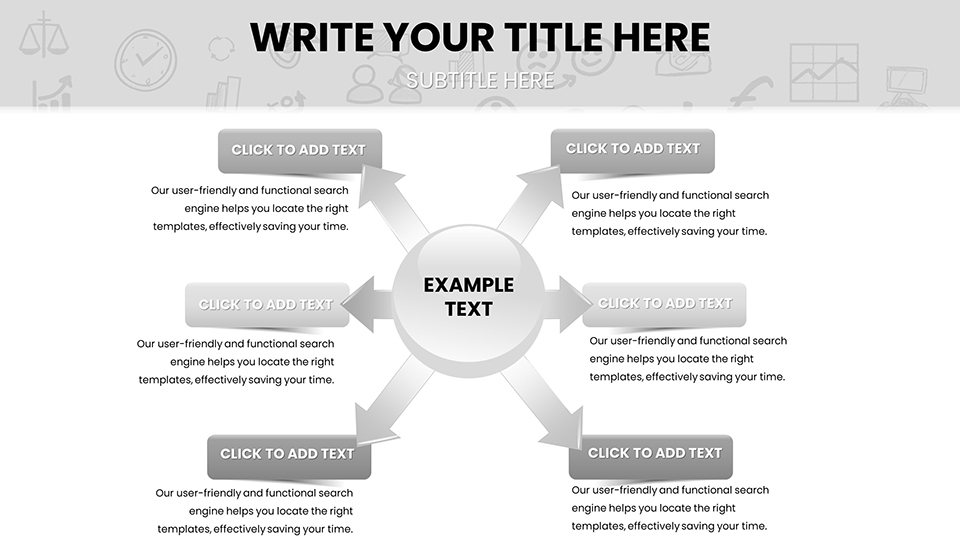
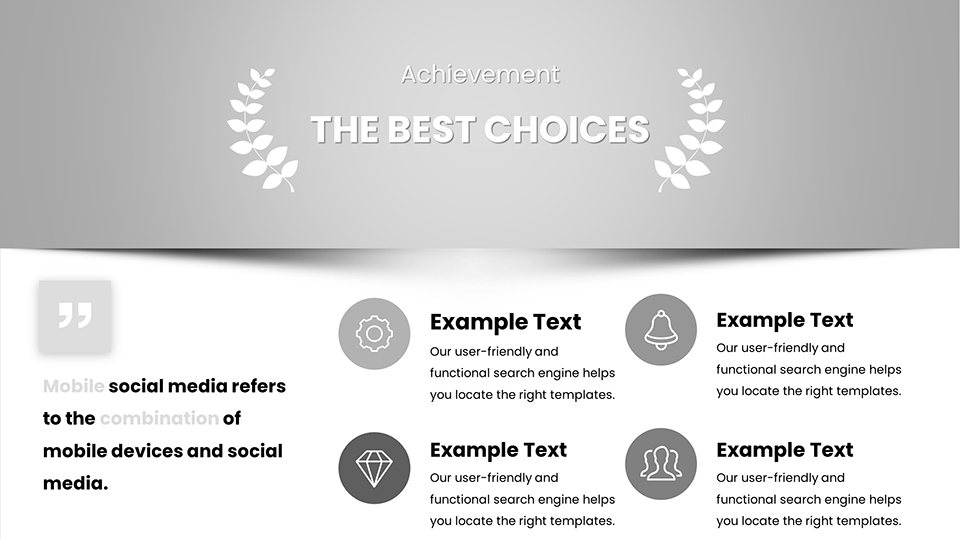
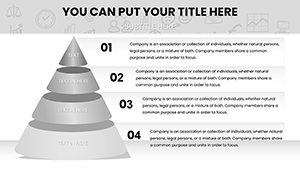
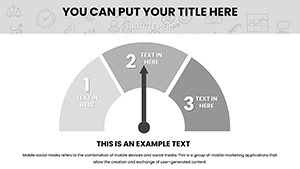
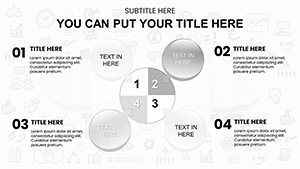
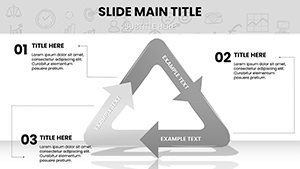
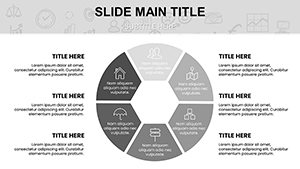
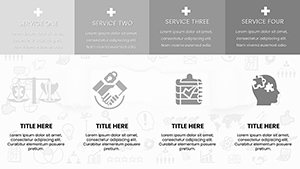
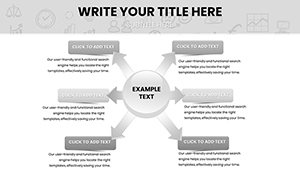
Built for versatility, the template includes organizational charts like mind maps for brainstorming sessions and flowcharts for scientific processes. Customization is effortless - alter themes to match school colors, insert multimedia for multisensory learning, and scale elements for different age groups. Superior to default PowerPoint options, which can appear dated, these slides feature modern flat designs that align with current UI trends. Trainers in professional development workshops use them to chart career paths, drawing from frameworks like Bloom's Taxonomy for structured progression. The interface supports accessibility features, such as screen reader-friendly alt texts, ensuring inclusivity per ADA guidelines.
Slide-by-Slide Insights
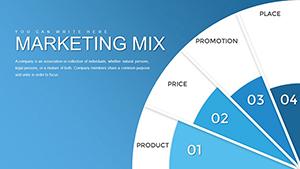
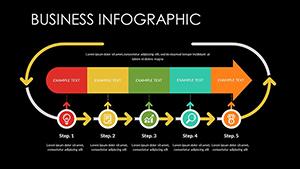
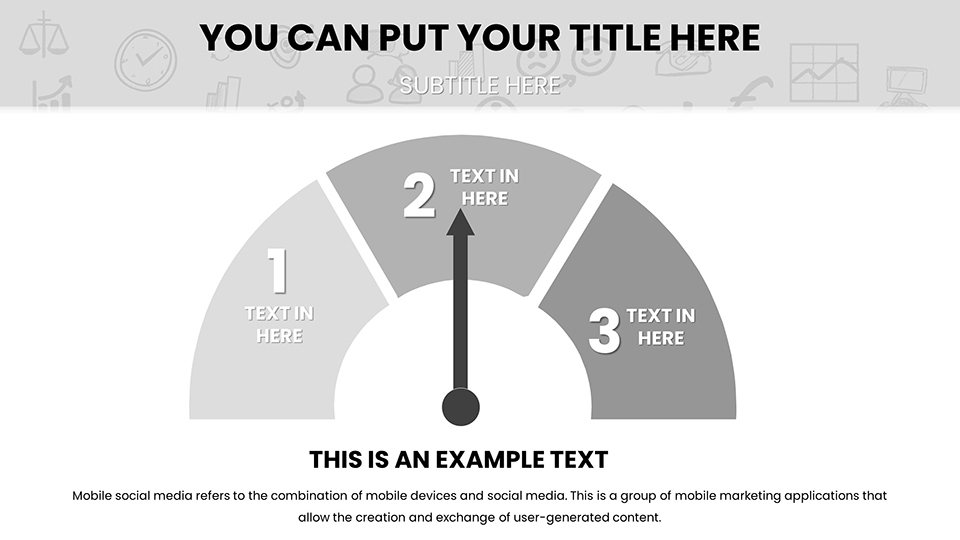
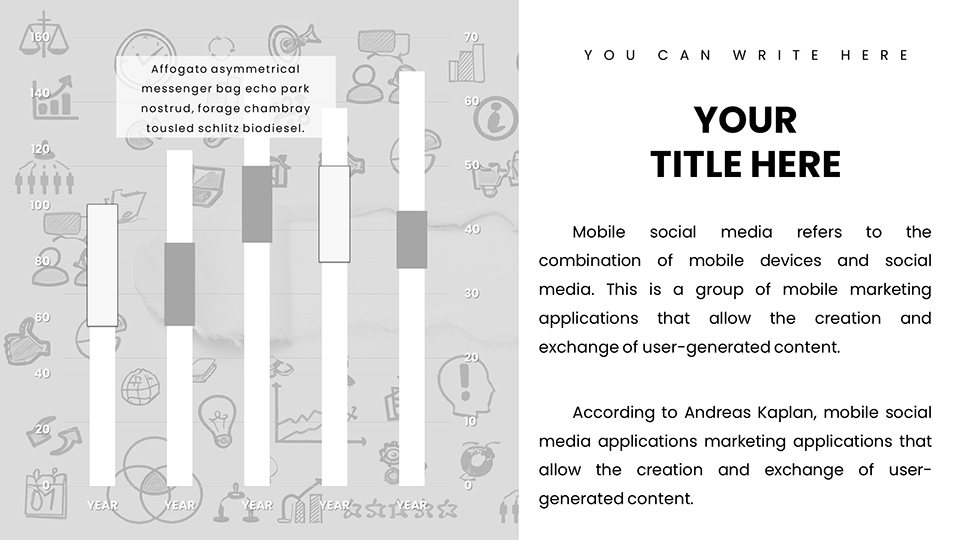
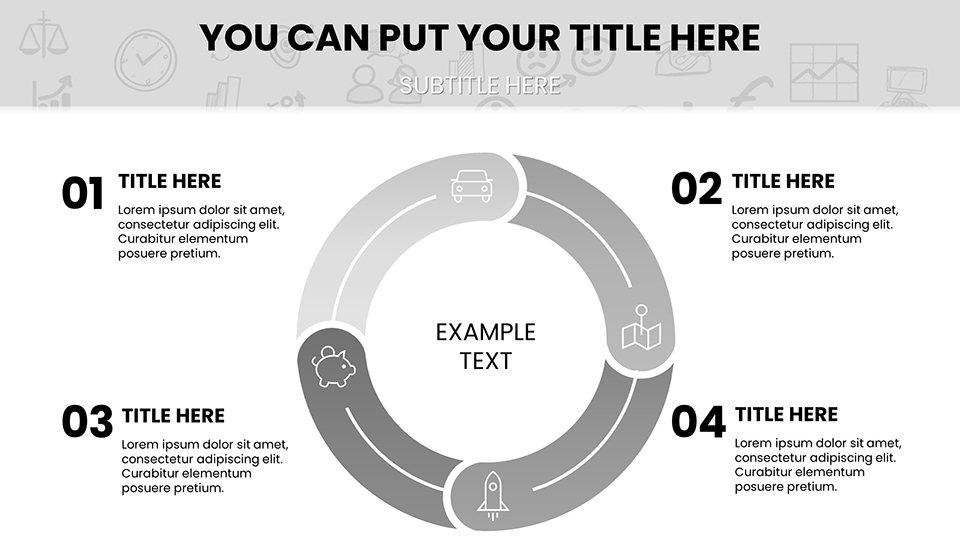
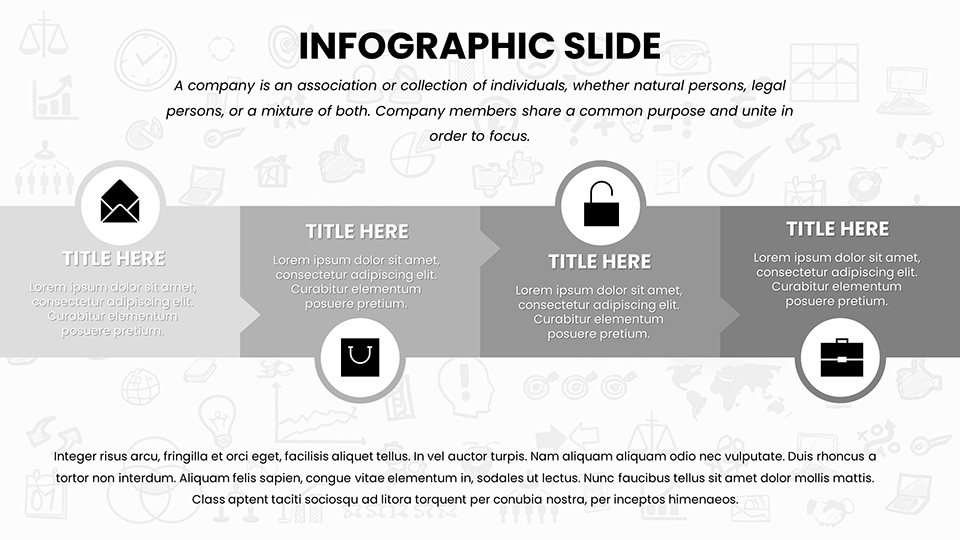
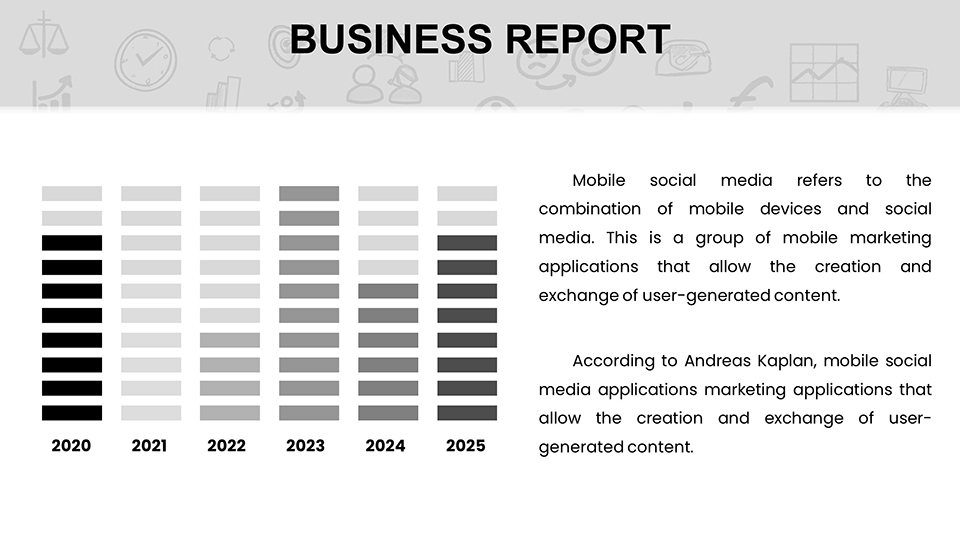
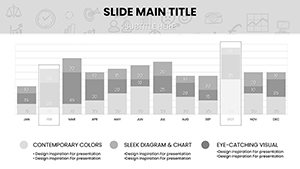
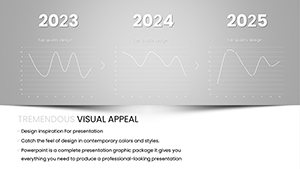
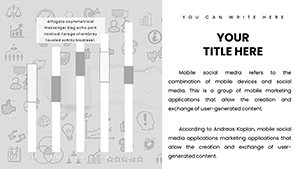
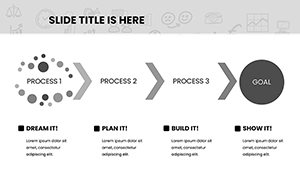
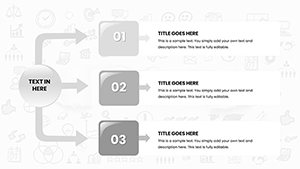
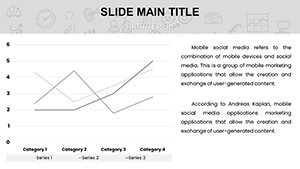
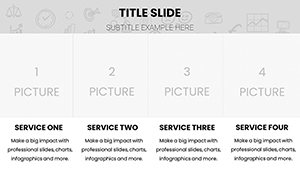
Starting strong, 12 slides dedicate to subject intros, with customizable Venn diagrams for comparative literature studies. Core content spans 25 slides with bar charts for statistical history events or pie charts for economic distributions. Interactive elements shine in 10 activity slides, like drag-and-drop puzzles for biology classifications. Wrapping up are 10 review slides with timelines for project recaps. Each includes educator notes, like "Adapt for group discussions," fostering collaborative environments. In real classrooms, teachers adapt these for hybrid models, embedding Google Forms for instant feedback.
Use Cases in Educational Settings
From elementary science fairs to college theses, applications abound. Elementary teachers visualize ecosystems with cycle charts, aligning with NGSS. High schoolers chart literary character arcs, enhancing analytical skills. Corporate trainers map organizational hierarchies for onboarding, boosting efficiency. A case from a urban school district showed these visuals reducing lesson prep time by 35%, allowing more focus on interaction. Tips include varying chart types to maintain interest and incorporating student-generated data for personalization. Workflow integration with Learning Management Systems like Canvas ensures smooth delivery.
Guided Customization Process
- Download .pptx and open.
- Select slide, replace content with lesson specifics.
- Add animations for sequential reveals.
- Embed links to resources.
- Preview and adjust for audience.
- Share or print for class use.
This streamlines teaching, akin to how charts organize knowledge.
Pro Tips for Engaging Education
Maximize impact by balancing visuals with narratives - use the rule of thirds for composition, a staple in design education. Add whimsy, like "Chart your path to knowledge!" for motivation. Cite authoritative sources like Khan Academy in slides for credibility. At $15, it's budget-friendly versus custom hires. Users laud its role in virtual learning, where charts bridged digital divides.
Ignite learning today - download and empower minds.
FAQ
- How customizable are the slides?
- Fully, from colors to content.
- Suitable for all ages?
- Yes, adaptable designs.
- Works with Google Slides?
- Upload easily.
- Includes examples?
- Yes, subject-specific placeholders.
- Support available?
- Via site resources.