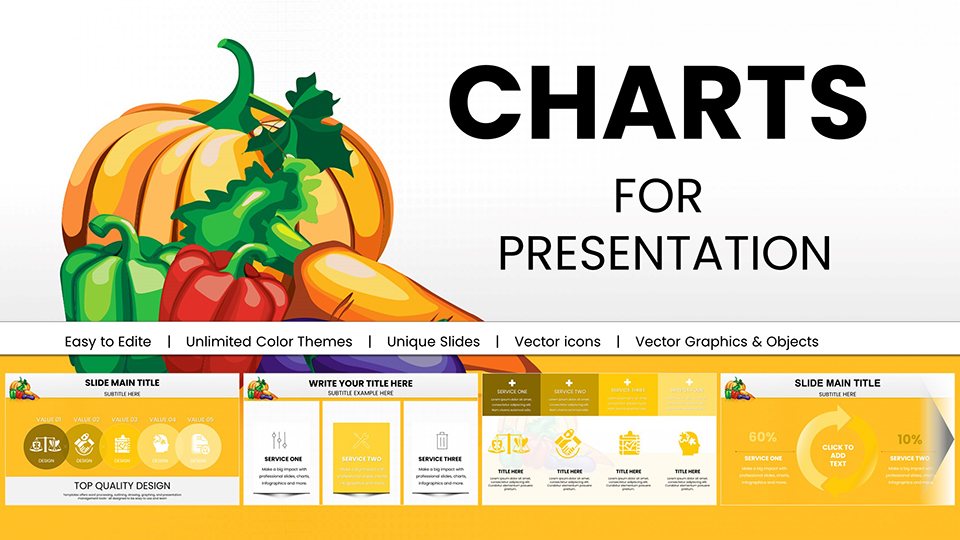
Vitamin A Carotenoids Presentation Charts Template


Type: PowerPoint Charts template
Category: Medicine - Pharma
Sources Available: .pptx
Product ID: PC00949
Template incl.: 59 editable slides
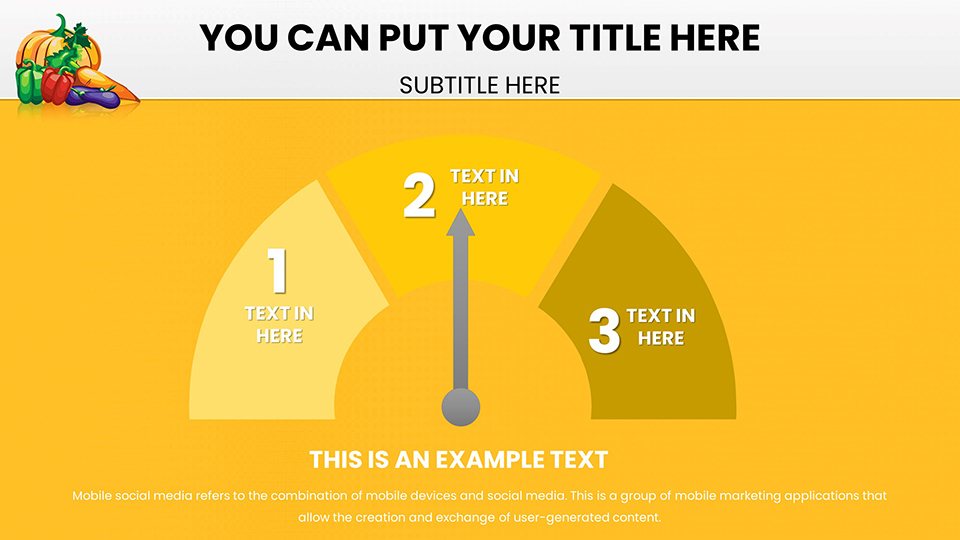
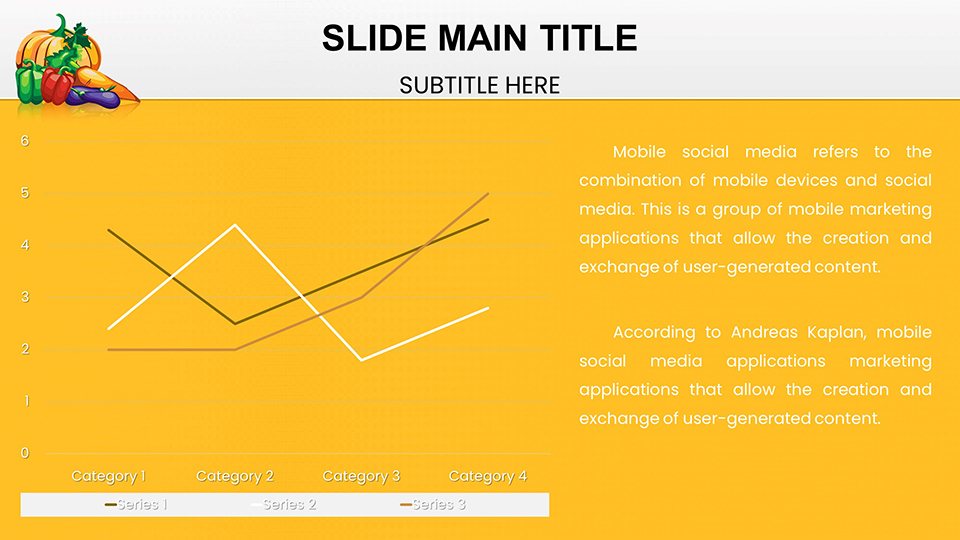
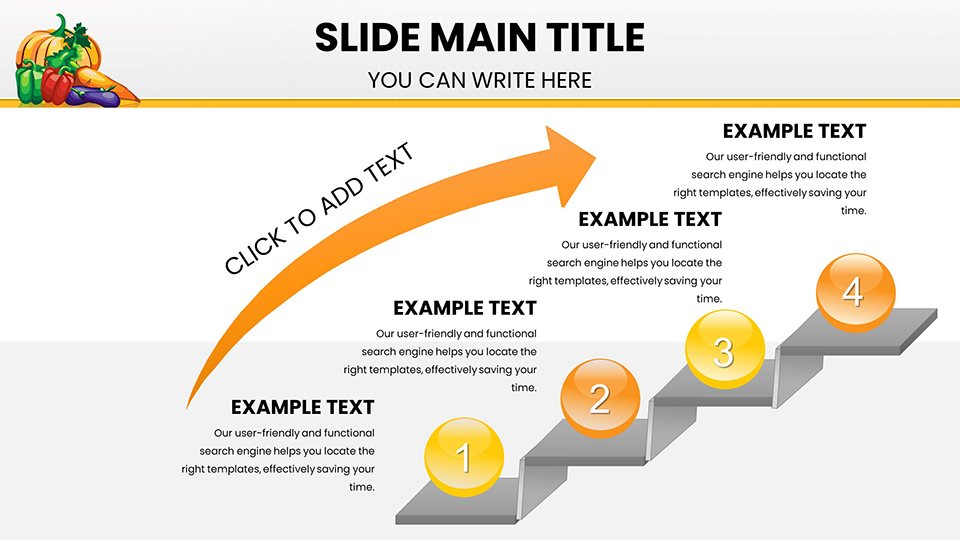
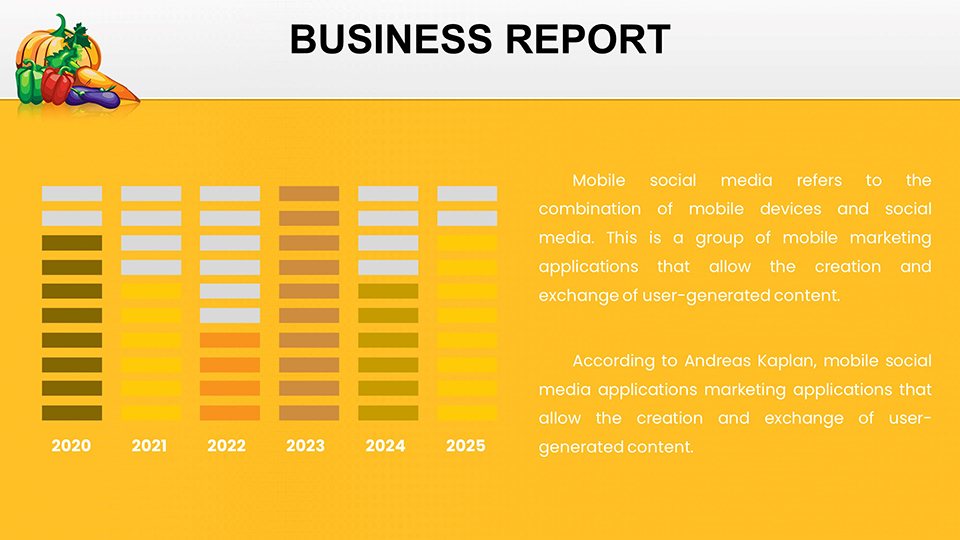
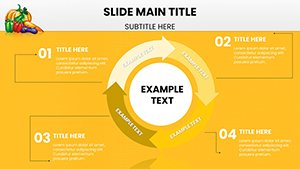
Picture this: You're prepping for a class project or client meeting, and you need to make Vitamin A's role in health pop off the screen. Enter our Vitamin A and Carotenoids Presentation Charts Template, a powerhouse of 59 editable slides designed to weave science into storytelling. For students tackling biology assignments or professionals outlining wellness strategies, these infographic-style charts simplify topics like provitamin A conversion in the gut. Use a funnel chart to depict the journey from dietary carotenoids to active retinol, making abstract processes vivid and memorable. Compatible with PowerPoint and Google Slides, it's the bridge between raw data and audience enlightenment, helping you deliver presentations that not only inform but ignite interest in nutritional science.
The Science Behind Vitamin A and Carotenoids
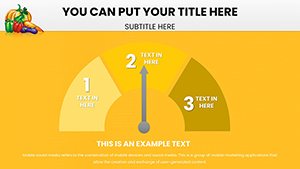
Vitamin A, sourced from animal products as retinol or plants as carotenoids, is pivotal for growth and immunity. This template unpacks these with sunburst charts showing source hierarchies and gauge meters indicating daily requirements per IOM (Institute of Medicine) standards. In an educational context, a student might adapt a slide to compare carotenoid levels in organic vs. conventional produce, referencing USDA organics research for credibility.
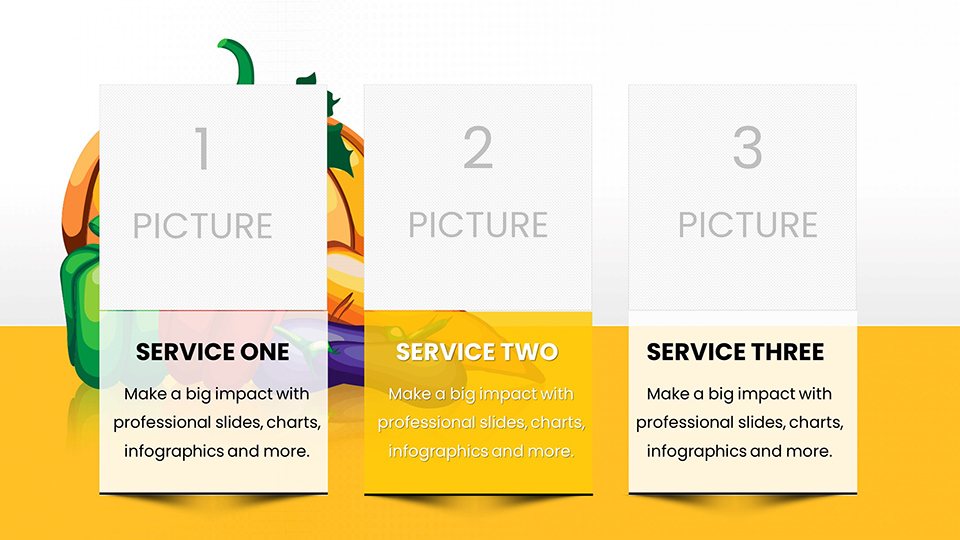
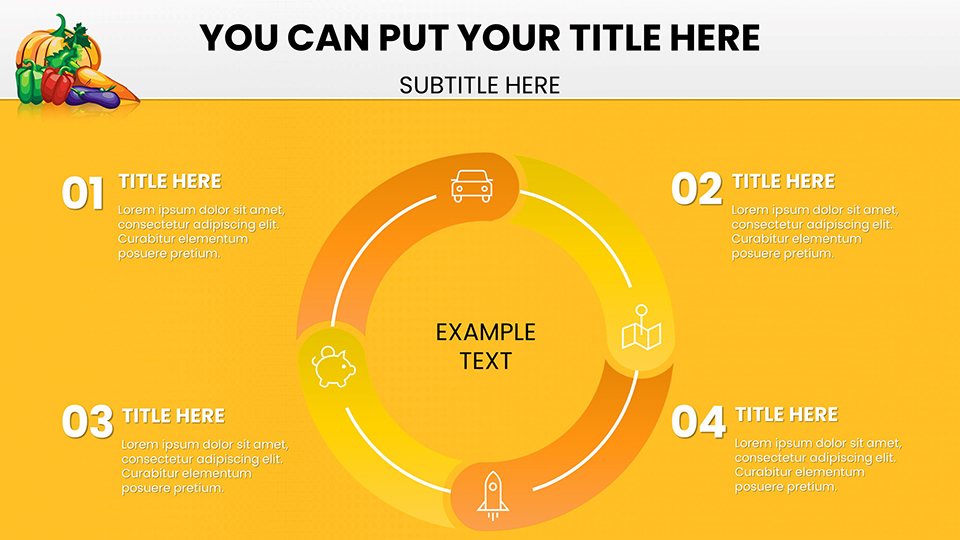
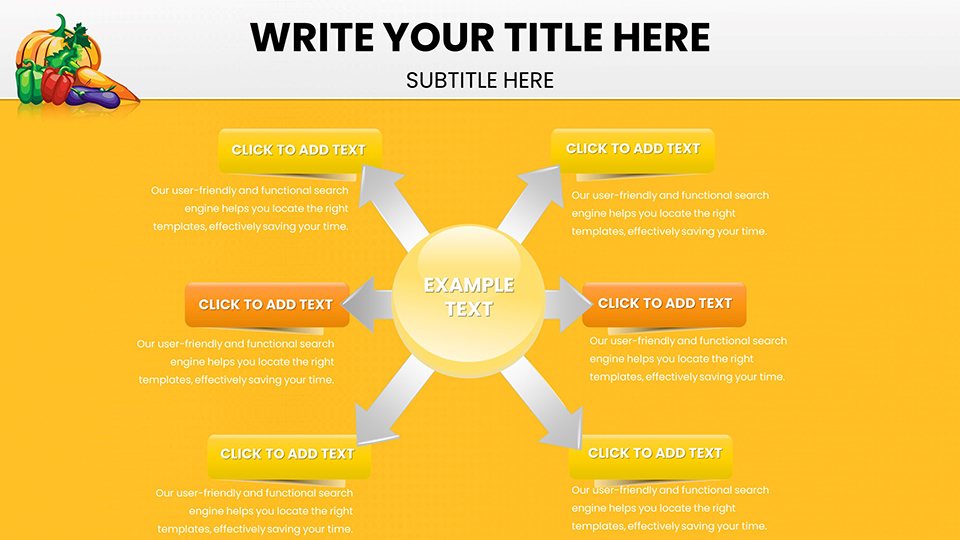
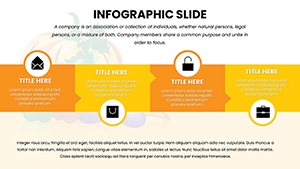
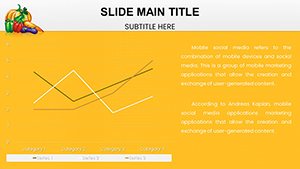
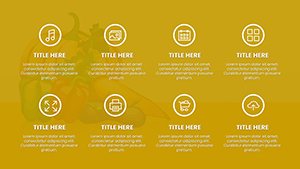
Engaging Infographics for Clarity
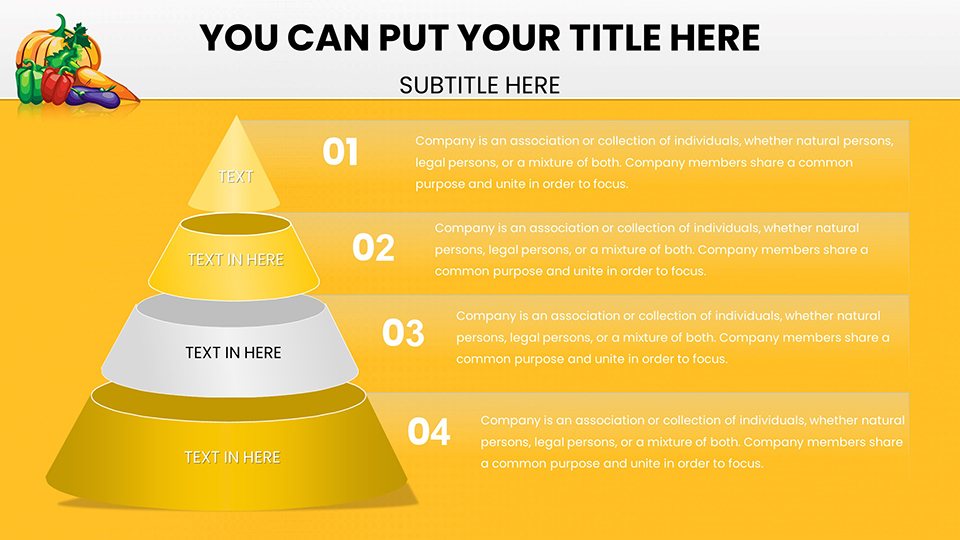
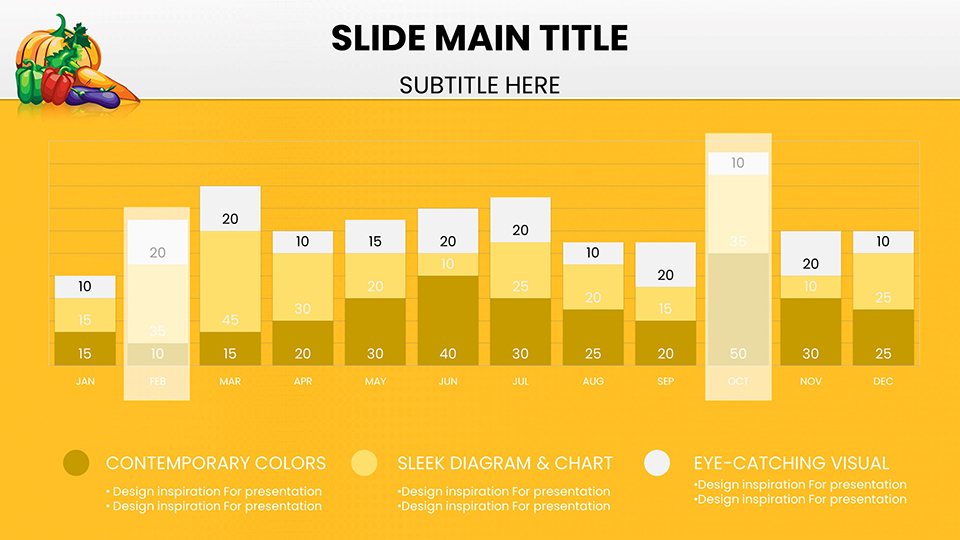
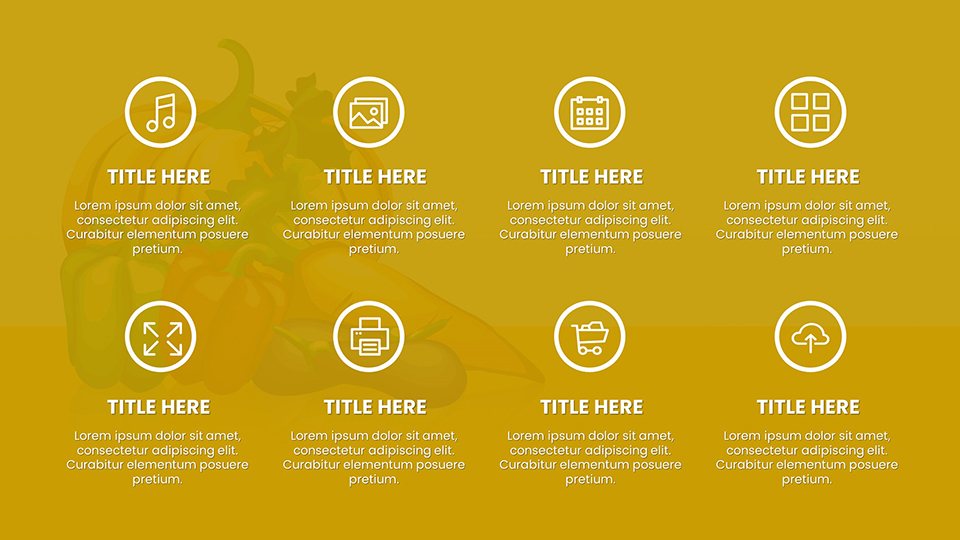
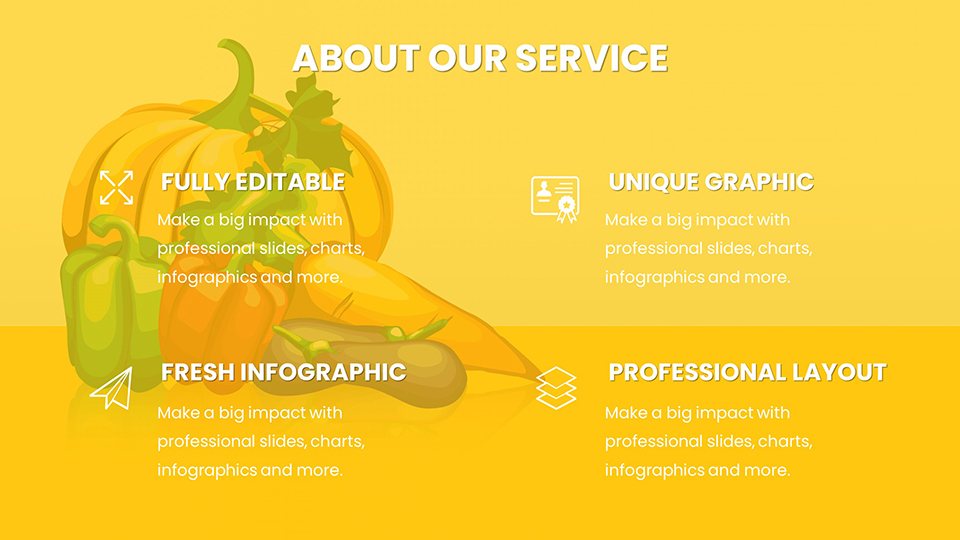
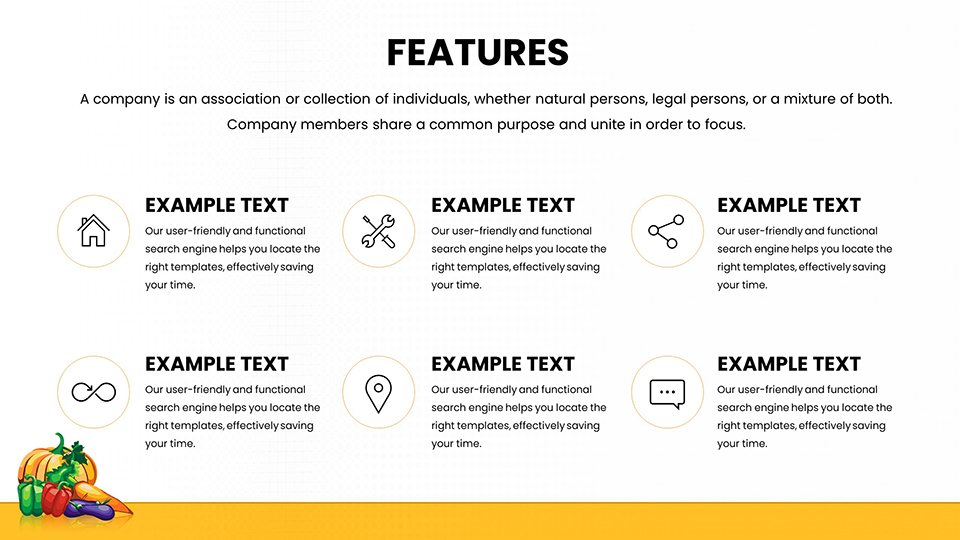
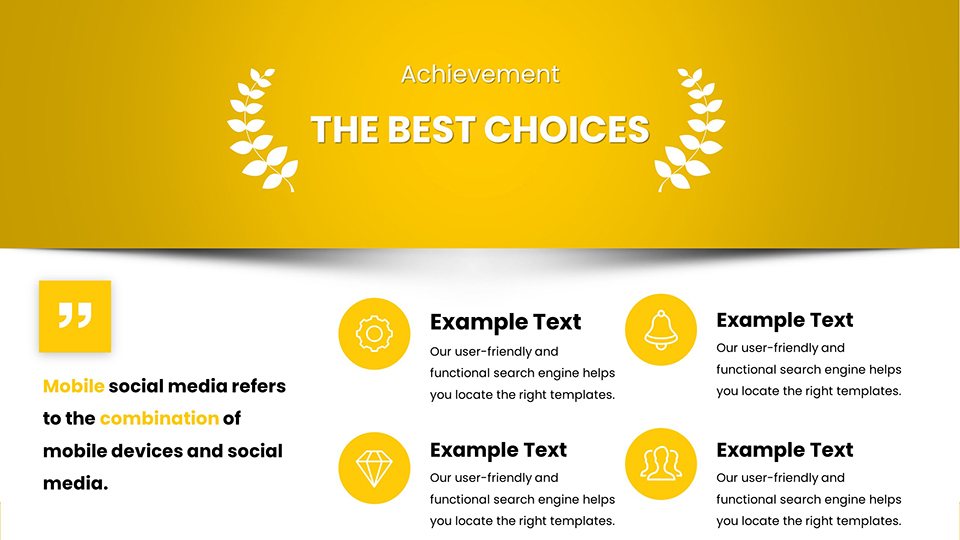
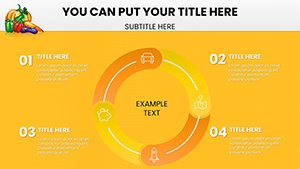
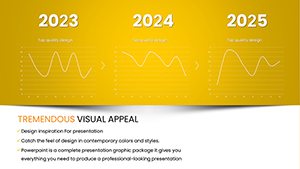
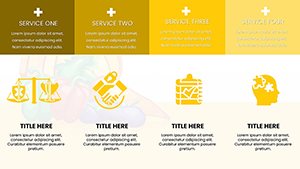
Infographics reign supreme here, with customizable elements like icon sets of fruits and veggies. Edit a pyramid chart to build a balanced diet model, or use polar area plots for seasonal availability. Colors are flexible - opt for warm oranges to symbolize carrots - ensuring visual harmony. This setup supports ADA-endorsed nutrition education, making complex info digestible for diverse learners.
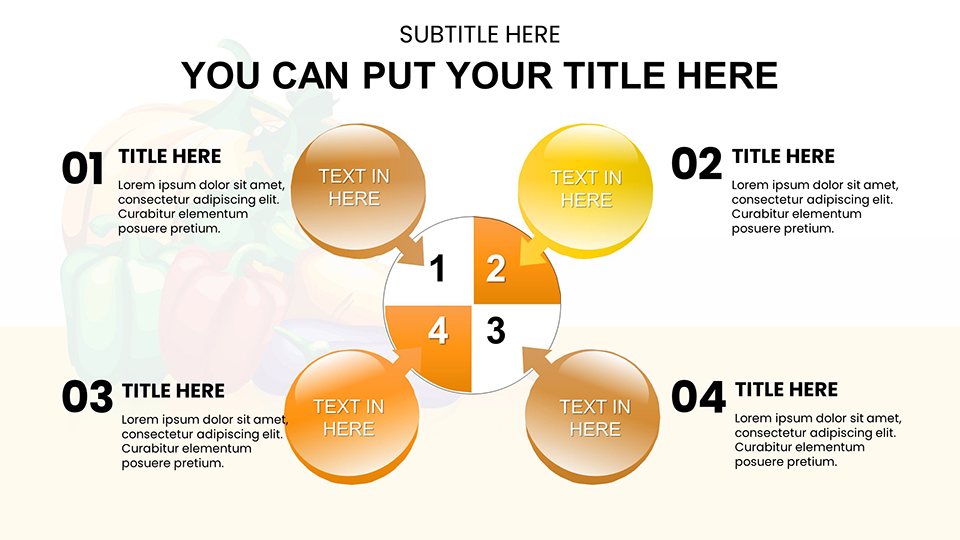
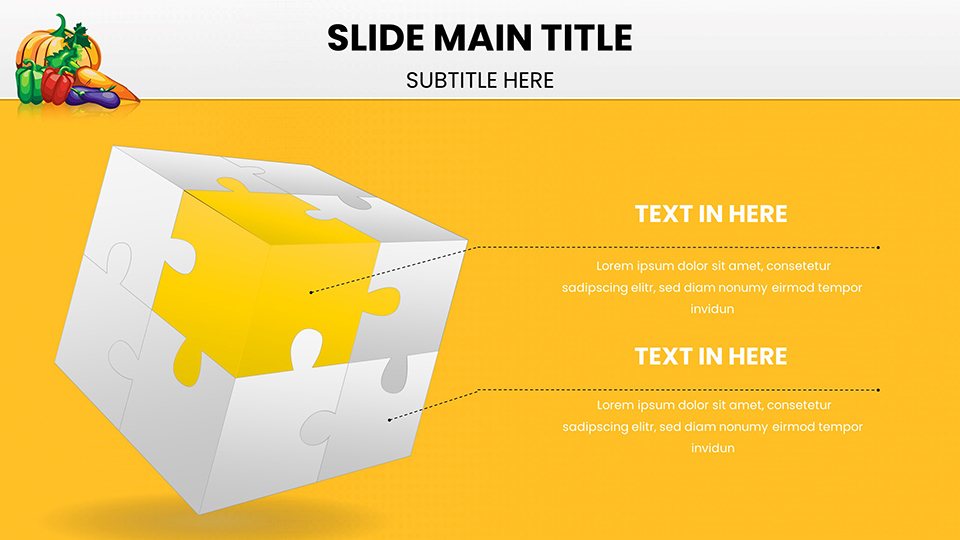
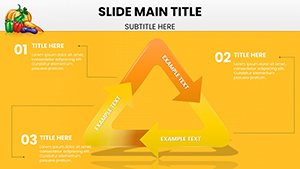
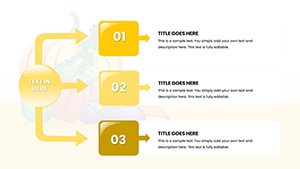
- Conversion Efficiency Diagrams: Visuals explaining beta-carotene to Vitamin A ratios.
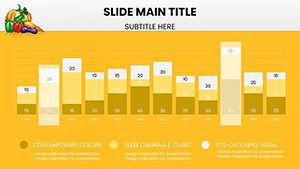
- Toxicity Risk Bars: Graphs warning on hypervitaminosis A from over-supplementation.
- Global Nutrition Maps: Heatmaps of deficiency prevalence worldwide.
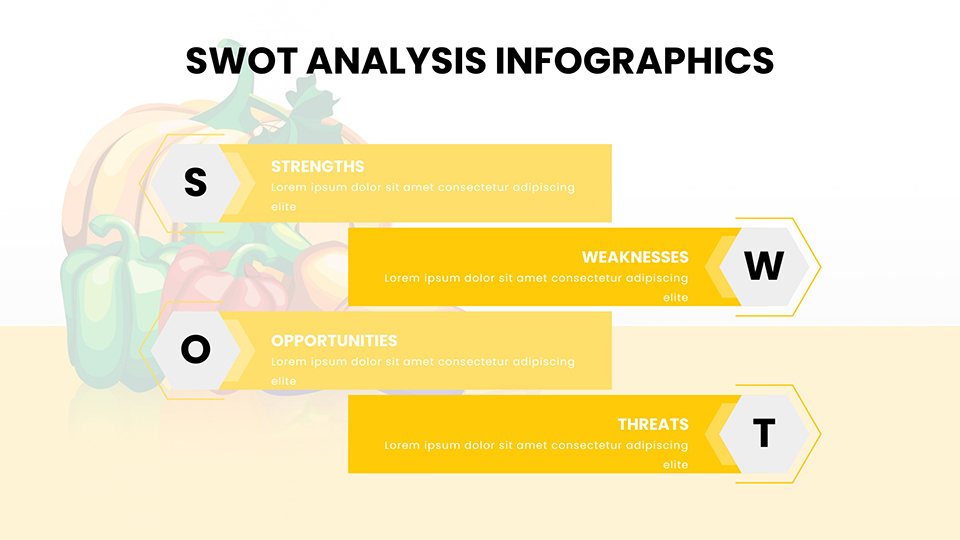
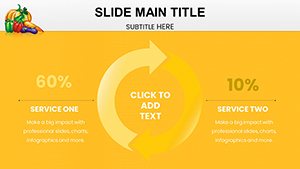
Versatile Applications for Users
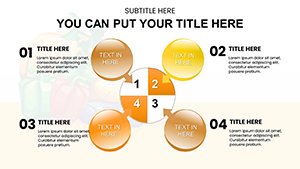
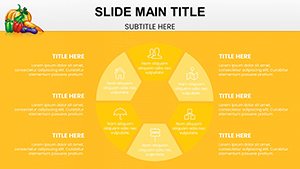
Students can leverage it for theses on vision health, while educators craft interactive lessons. Professionals in marketing might use doughnut charts to showcase supplement benefits, boosting campaign ROI as seen in industry case studies. The template's value lies in solving common hurdles like data overload, offering streamlined visuals that enhance retention.
Integration and Customization Guide
Seamless workflow: Open in Google Slides for group edits, input custom data from sources like NIH, and apply transitions for flow. For a business report, embed charts into broader decks, maintaining consistency.
- Plan your narrative: Outline key carotenoid facts.
- Populate with data: Use real stats for authenticity.
- Polish and present: Add notes for speaker guidance.
Benefits Tailored to Your Journey
For students, it's a grade-booster; for pros, a client-winner. Imagine a educator's feedback loop improving after using these for workshops, per pedagogical reviews. Trust is built through accurate, sourced visuals, embodying in every slide.
Wrapping Up with Impact
Ultimately, this template empowers you to present with confidence, turning data into dialogue on health.
Elevate your next session - secure this carotenoids charts template and shine.
Frequently Asked Questions
How many slides are editable?
All 59 slides are fully customizable for your needs.
Works with Google Slides?
Yes, perfect for collaborative editing.
Ideal for students?
Yes, great for projects and presentations.
Includes infographics?
Absolutely, with thematic icons and charts.
Any download limits?
No, unlimited use post-purchase.
Supports animations?
Yes, add dynamics easily in PowerPoint.