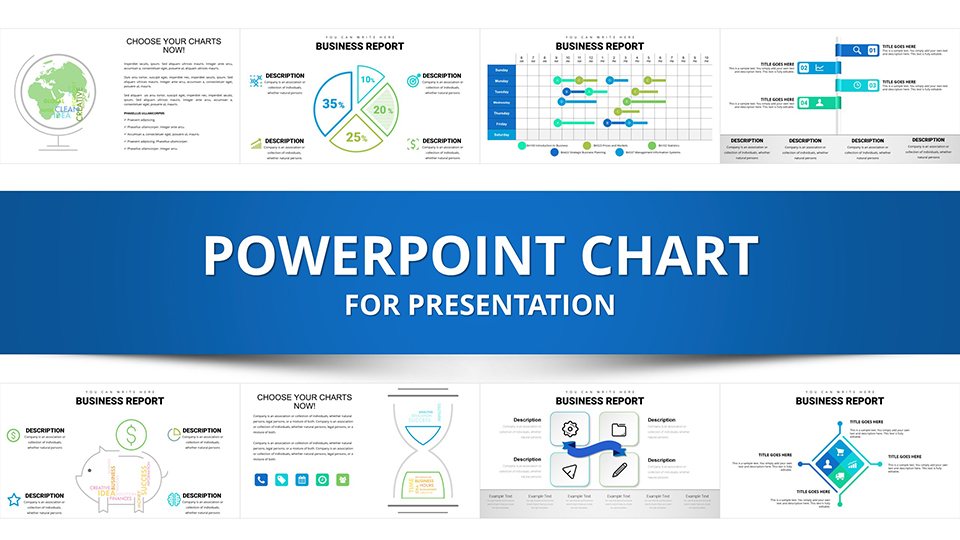
Business Analysis Solution PowerPoint Charts


Type: PowerPoint Charts template
Category: Business Models, Tables, Analysis
Sources Available: .pptx
Product ID: PC00941
Template incl.: 32 editable slides
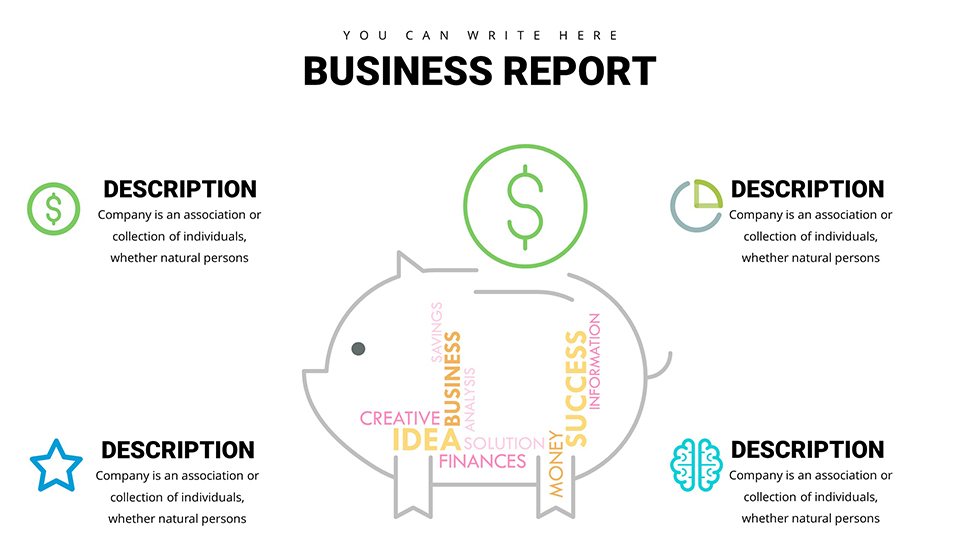
Navigating the complexities of business data requires more than spreadsheets; it demands visuals that turn numbers into narratives. Our Business Analysis Solution PowerPoint Charts template delivers just that - a suite of 32 editable slides crafted for analysts, consultants, and executives who thrive on data-driven strategies. Whether you're dissecting market trends, evaluating financial performance, or building business cases, these charts provide the clarity needed to influence decisions. Compatible with both PowerPoint and Google Slides, they facilitate easy collaboration across teams. Forget generic graphs; these are designed with business acumen in mind, incorporating elements like SWOT matrices, bar comparisons, and pie distributions that align with frameworks from sources like Harvard Business Review. Professionals in finance, marketing, and operations will find them invaluable for creating presentations that not only inform but inspire action. With instant customization, you can infuse your brand's essence, making each slide a reflection of your expertise. This template addresses common pain points, such as overwhelming data overload, by offering structured visuals that simplify complexity and highlight key insights.
Essential Features for Impactful Business Analysis
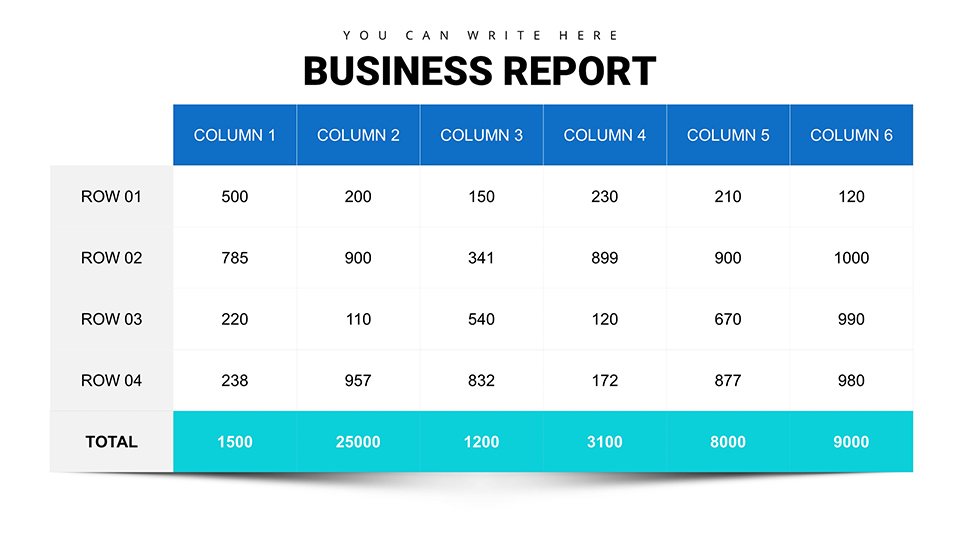
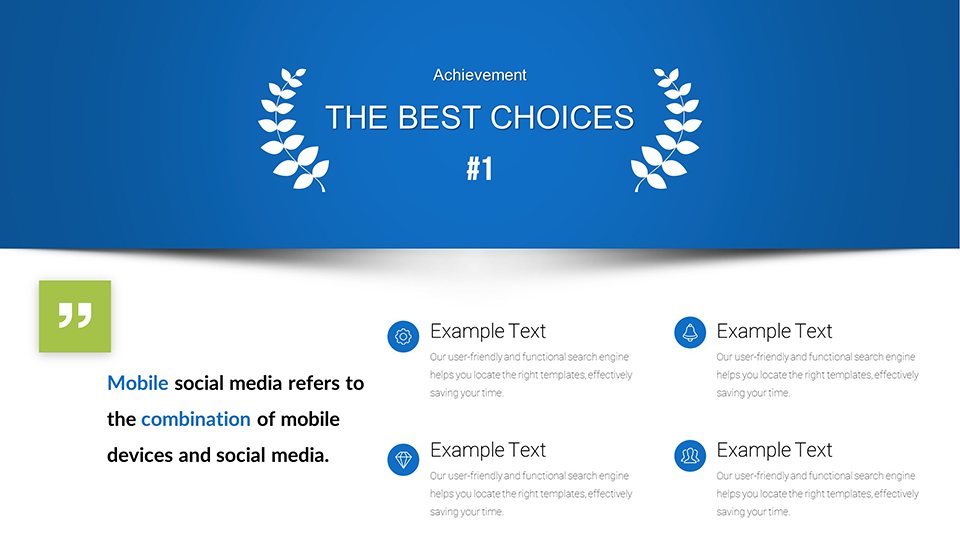
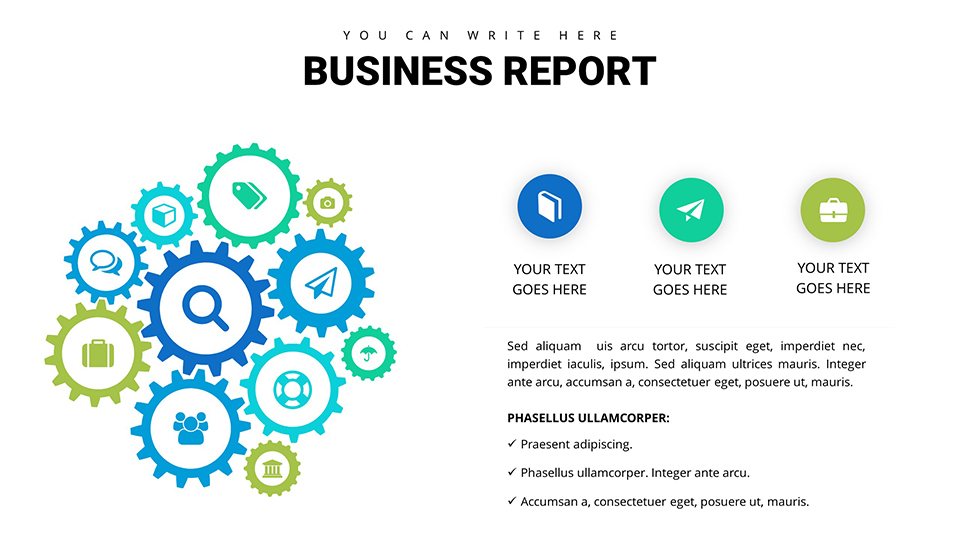
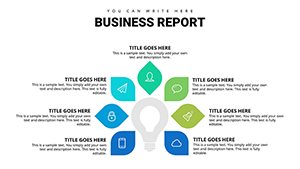
At the core of this template are features that empower precise communication. The 32 slides encompass a diverse array of chart types, ensuring versatility for any analytical task. High-quality PPTX files guarantee crisp visuals, while Google Slides compatibility supports cloud-based edits.
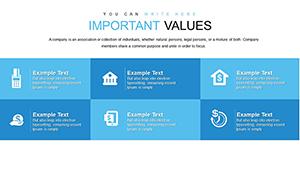
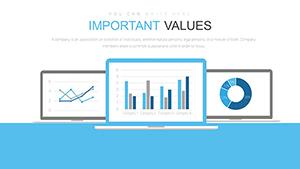
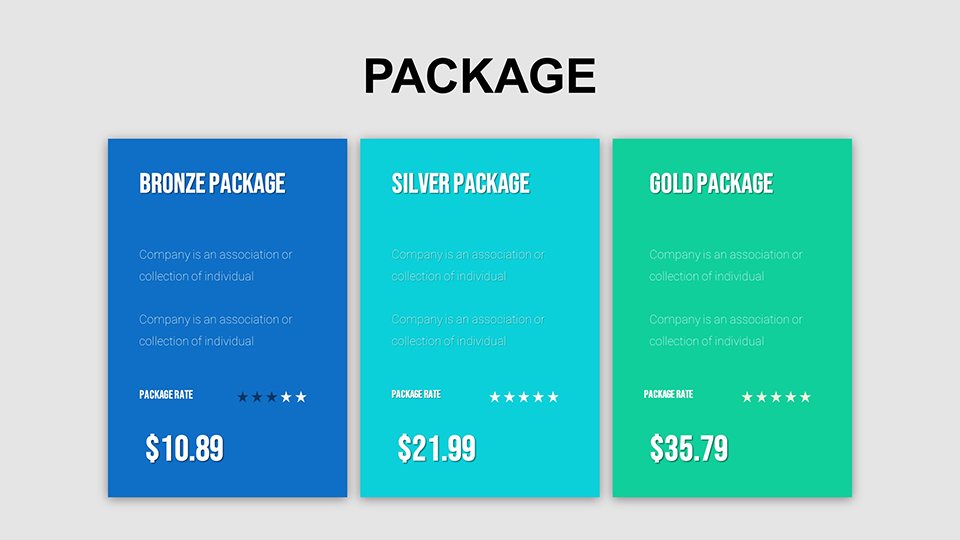
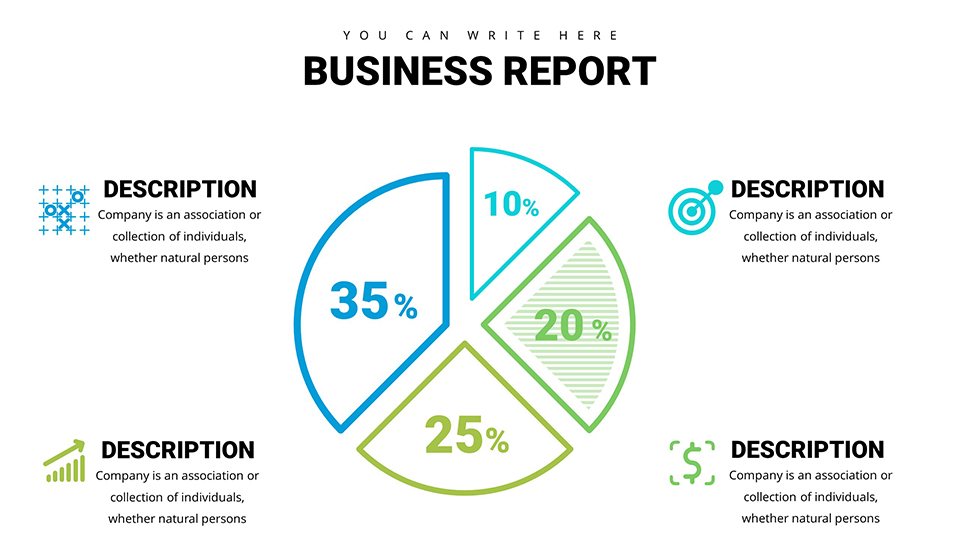
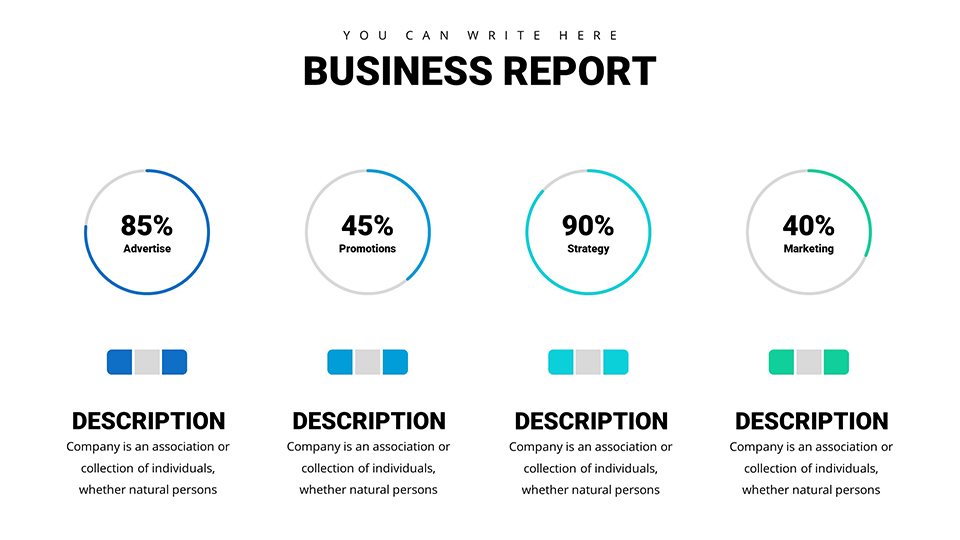
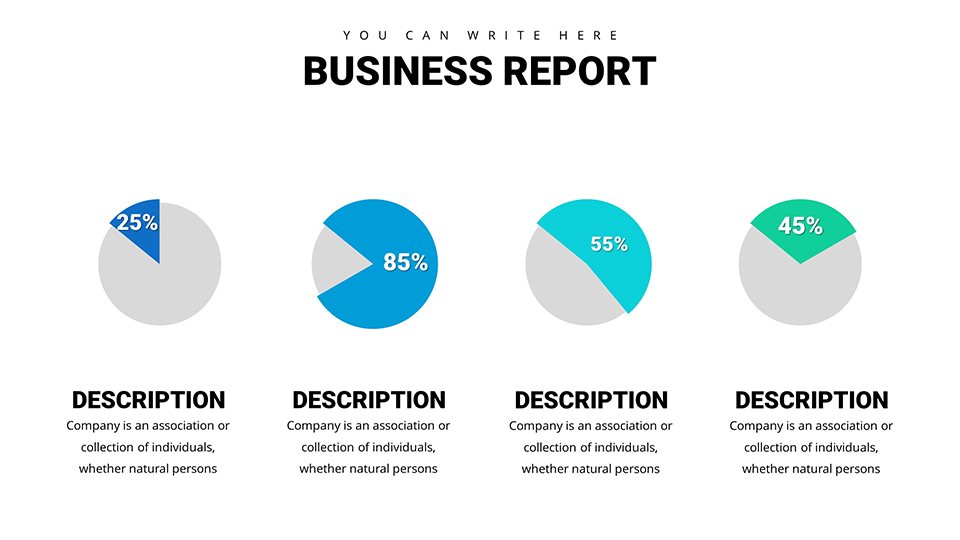
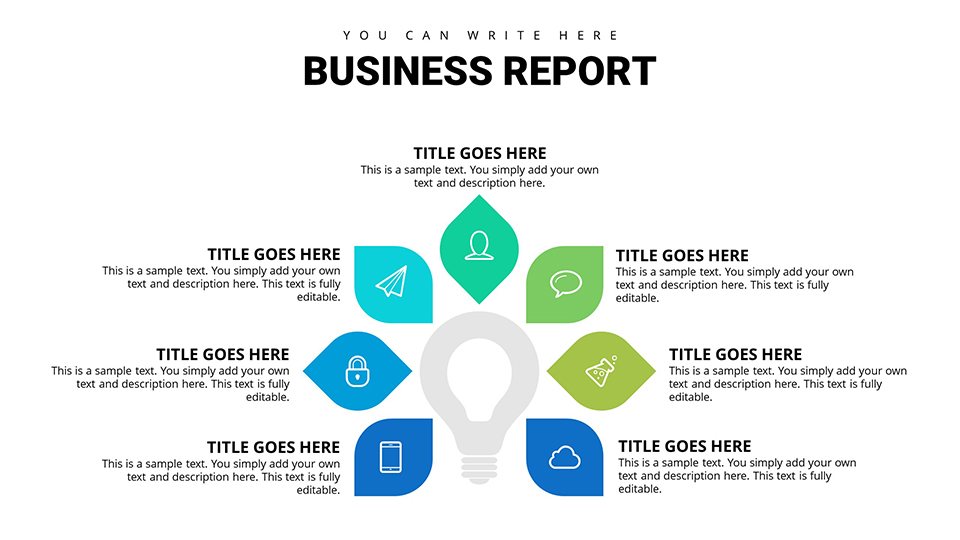
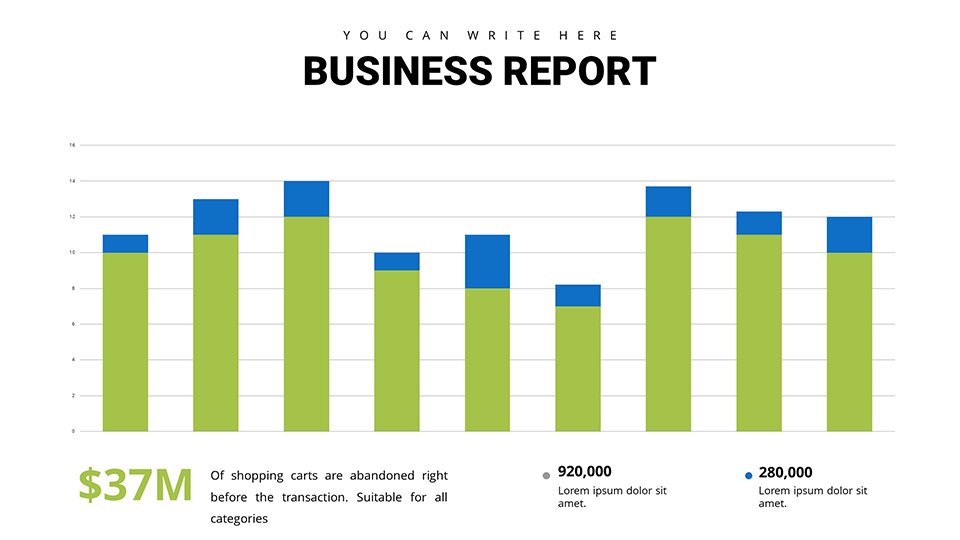
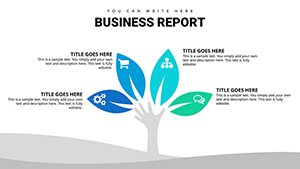
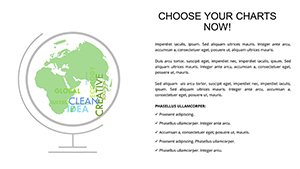
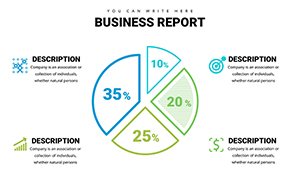
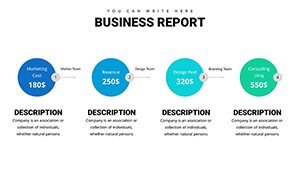
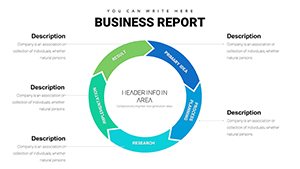
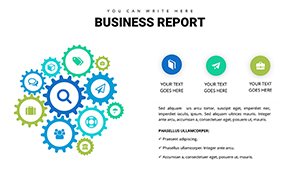
- Varied Chart Options: Bar, pie, and line graphs for multifaceted data representation.
- Data Integration: Easily import from Excel or Google Sheets for real-time updates.
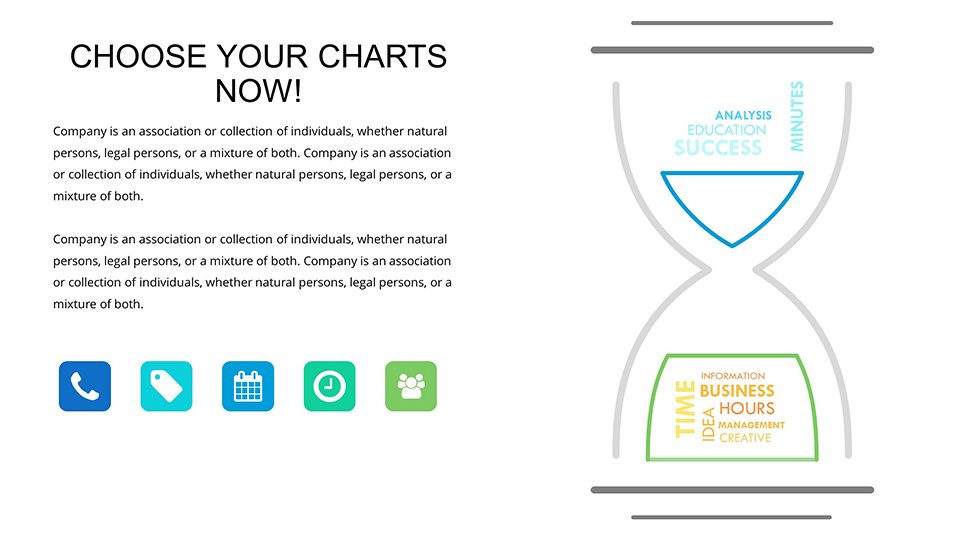
- Theme Customization: Adjust palettes to match corporate branding guidelines.
- Analytical Tools: Built-in for trend lines, forecasts, and variance analysis.
These draw from established business analysis standards, like those in the Business Analysis Body of Knowledge (BABOK), enhancing your presentations' credibility. A case study from a retail chain shows how using similar charts in quarterly reviews improved forecast accuracy by 25%.
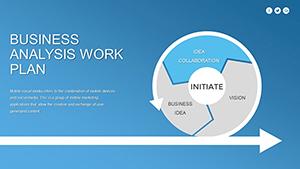
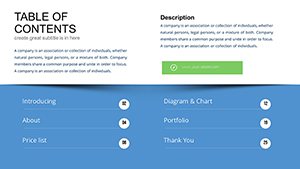
In-Depth Exploration of Slide Components
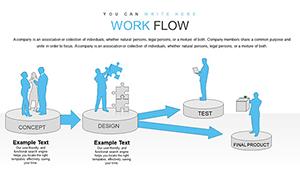
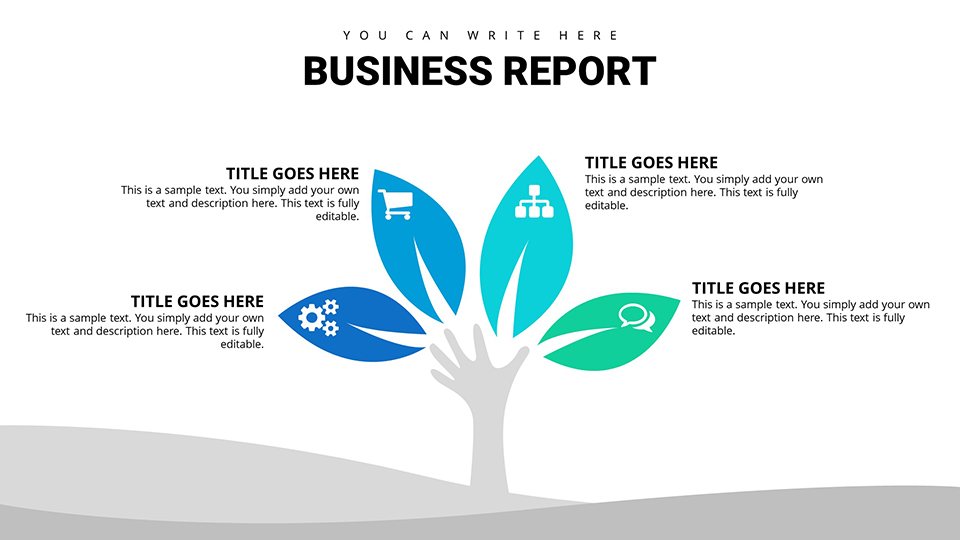
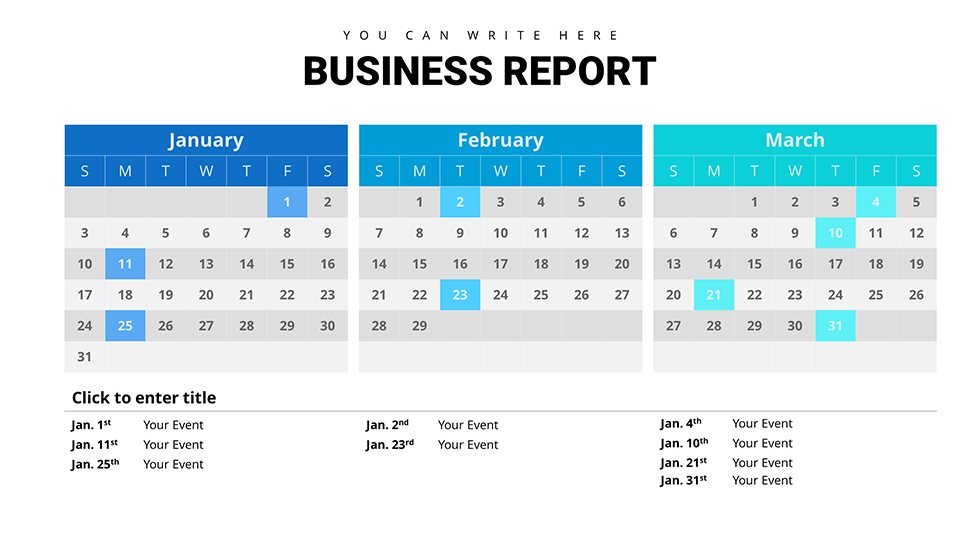
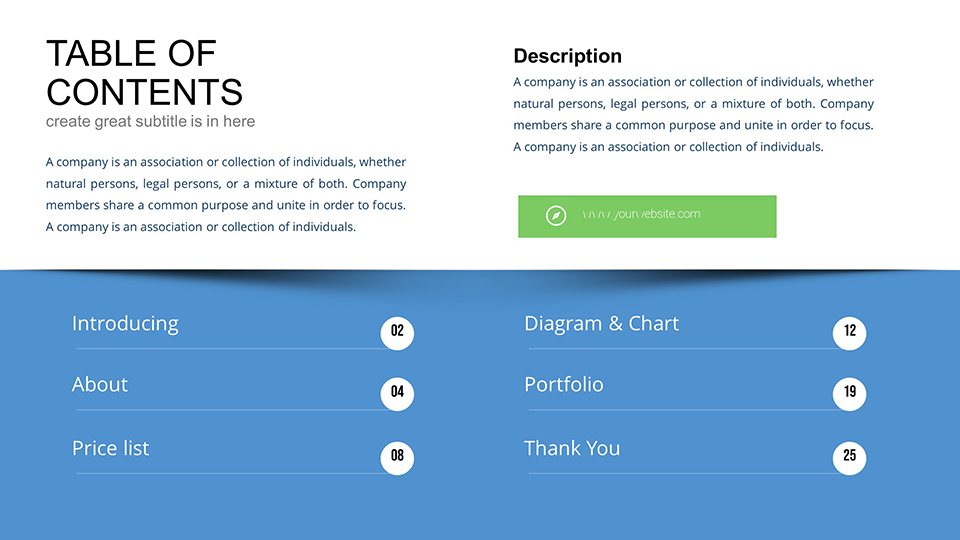
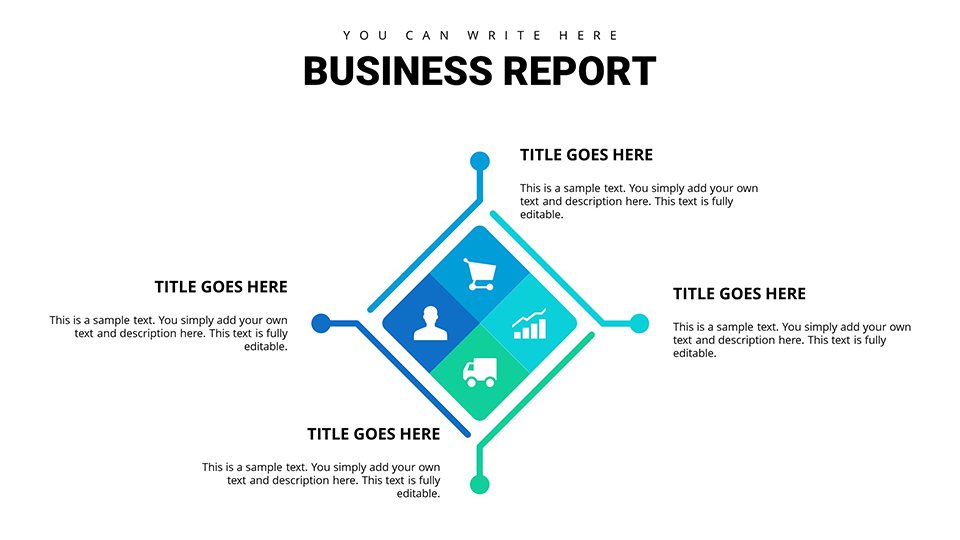
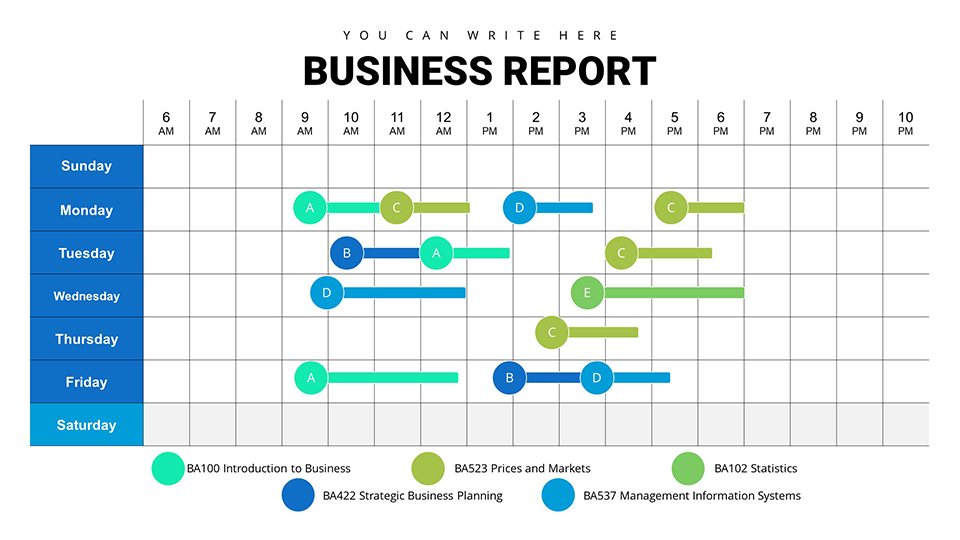
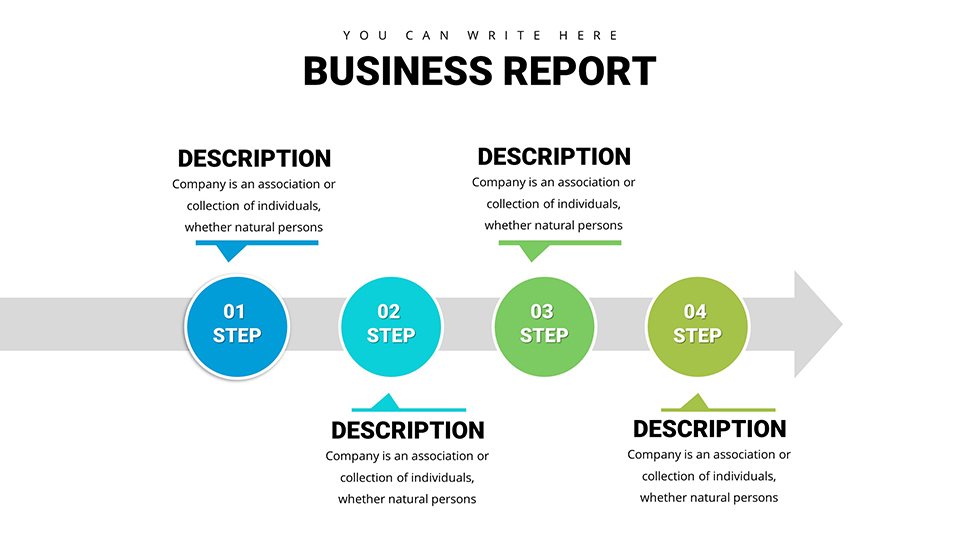
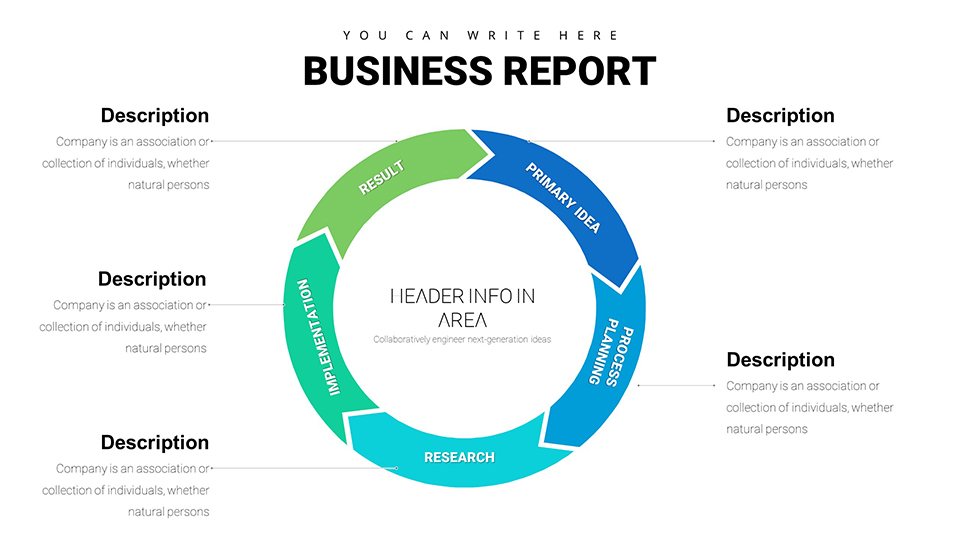
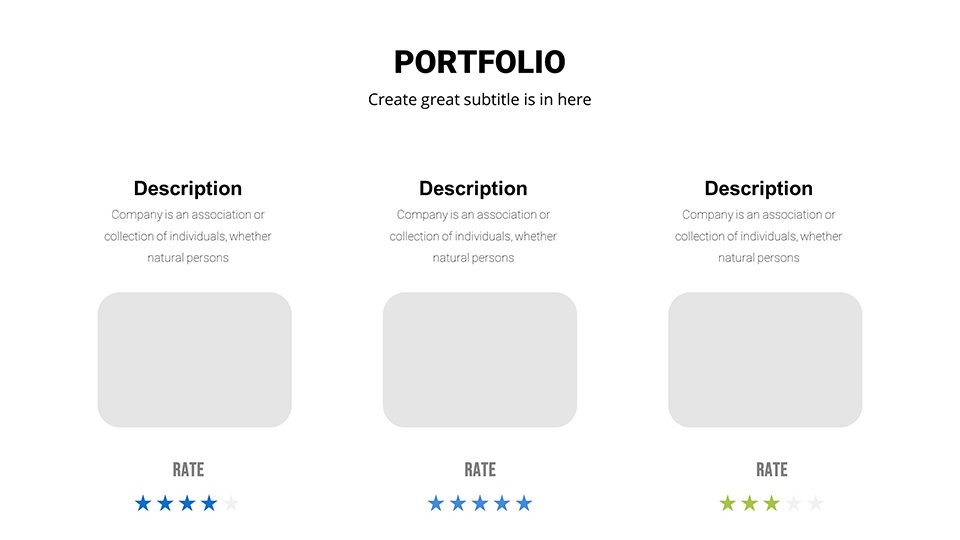
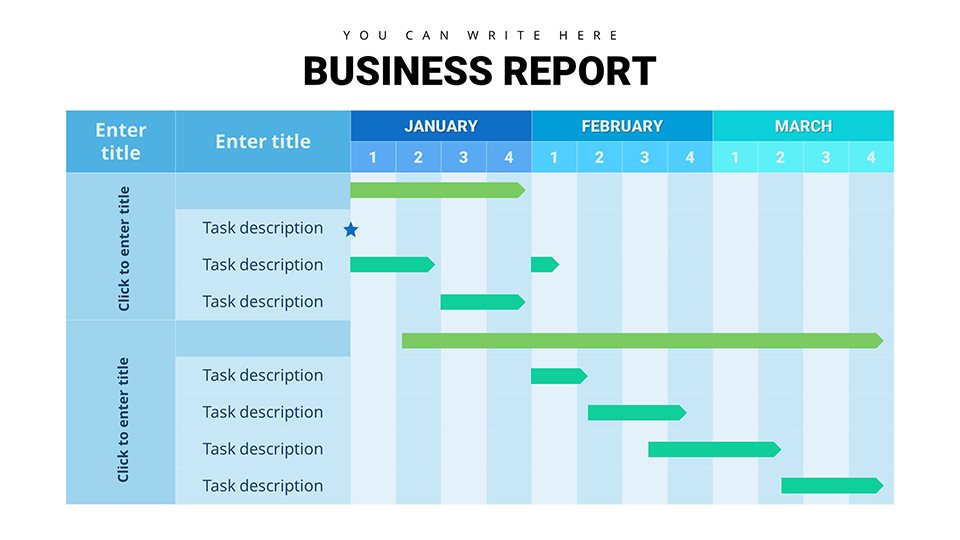
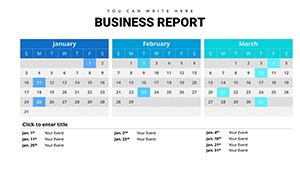
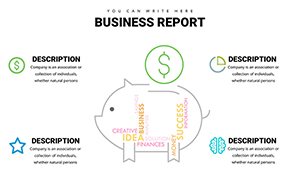
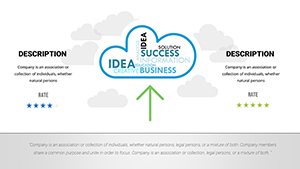
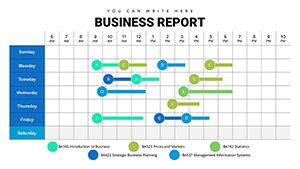
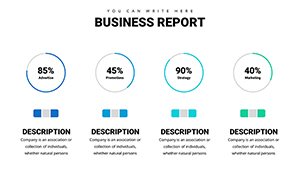
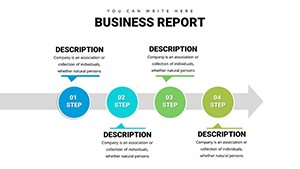
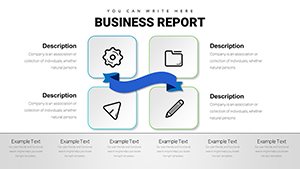
The template's slides are organized for logical progression. Early slides (1-10) cover foundational charts like basic bars and pies for quick overviews. Mid-section (11-20) introduces advanced analytics, such as scatter plots for correlation studies and heat maps for risk assessment. The final slides (21-32) focus on solution-oriented visuals, including decision trees and ROI calculators. Each includes editable legends, axes, and data labels, allowing for tailored storytelling. For example, use a line graph to track sales trends over quarters, adding annotations for pivotal events like product launches.
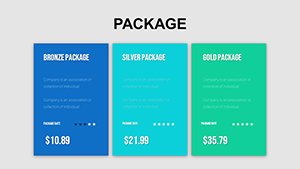
Use Cases Tailored to Business Professionals
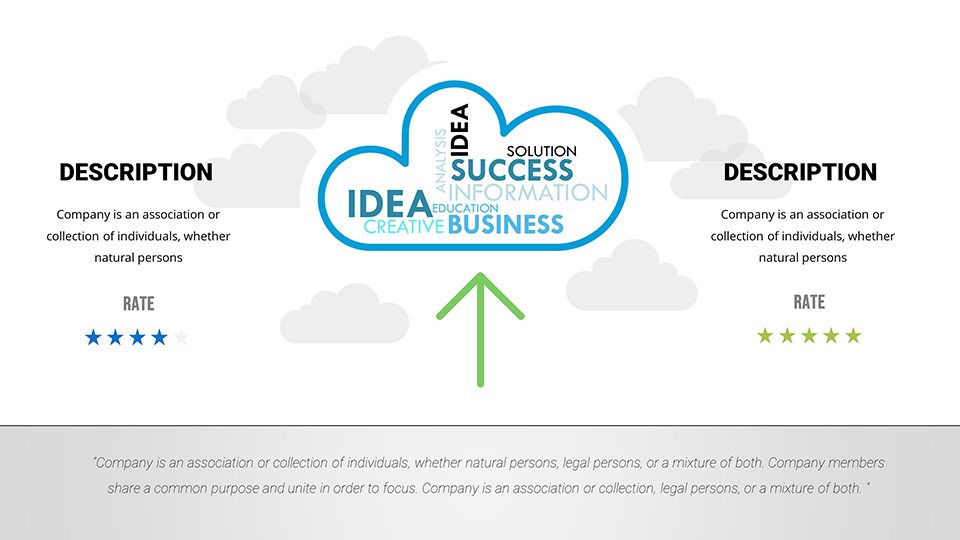
This template shines in diverse scenarios. Business analysts can leverage it for stakeholder reports, visualizing SWOT analyses to pinpoint opportunities. Consultants might use pie charts to break down market shares during client pitches, drawing on real examples like McKinsey's approach to competitive landscapes. Executives in board meetings can present financial results with bar graphs comparing budgeted vs. actuals, fostering informed discussions. In education, trainers adapt them for workshops on data interpretation, while startups employ them in investor decks to showcase growth projections. Imagine a marketing team analyzing campaign ROI: These charts clarify attribution models, leading to optimized budgets and higher returns, as seen in campaigns by brands like Coca-Cola.
Incorporate into your routine by starting with data export from tools like Tableau, then customizing visuals to emphasize insights. This not only saves time but elevates your analytical prowess.
Pro Tips from Seasoned Analysts
- Focus on key metrics: Select charts that highlight the most critical data points.
- Leverage contrasts: Use bold colors for emphasis, guided by data visualization principles from Edward Tufte.
- Add narratives: Include text boxes for explanations, turning charts into stories.
- Ensure scalability: Design for both digital and print outputs.
These insights, honed from years in the field, can transform routine reports into strategic assets.
Advantages Over Standard Presentation Software
Basic PowerPoint lacks the depth of these specialized charts, often resulting in simplistic visuals. Our template provides pre-optimized designs that integrate seamlessly, reducing creation time by up to 60%. Unlike free tools with watermarks, this offers clean, professional outputs. Google Slides support ensures accessibility for global teams, a boon in hybrid work environments.
Elevate your business analysis - download and customize these charts now for sharper insights.
Frequently Asked Questions
What chart types are included?
Bar, pie, line graphs, and more for comprehensive business analysis.
Can I import my own data?
Yes, easily from Excel or other sources for personalized visuals.
Is it suitable for beginners?
Absolutely, with intuitive editing features for all skill levels.
How does it handle large datasets?
Efficiently, with scalable charts that maintain clarity.
Are updates available?
Template is self-contained, but you can modify as needed post-download.