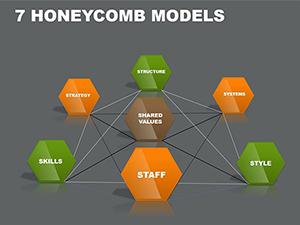
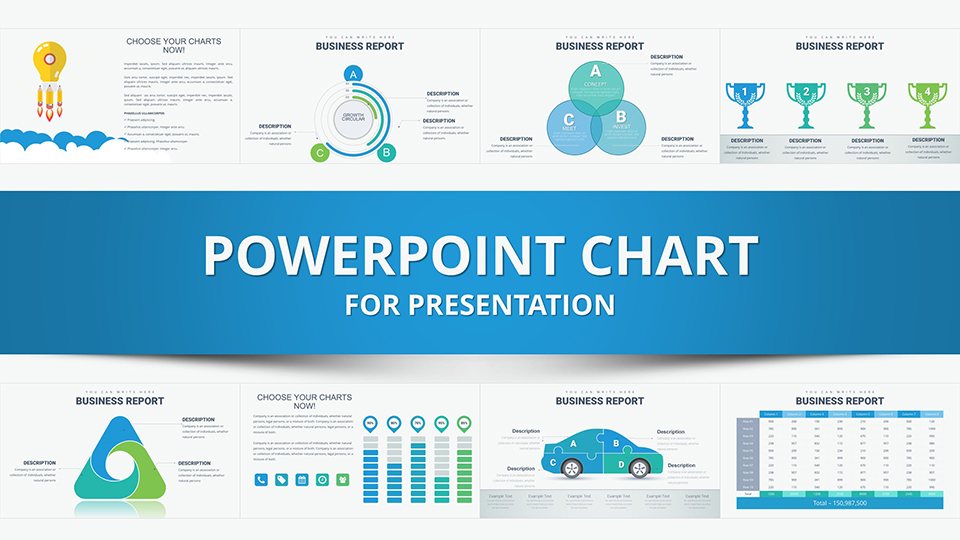
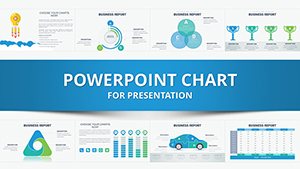
Best Choice PowerPoint Charts: Professional Templates for Decision-Making


Type: PowerPoint Charts template
Category: Business Models, Tables, Analysis
Sources Available: .pptx
Product ID: PC00939
Template incl.: 35 editable slides
In today's data-saturated environment, the ability to distill insights into compelling visuals is invaluable. Our Best Choice PowerPoint Charts template, with 35 editable slides, caters to business analysts, educators, and strategists seeking to highlight options, analyses, and outcomes. From comparing alternatives in boardrooms to illustrating research in lectures, these charts empower you to make informed choices visible and persuasive.
Rooted in principles from decision science, akin to those in Harvard Business Review articles, this template uses matrices, flowcharts, and comparison tables to facilitate clear evaluations, turning complexity into clarity.
Harnessing Visual Tools for Better Choices
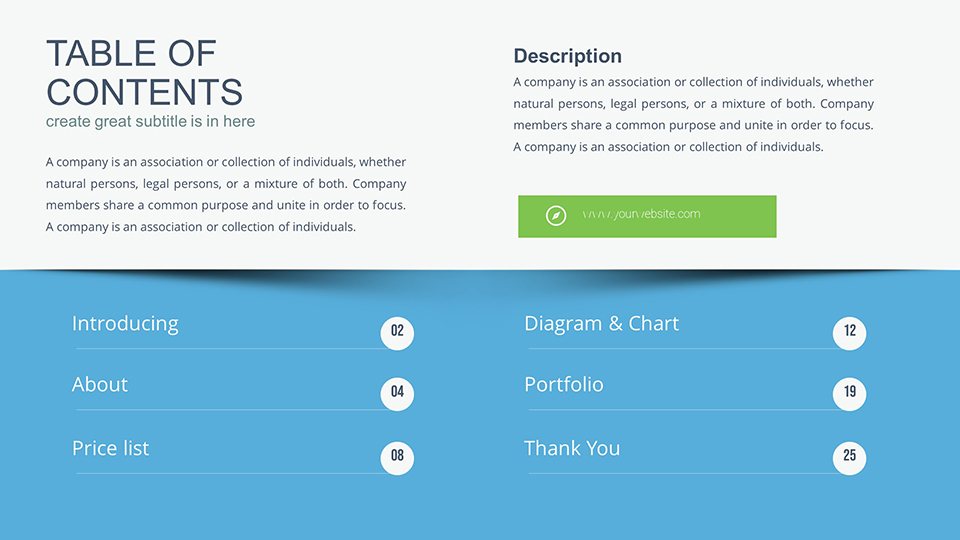
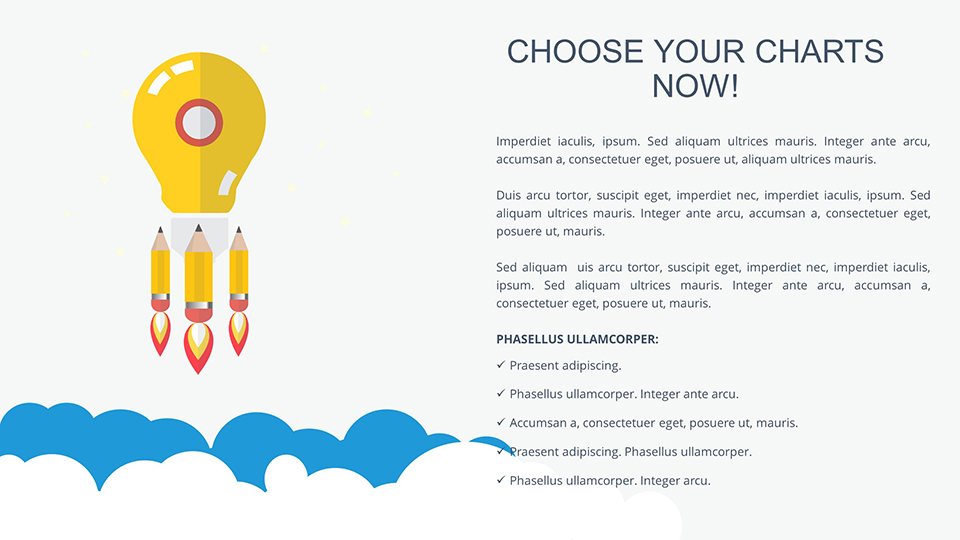
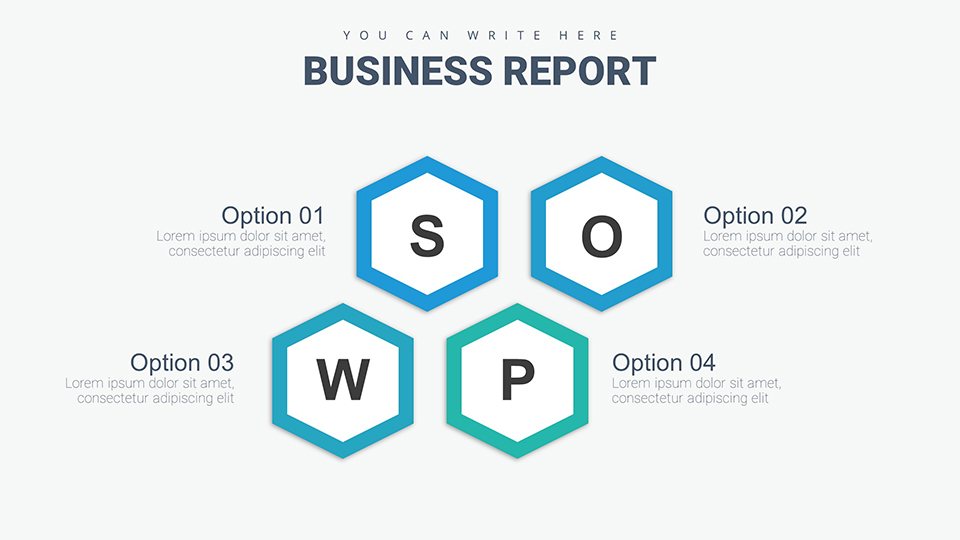
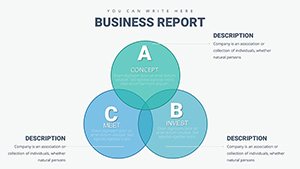
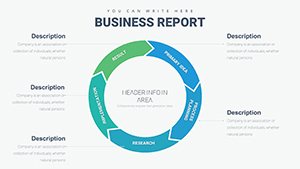
Decision-making thrives on structure. This template provides frameworks like SWOT analyses and decision trees, tailored for professional contexts.
Key Template Attributes
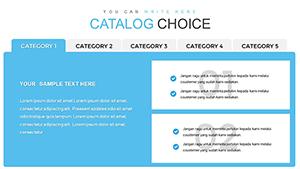
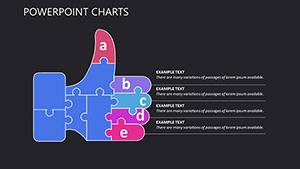
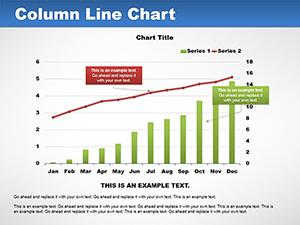
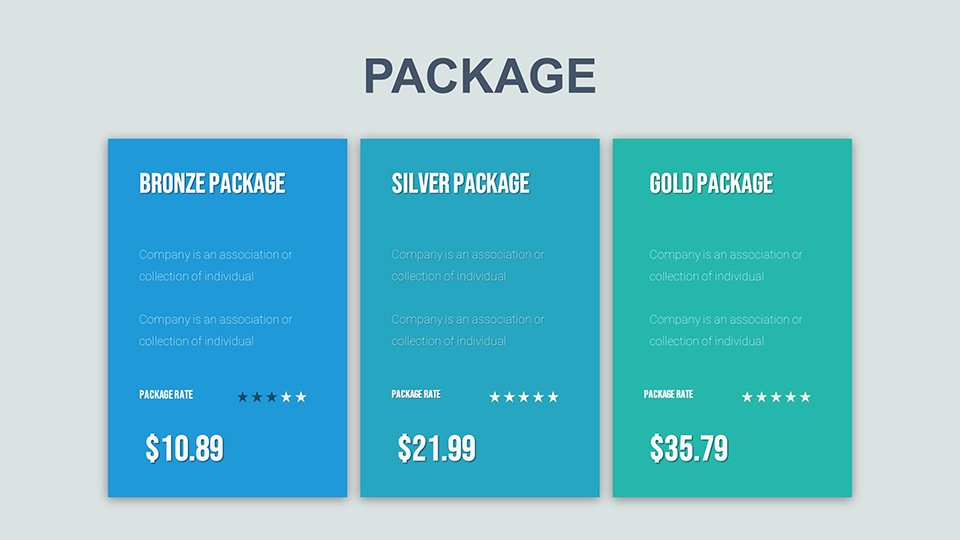
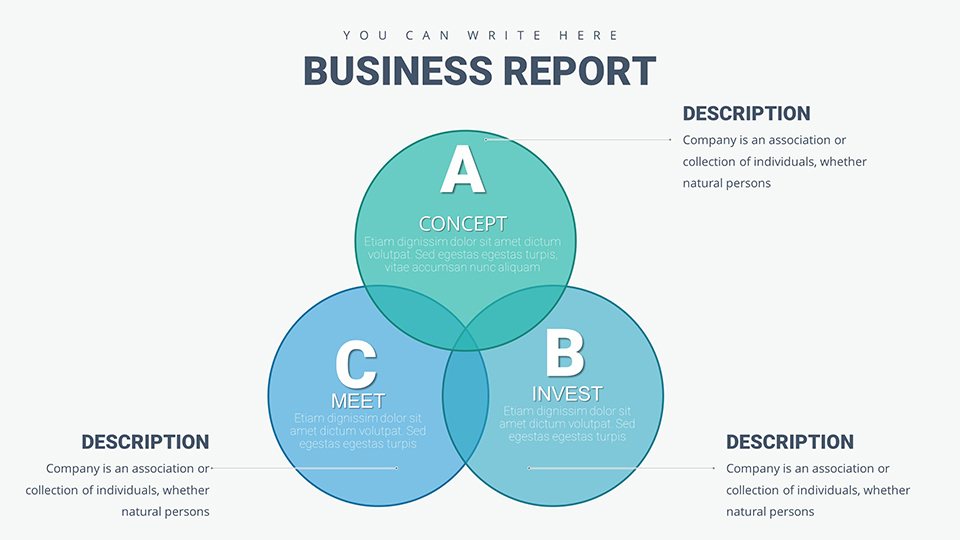
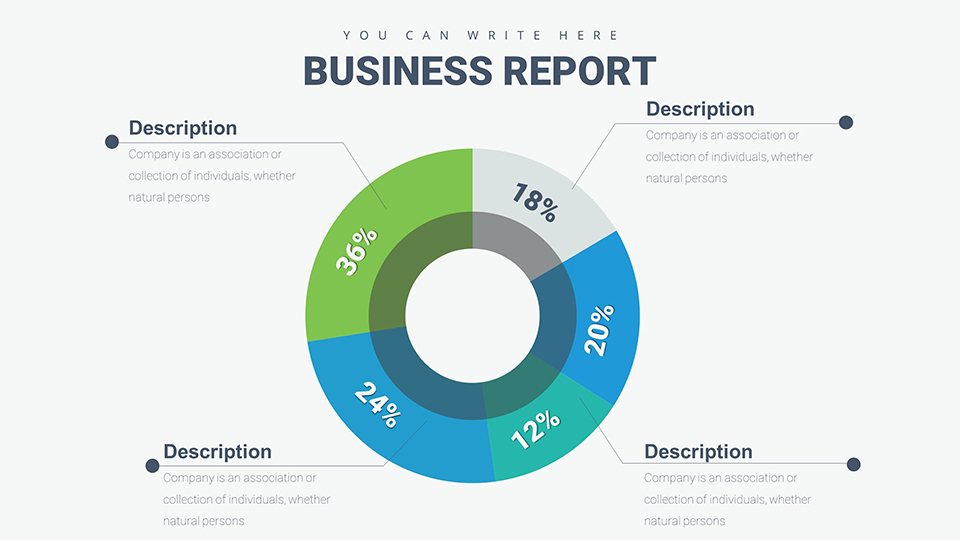
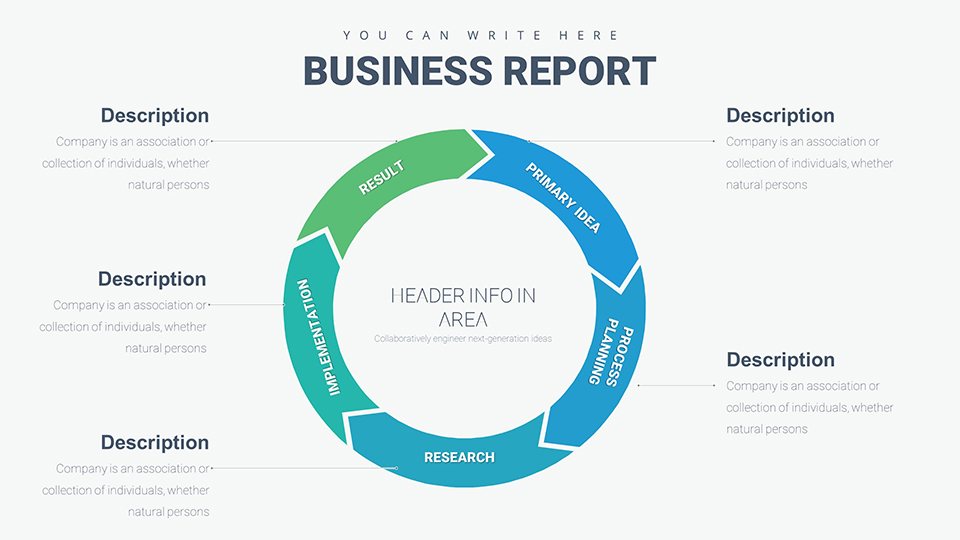
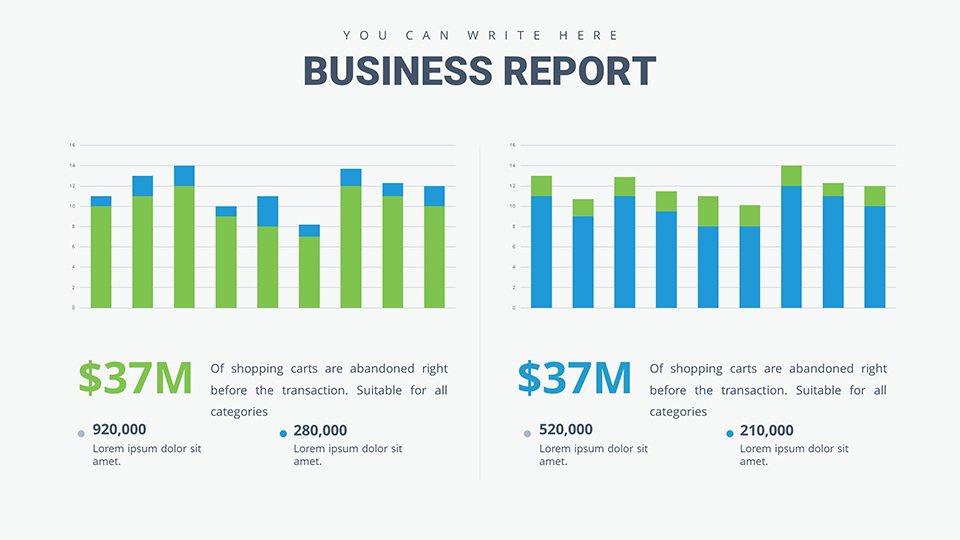
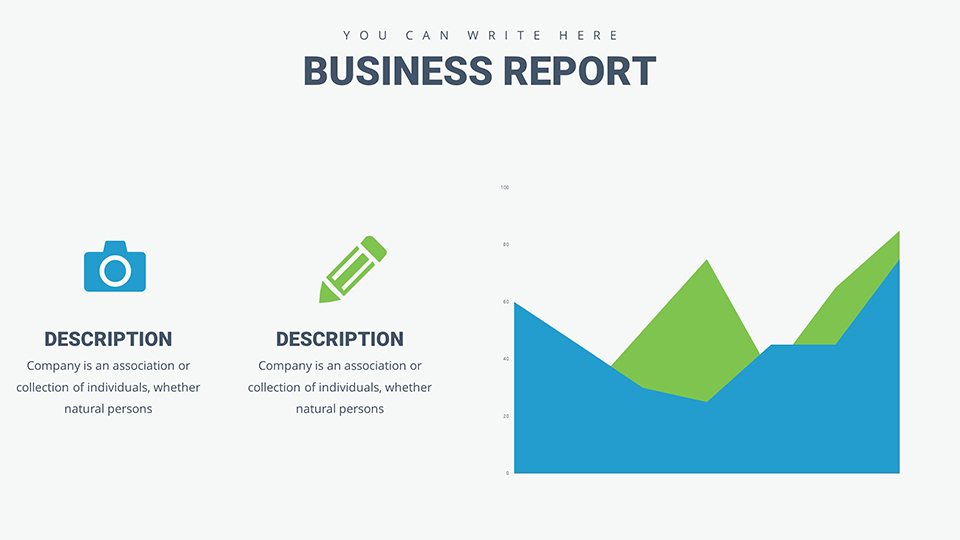
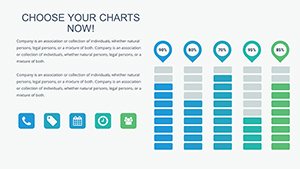
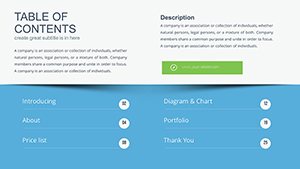
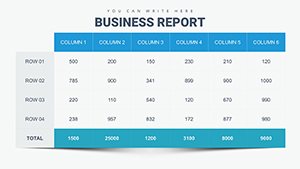
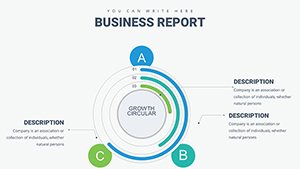
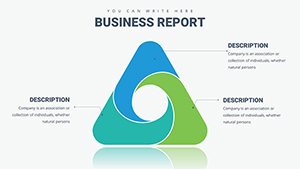
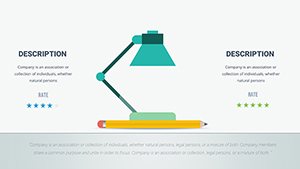
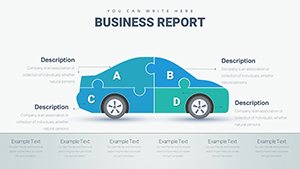
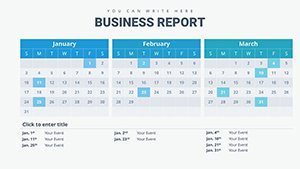
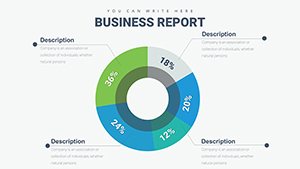
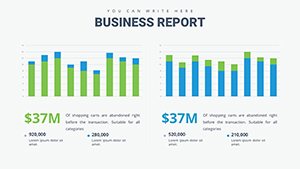
- Chart Diversity: Matrices, trees, and comparative bars for multifaceted views.
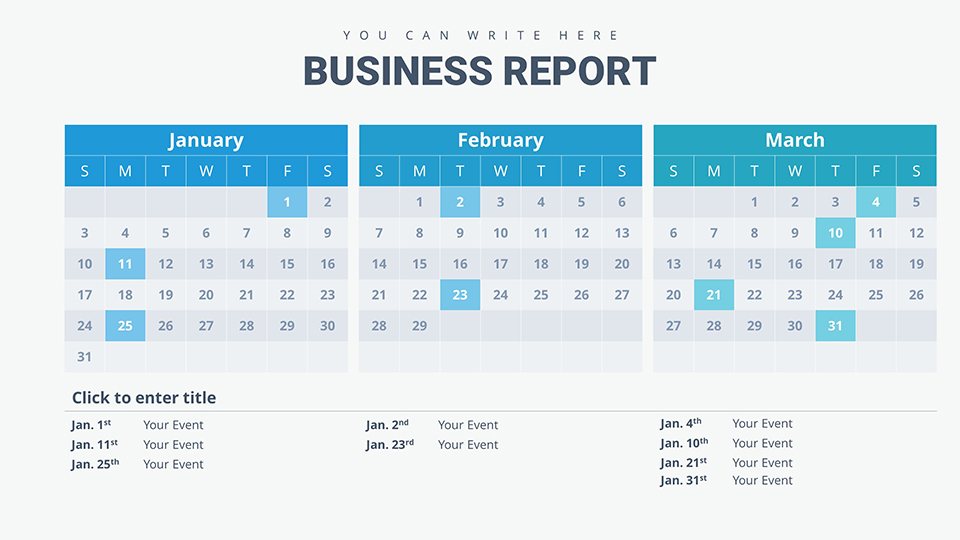
- Customization Depth: Alter layouts, data, and aesthetics freely.
- Format Flexibility: PPTX for PowerPoint, compatible with Google Slides.
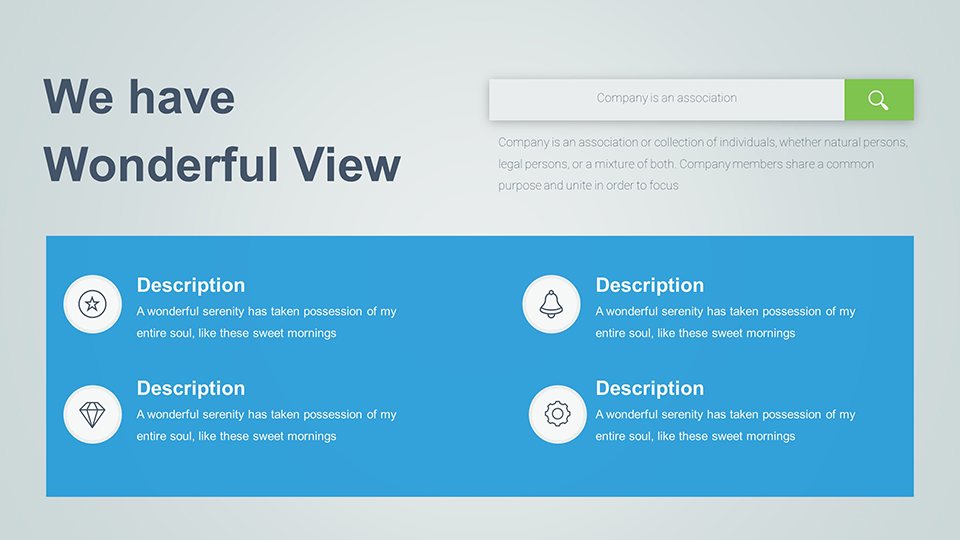
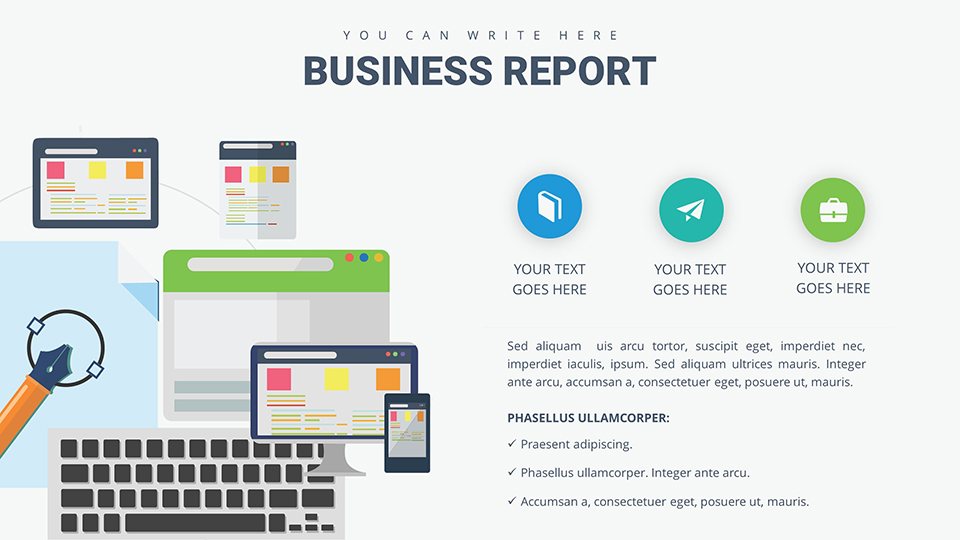
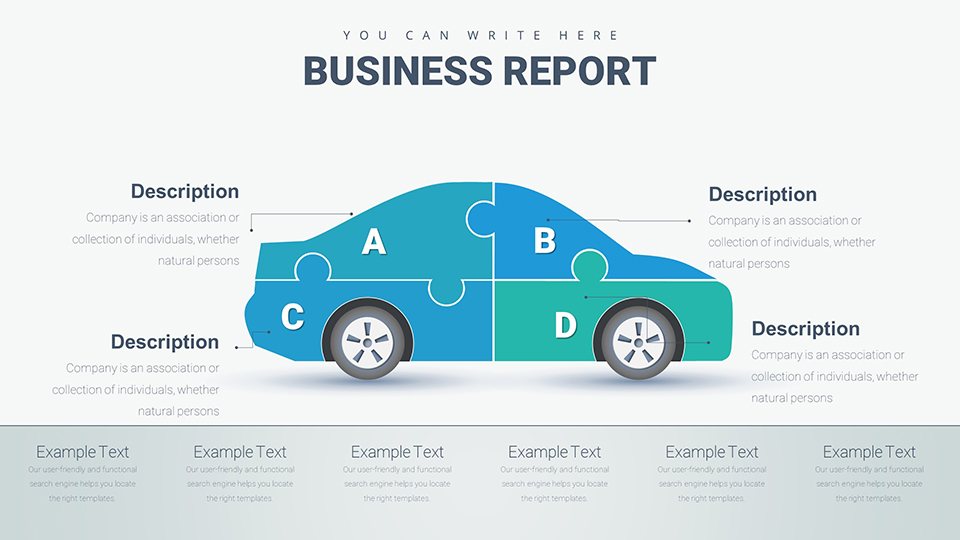
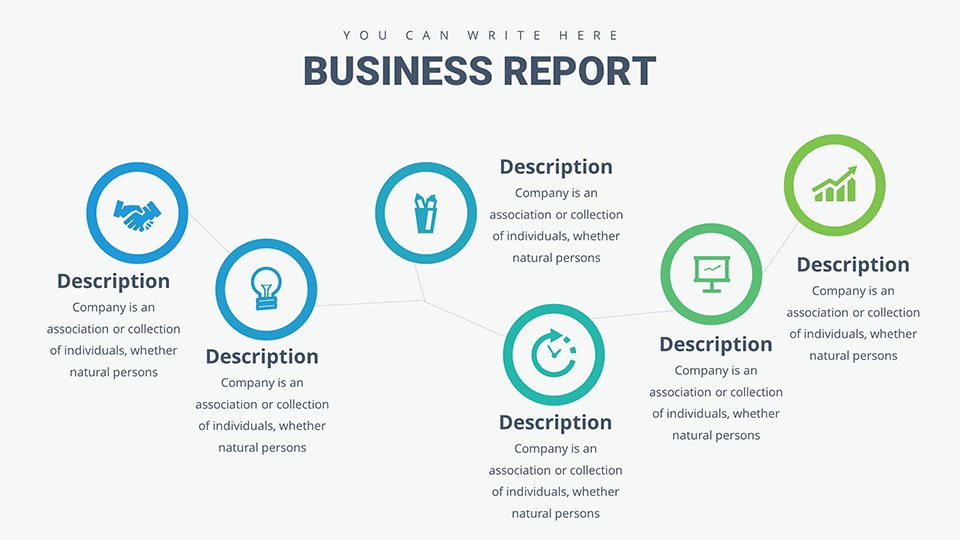
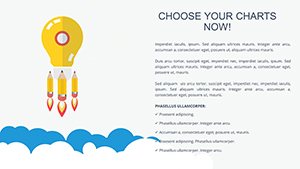
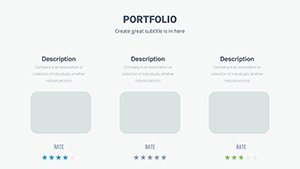
- Analytical Icons: Symbols for pros/cons, scales, and paths.
- Setup Guide: Instructions for optimal use in scenarios.
Features reflect expert recommendations for visual aids in analytics.
Applied Contexts for Business and Academia
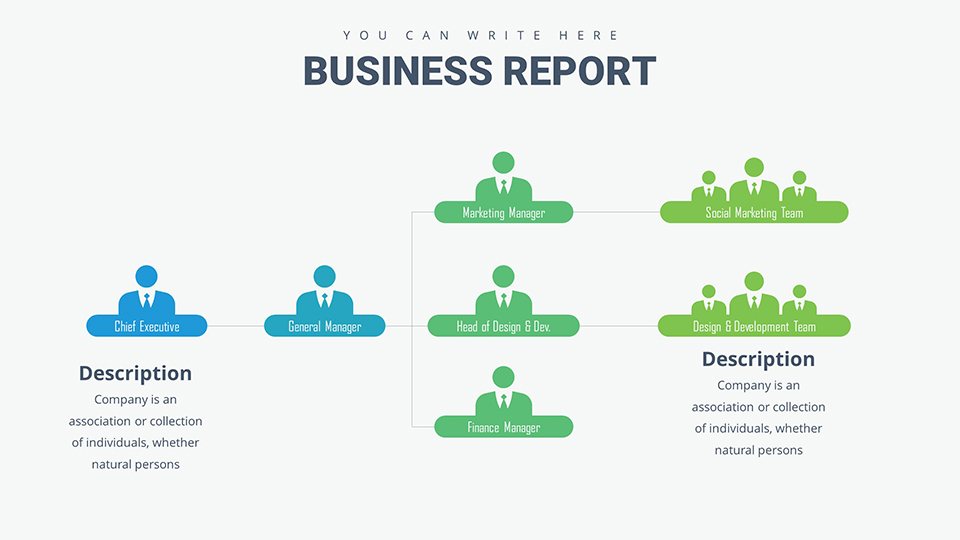
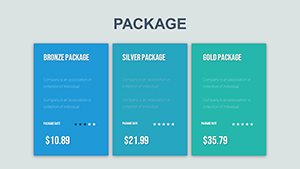
An analyst evaluates vendor options with scoring matrices, weighting factors like cost and quality. Educators teach ethical dilemmas via flowcharts, engaging students interactively.
Sales teams compare product features in proposals, using side-by-side tables to sway clients. Researchers present findings with decision paths, clarifying methodologies.
Stepwise Creation: A Decision Framework Presentation
- Outline objectives: Use intro slides to frame the choice context.
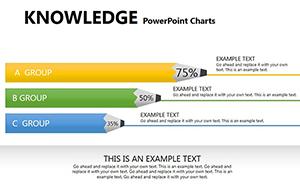
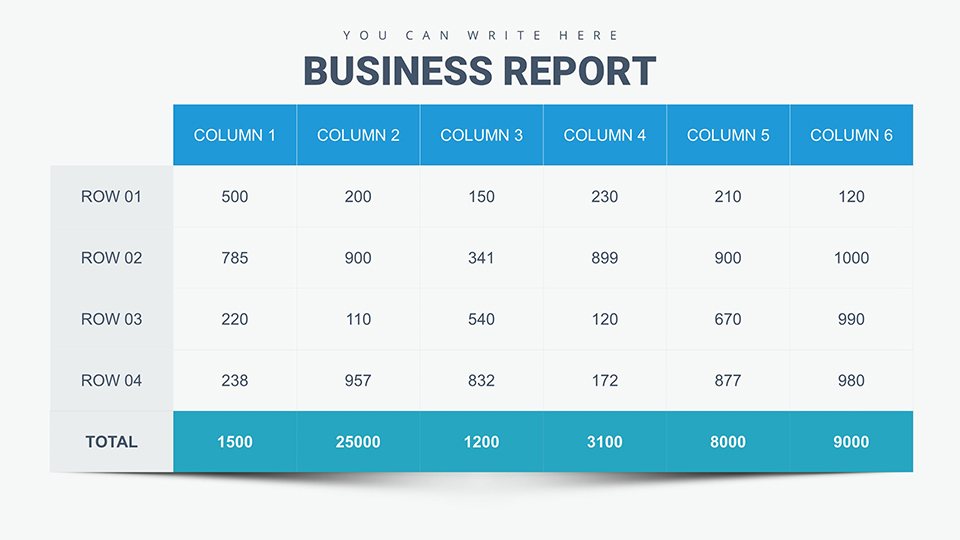
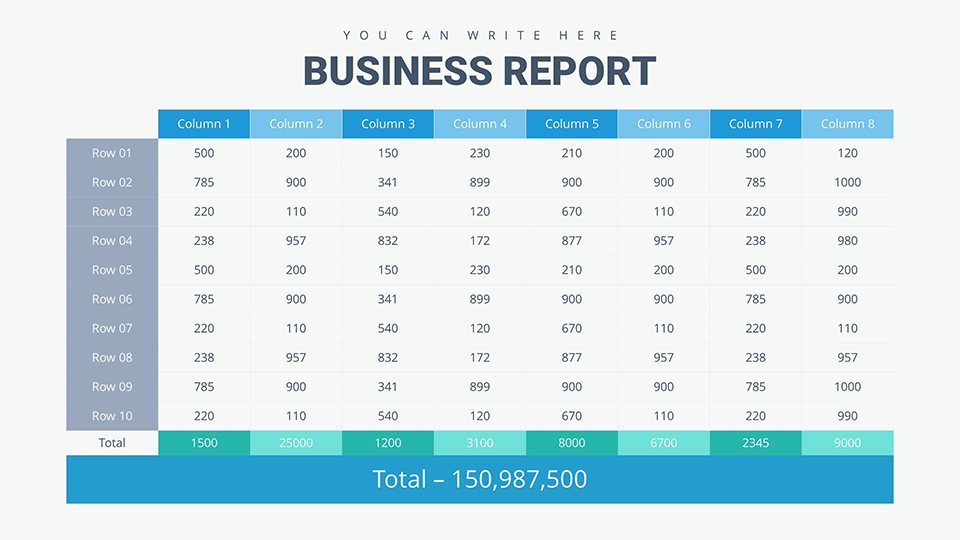
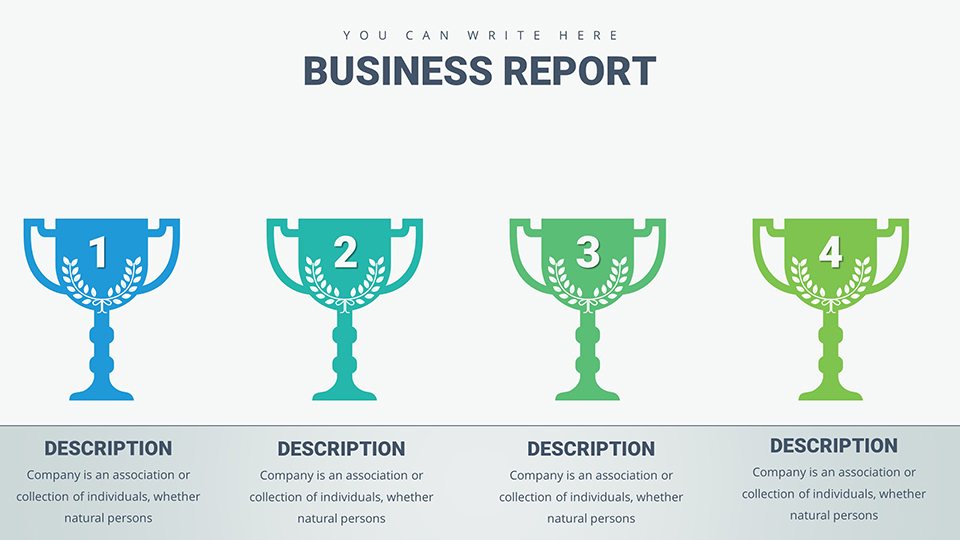
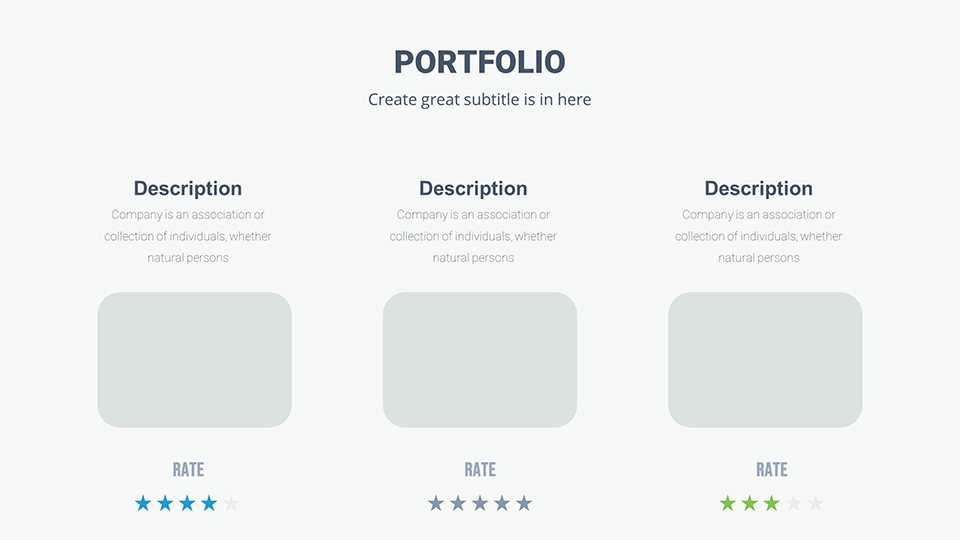
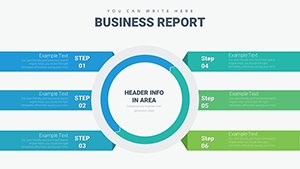
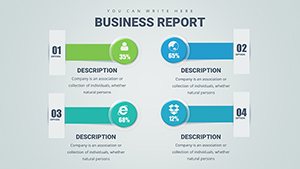
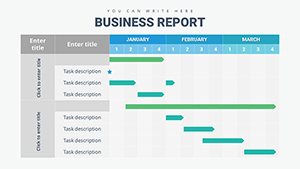
- Populate matrices: Score options against criteria visually.
- Visualize paths: Map decisions with branching diagrams.
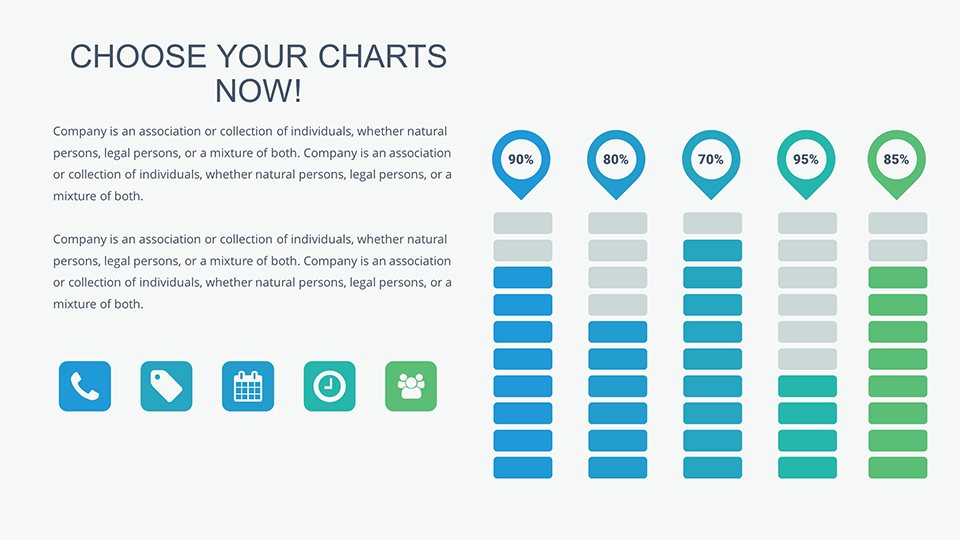
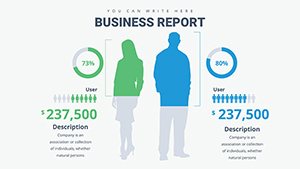
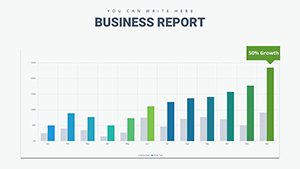
- Compare outcomes: Employ bars for quantitative contrasts.
- Summarize recommendations: End with actionable insights.
Emulates strategies from consulting giants like McKinsey.
Insights for Enhanced Decision Visuals
Use color psychology - greens for positives, reds for risks - to guide perceptions. Animate reveals for emphasis. Outperforms native tools with ready-to-use, cohesive designs.
Link to spreadsheets for updates; reference credible sources for authority.
The Edge of Choice-Focused Charts
Its targeted design promotes better decisions, efficiency, and impact. Ideal for evolving needs.
Choose excellence - download and decide smarter.
Frequently Asked Questions
- Customization level?
- Complete control over all elements.
- Google Slides support?
- Full compatibility assured.
- For academics too?
- Yes, versatile for education.
- Beginner-friendly?
- Guide simplifies process.
- Preview possible?
- Free demo ready.
- Add data sources?
- Easily incorporate links or notes.