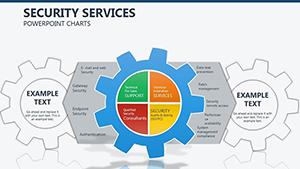
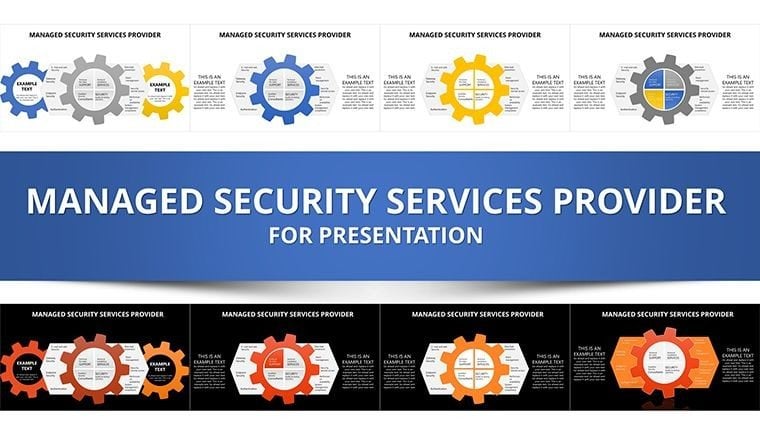
Managed Security Services Provider PowerPoint Charts Template


Type: PowerPoint Charts template
Category: Process
Sources Available: .pptx
Product ID: PC00291
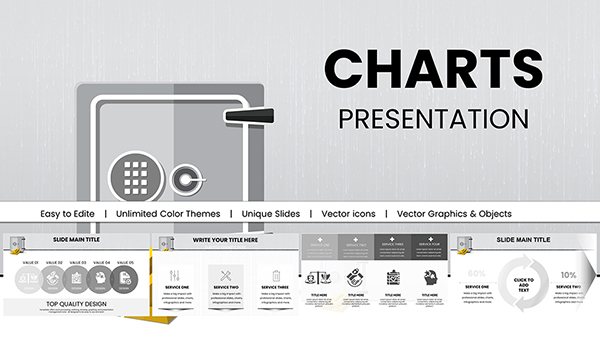
Template incl.: 31 editable slides
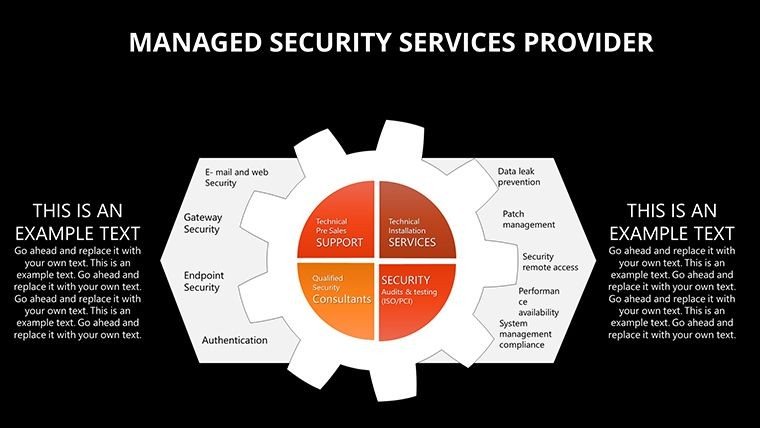
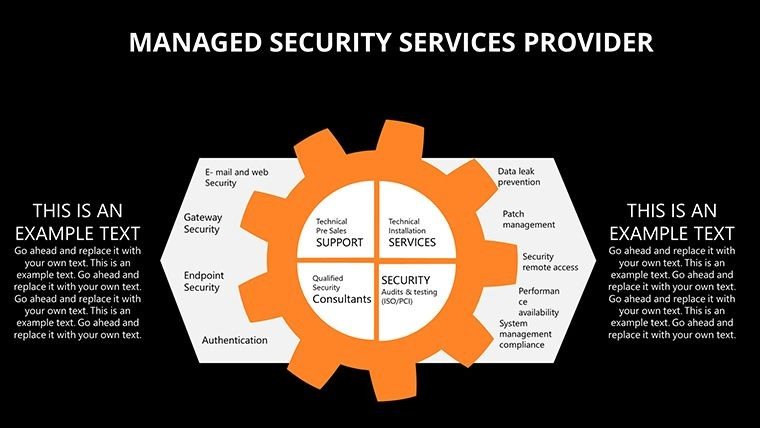
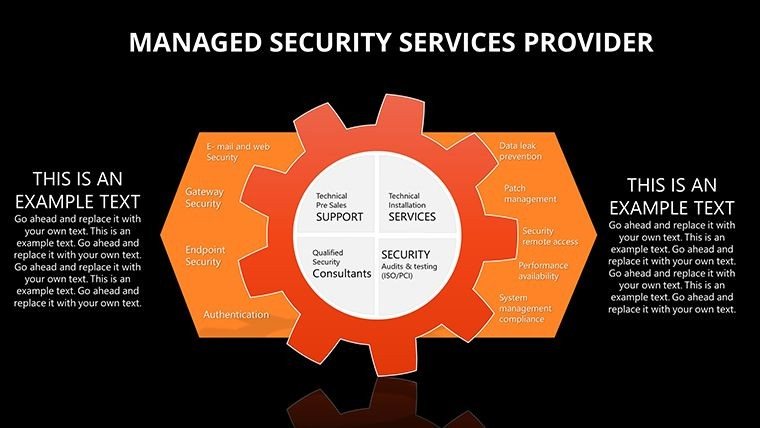
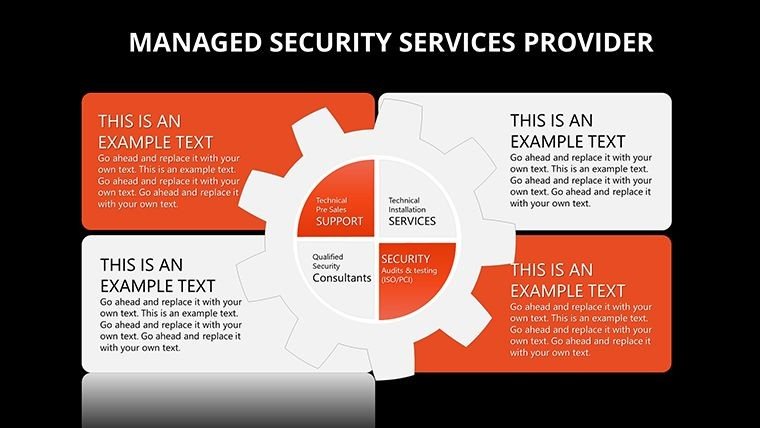
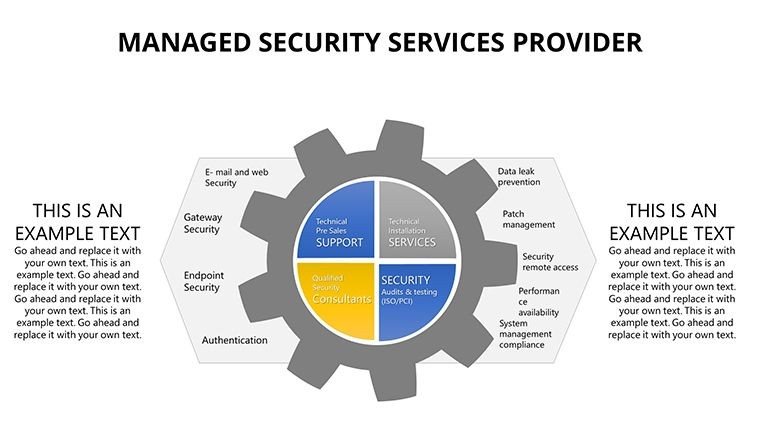
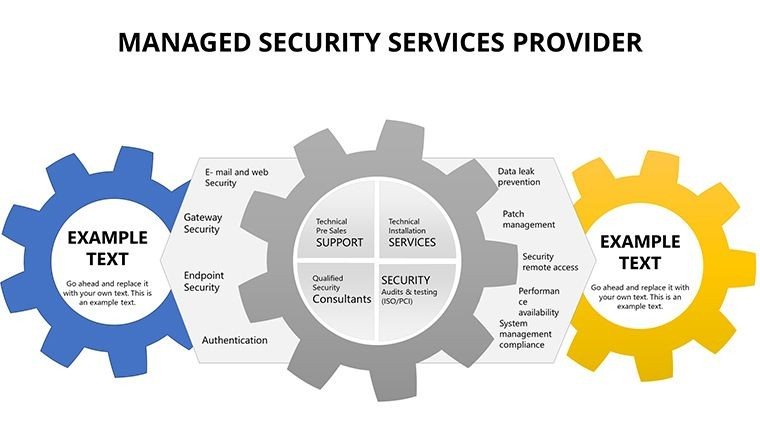
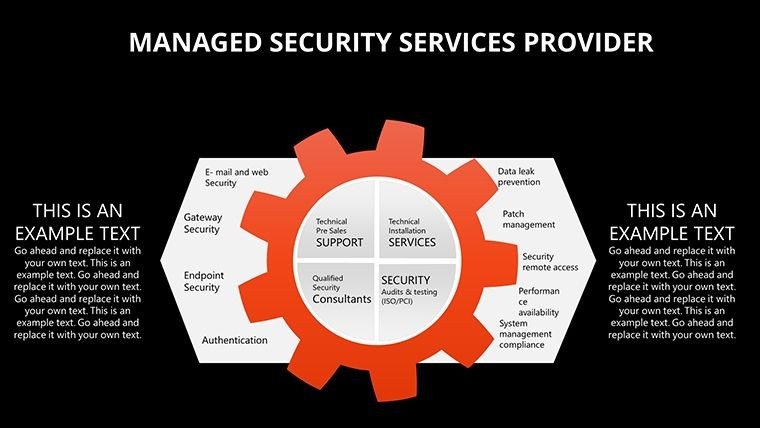
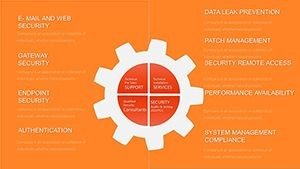
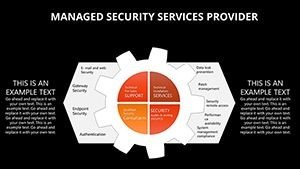
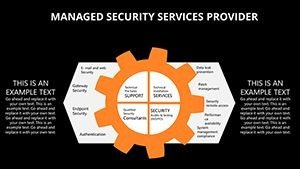
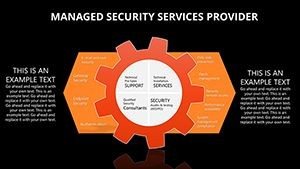
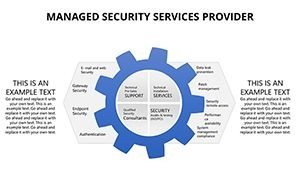
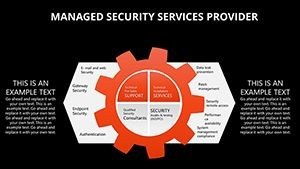
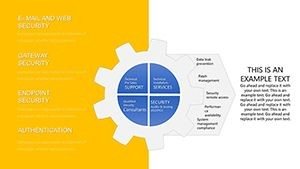
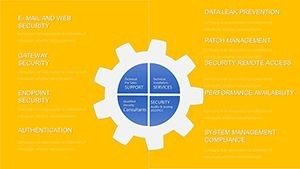
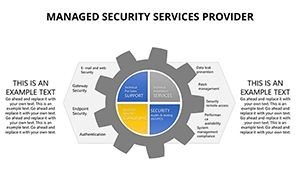
Navigate the complex landscape of cybersecurity with confidence using the Managed Security Services Provider PowerPoint Charts template. Featuring 31 editable slides, this resource is indispensable for IT consultants tackling the challenge of communicating intricate security protocols and threats. Envision a security expert briefing executives: Rather than jargon-filled reports, they utilize intuitive graphs to map vulnerability assessments and process flows to detail response strategies, demystifying risks. Aligned with standards from bodies like NIST, it ensures your presentations exude trustworthiness and expertise. Fully compatible with PowerPoint and Google Slides, it facilitates rapid customizations, allowing focus on strategy over design. From icon-driven threat landscapes to trend analyses of breach data, this template empowers providers to showcase services effectively, building client trust and driving partnerships in an era of escalating digital threats.
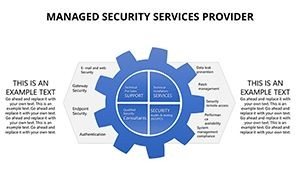
Key Features Tailored for Security Professionals
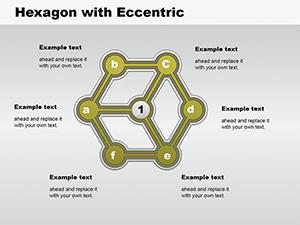
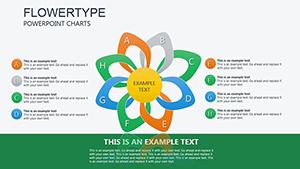
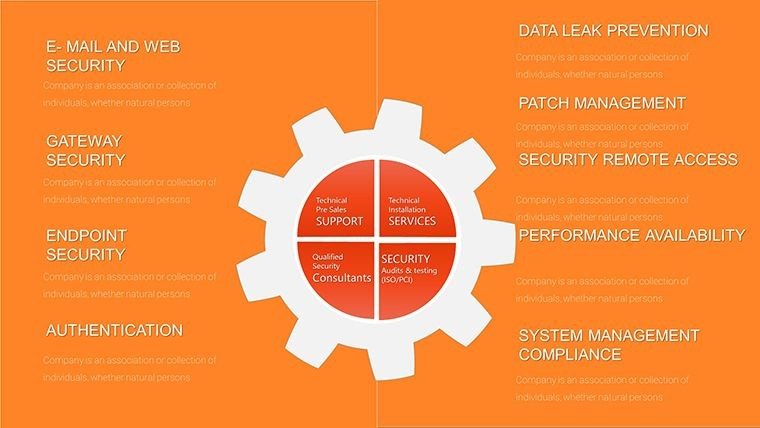
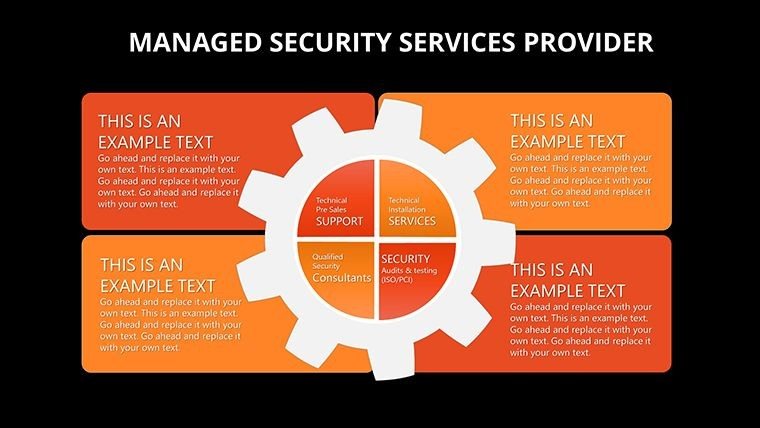
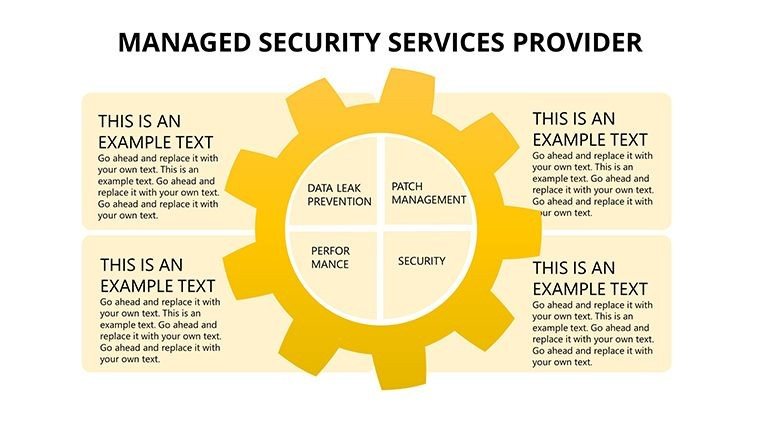
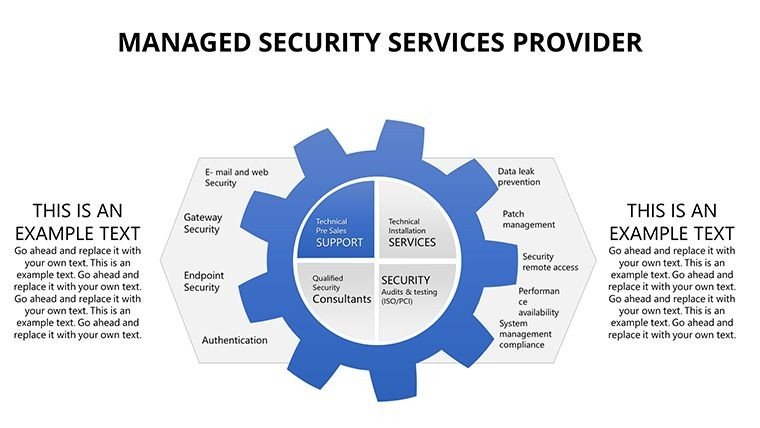
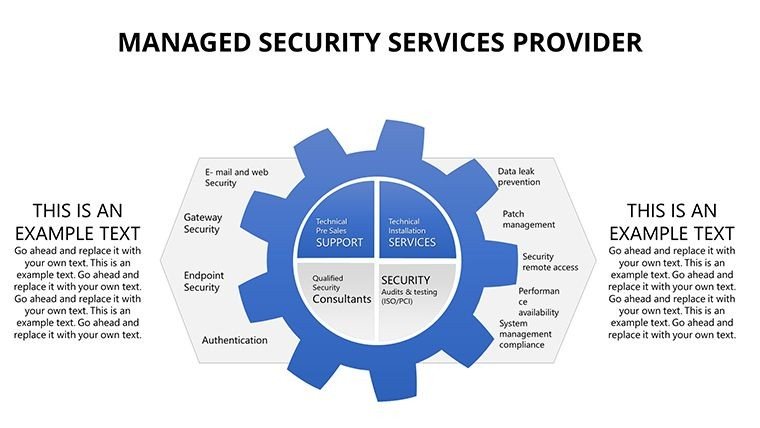
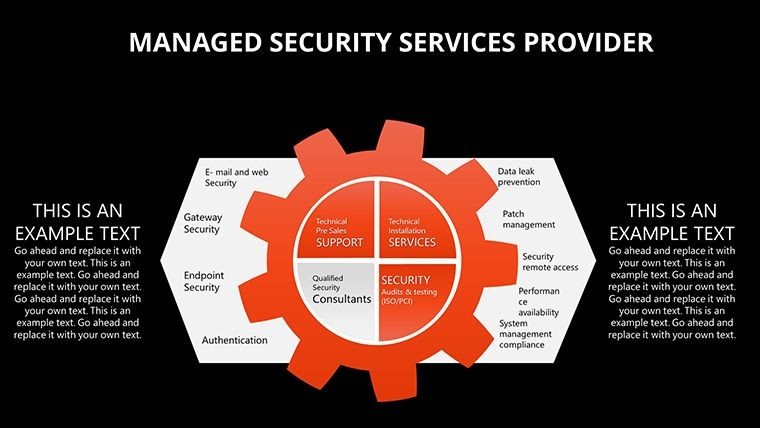
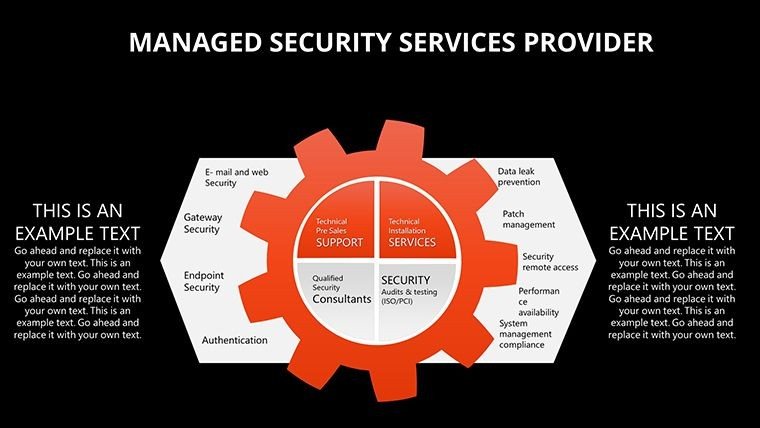
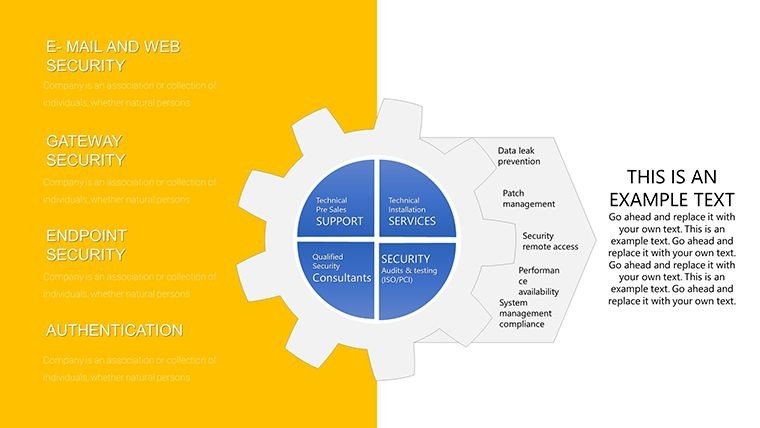
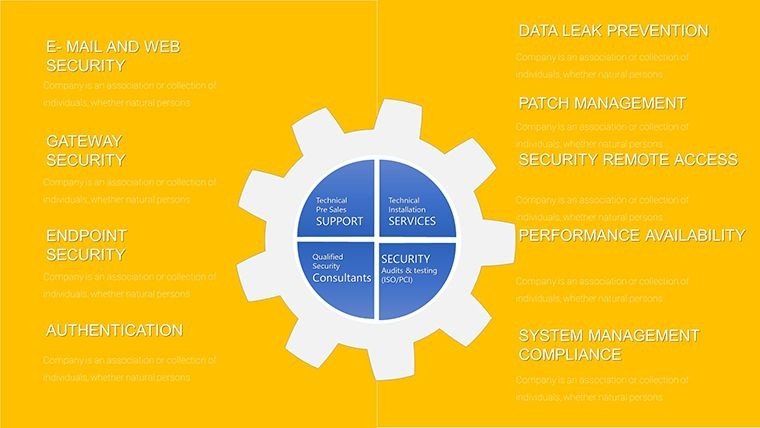
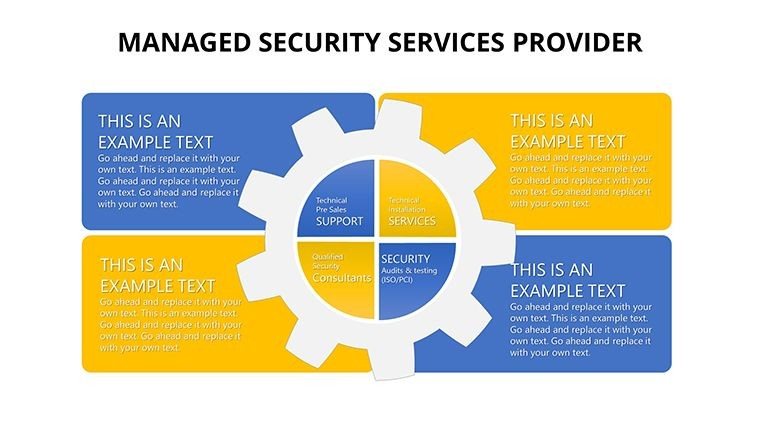
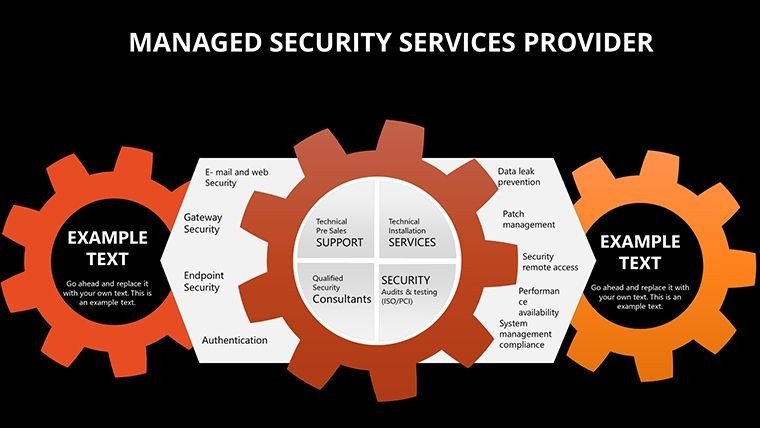
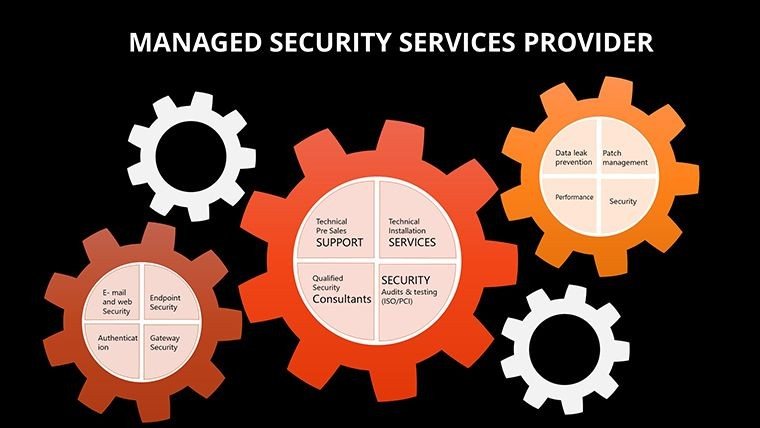
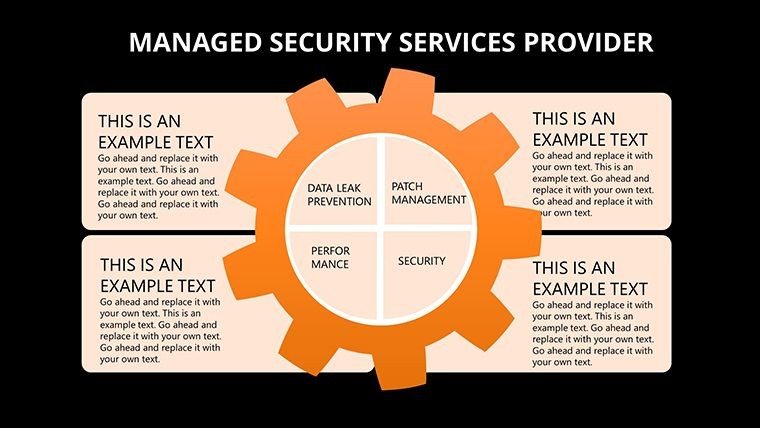
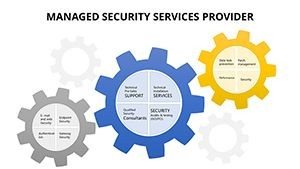
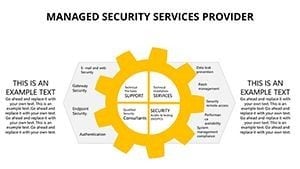
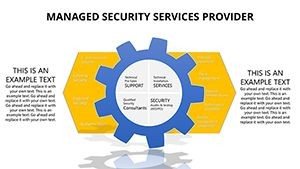
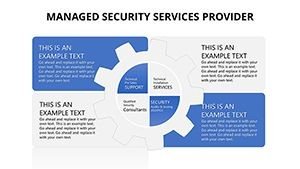
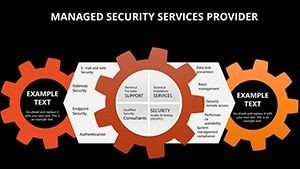
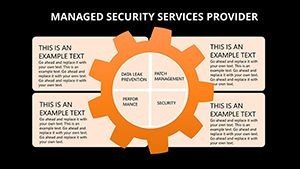
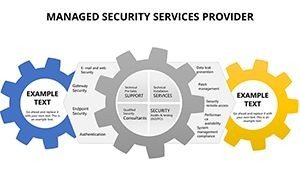
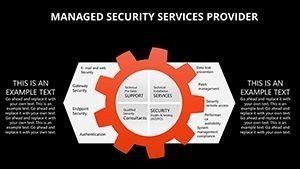
Delve into features that prioritize security-centric visualization. The 31 slides include specialized charts like risk matrices for threat prioritization, process diagrams for incident response workflows, and graphs tracking compliance metrics. Customize with security icons - firewalls, locks, alerts - to reinforce themes, while adjusting layouts for device responsiveness. Input real-time data, such as from SIEM tools, to generate dynamic visuals that update seamlessly. Inspired by cybersecurity frameworks like CIS Controls, these elements lend authoritative depth, enabling consultants to illustrate concepts like zero-trust architectures with clarity. The user interface is streamlined, reducing setup time and allowing experts to concentrate on tailoring content for specific client needs, such as GDPR compliance overviews.
Real-World Scenarios and Implementation
Apply this template across critical use cases in the security domain. For client pitches, deploy charts to visualize managed services tiers, highlighting cost savings through pie breakdowns of threat mitigation efficiencies. IT teams can use process flows to train on breach protocols, stepping through detection to recovery with annotated steps. Example workflow: Select a threat landscape slide, populate with vulnerability scan data, customize colors to denote severity levels, then link to a response process slide for comprehensive narratives. Drawing from case studies like those from SANS Institute, users have successfully used similar visuals to secure contracts by demonstrating proactive security postures. In stakeholder meetings, it clarifies complex topics like cloud security migrations, fostering informed decisions and reducing implementation hurdles.
Proven Customization Techniques
Optimize with these specialized tips from security consulting veterans. Begin by assessing your audience - executives prefer high-level dashboards, while tech teams need detailed flows - then adapt accordingly. Employ animations to simulate threat progressions, as per visualization guidelines from experts like Bruce Schneier, enhancing understanding without distraction. Integrate hyperlinks to policy documents for interactive depth. Use the icon set strategically, pairing shields with protection metrics to symbolize robustness. Collaborate via Google Slides for team reviews, ensuring accuracy in sensitive data representations. Sidestep pitfalls like information overload by limiting slides to key visuals, maintaining a professional tone that underscores reliability in high-trust fields.
Outperforming Standard Tools in Security Contexts
This template surpasses generic PowerPoint features by offering security-specific graphics and integrations absent in basics. While defaults provide simple charts, these lack the thematic coherence for topics like endpoint protection, leading to less persuasive outputs. With responsive designs and specialized icons, it ensures presentations adapt to virtual or in-person settings, boosting engagement. Security pros note improved client retention when using tailored templates, as they convey specialized knowledge effectively. Versus free options, the 31-slide depth provides comprehensive coverage, enabling nuanced discussions on evolving threats like ransomware, positioning you as a forward-thinking provider.
Fortify your presentations - acquire the Managed Security Charts template today and safeguard your success.
Frequently Asked Questions
What security-specific elements are included?
Charts, graphs, and icons focused on threats, responses, and compliance.
Can I customize for different clients?
Yes, full editability allows branding and data tailoring per need.
Is it device-responsive?
Absolutely, designed for optimal viewing on laptops, tablets, and more.
Does it include training aids?
Yes, process slides are perfect for educational security sessions.
Are there any security restrictions on use?
No, unlimited use for professional purposes.