Analysis of Problems PowerPoint Charts Template: Drive Solutions Forward


Type: PowerPoint Charts template
Category: Business Models
Sources Available: .pptx
Product ID: PC00861
Template incl.: 28 editable slides
Navigating business challenges requires more than intuition - it demands structured visualization to uncover roots and paths ahead. Our Analysis of Problems PowerPoint Charts Template delivers exactly that, with 28 editable slides tailored for dissecting issues in business models. From project managers pinpointing bottlenecks to consultants outlining strategic fixes, this PPTX file transforms abstract problems into actionable insights through charts that highlight causes, effects, and resolutions.
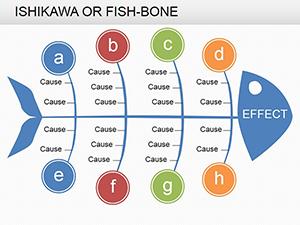
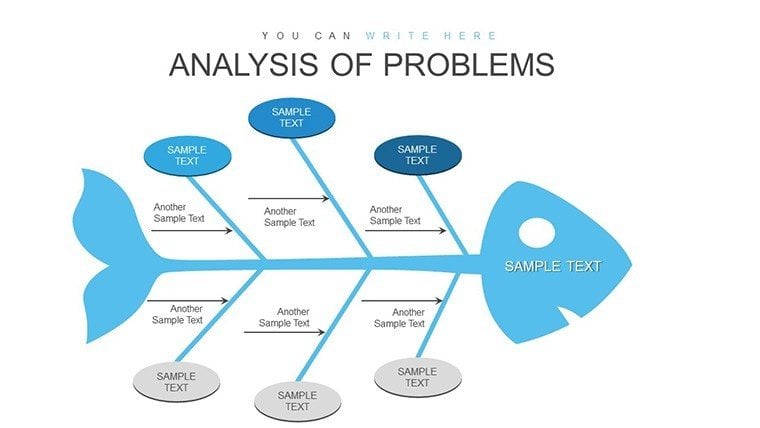
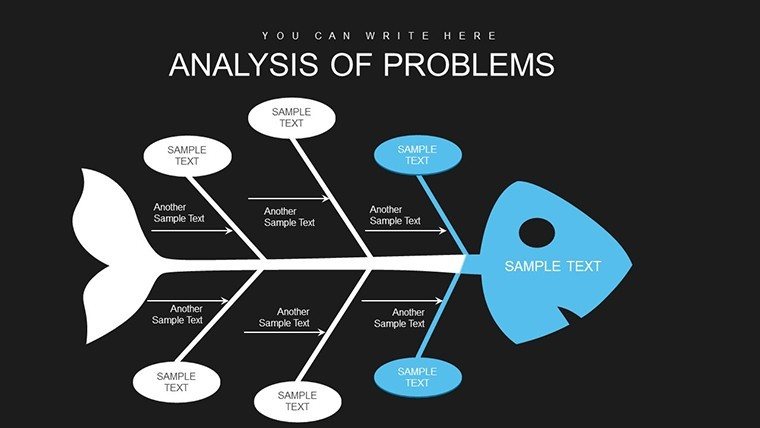
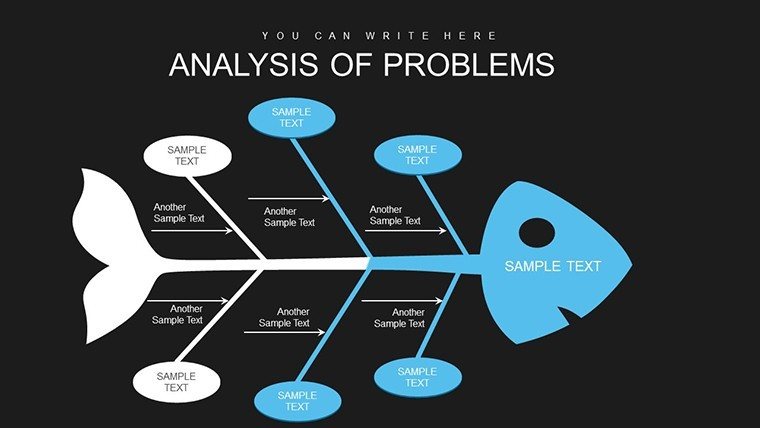
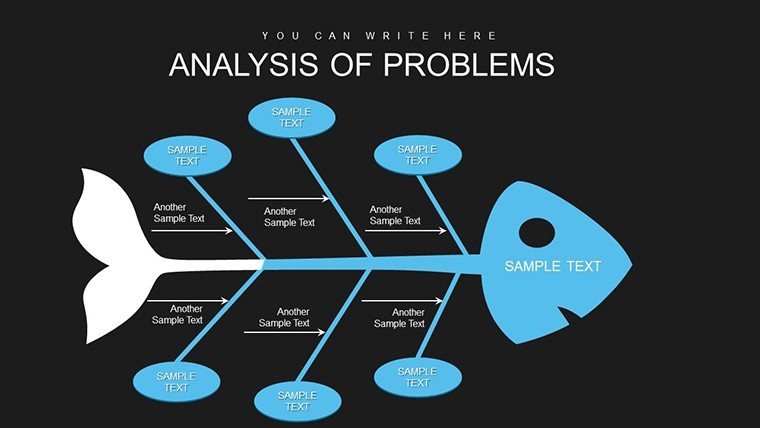
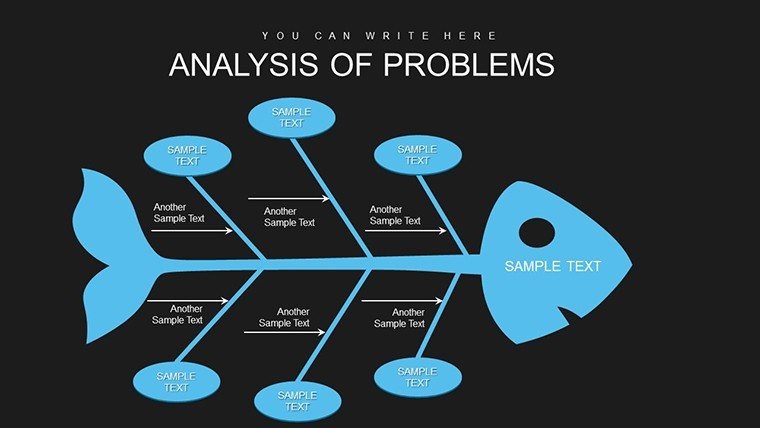
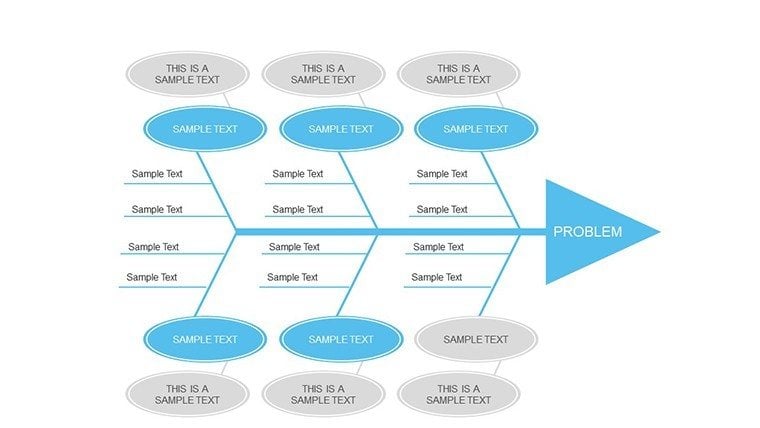
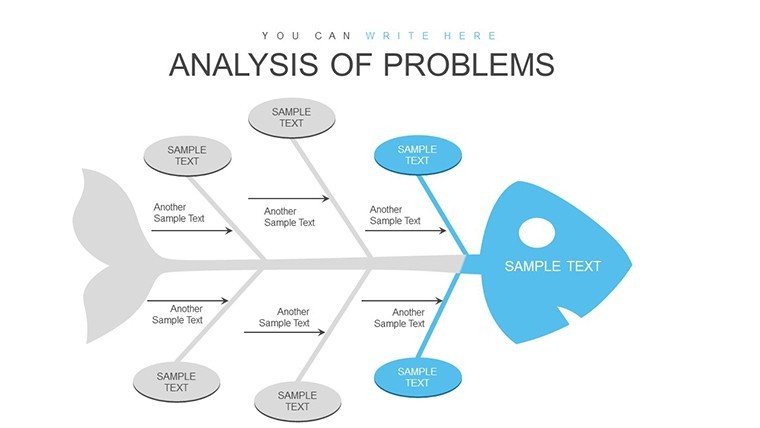
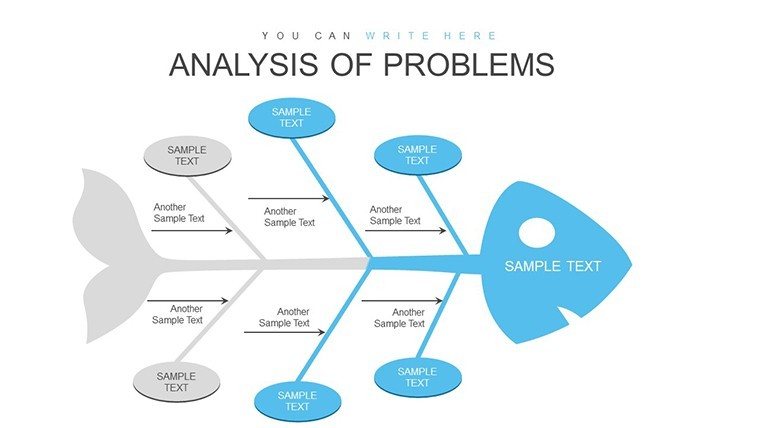
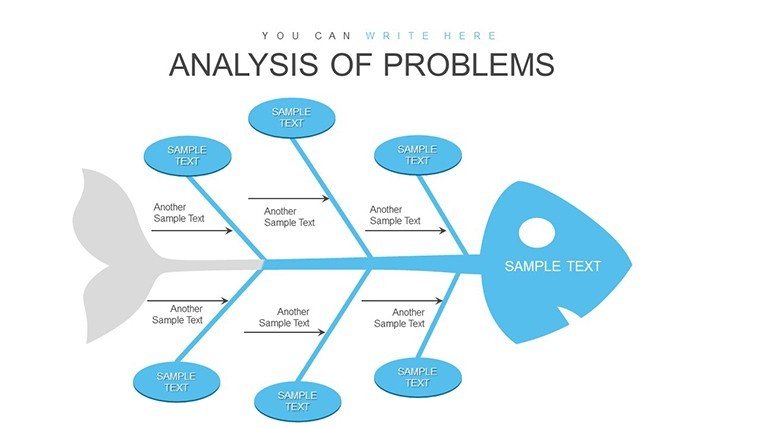
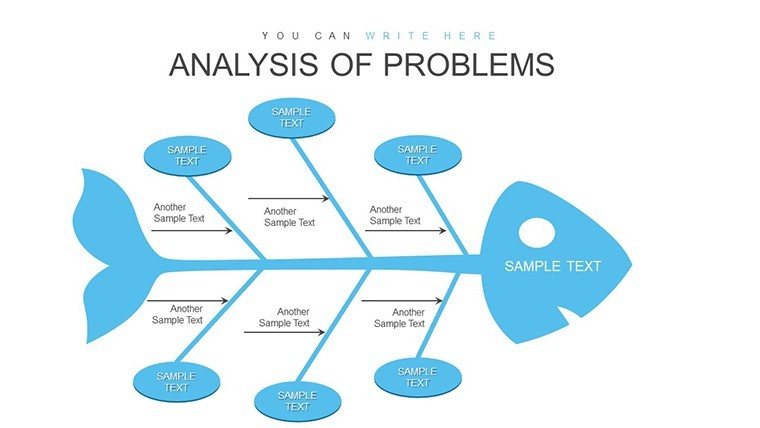
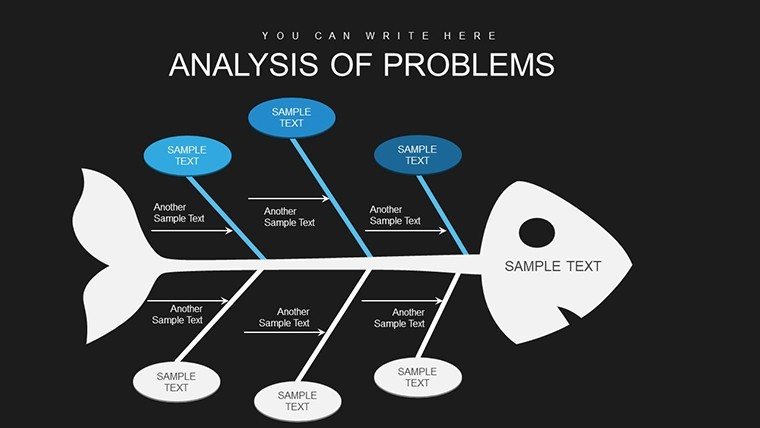
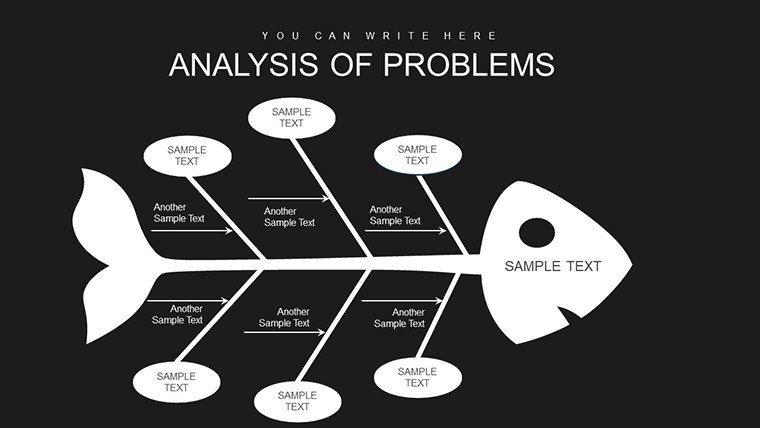
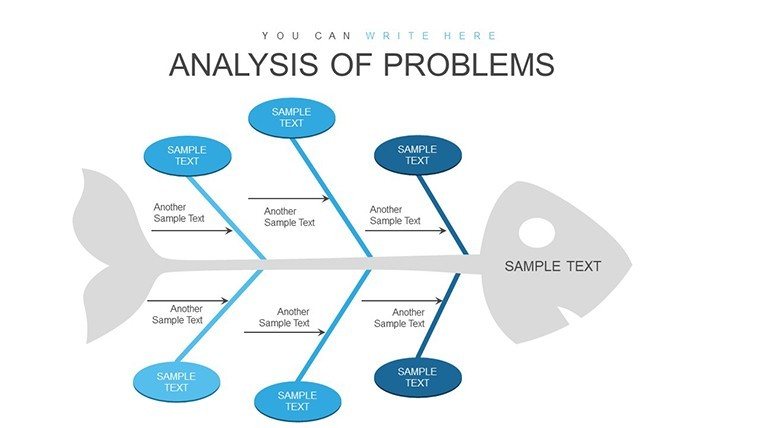
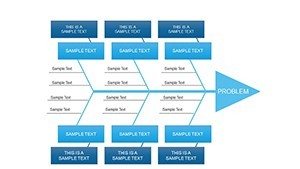
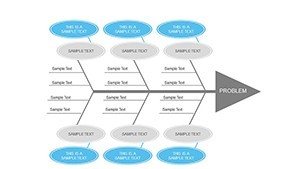
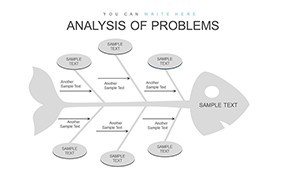
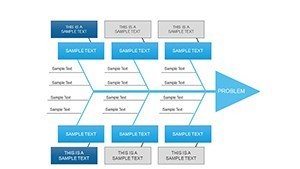
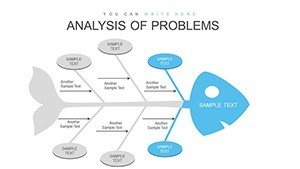
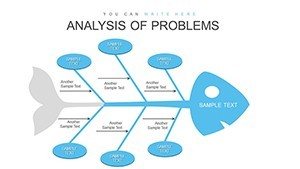
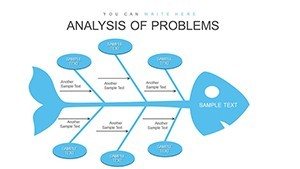
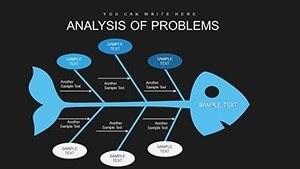
Think of a data analyst revealing workflow inefficiencies via animated flowcharts, or a consultant using matrix grids to prioritize risks in client audits. Compatible with PowerPoint and exportable to other formats, it features captivating animations that unfold data layers, keeping stakeholders engaged. Rooted in problem-solving frameworks like Ishikawa diagrams (fishbone), this template streamlines analysis, cutting through noise to reveal opportunities. It's your ally in turning hurdles into breakthroughs, with designs that adapt to your narrative for presentations that persuade and perform.
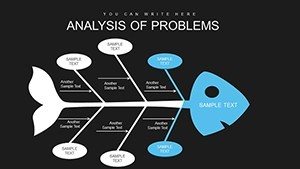
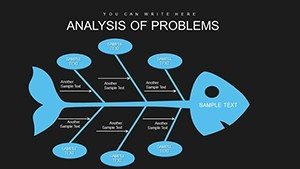
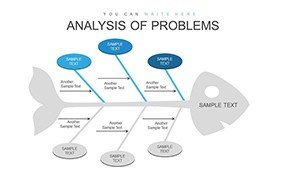
Essential Features for In-Depth Analysis
This template's strength lies in its blend of analytical tools and aesthetic appeal. Charts range from cause-effect trees to priority matrices, each fully modifiable to suit your dataset. Animations add dynamism, revealing elements step-by-step for controlled storytelling.
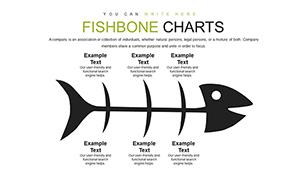
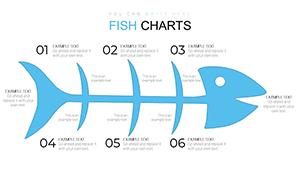
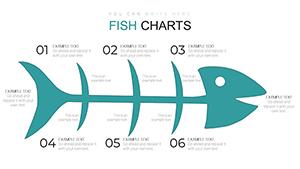
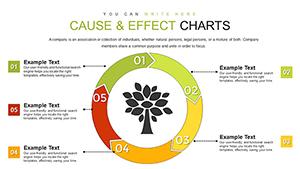
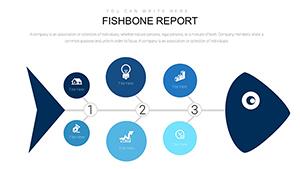
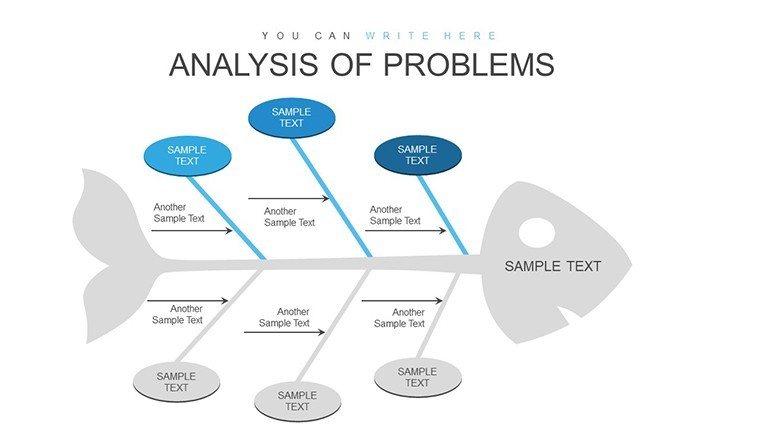
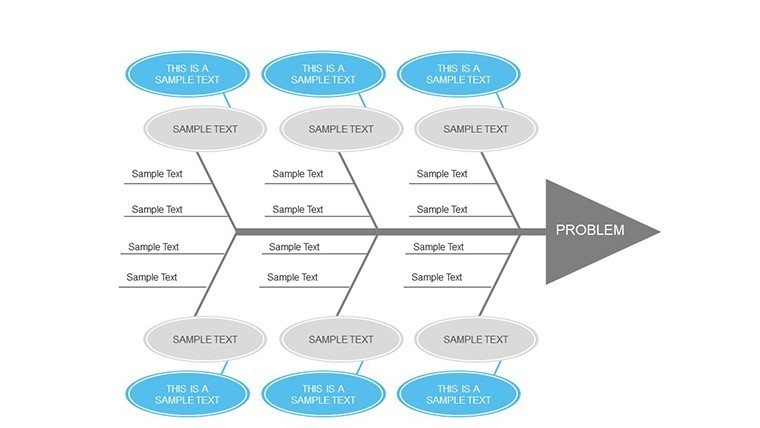
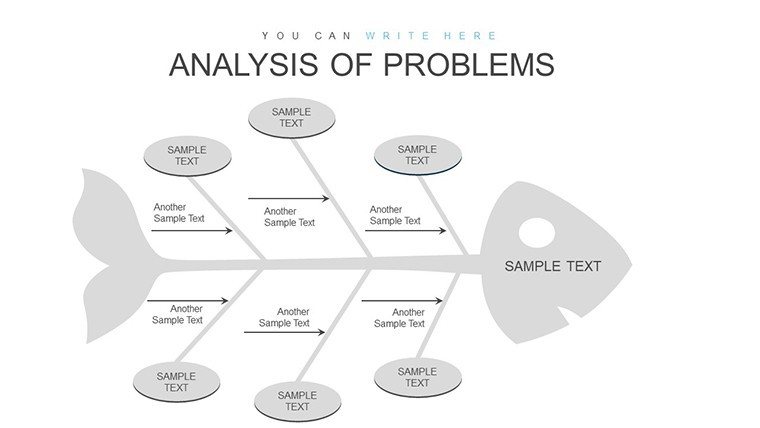
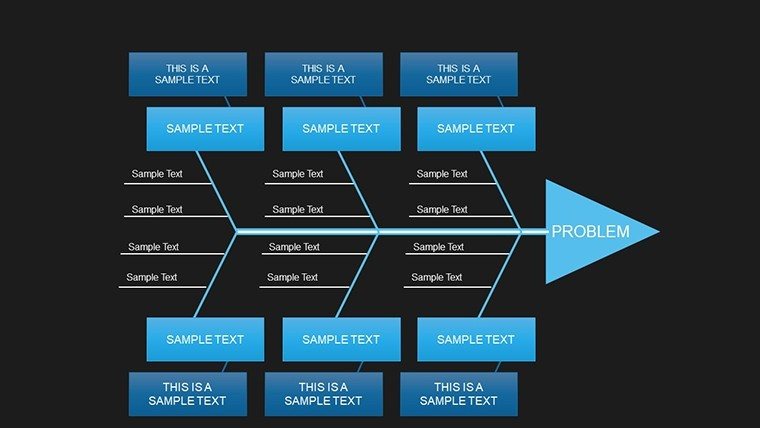
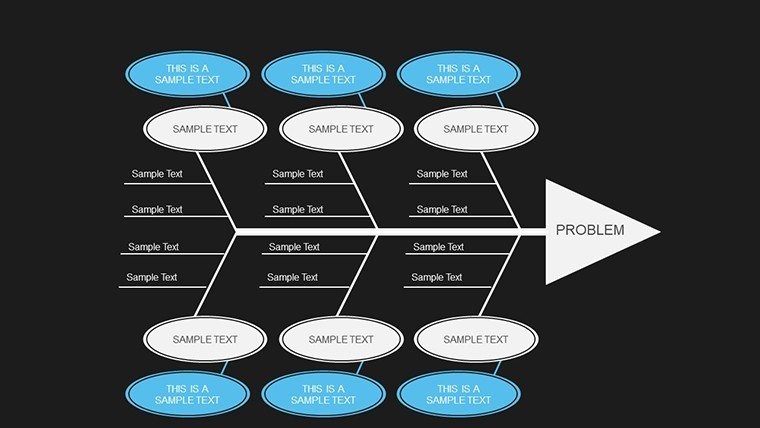
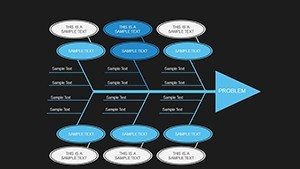
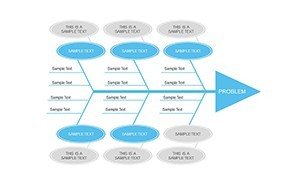
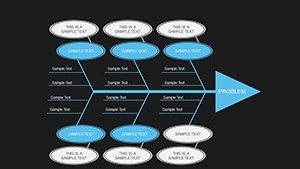
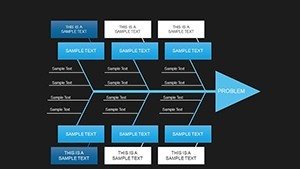
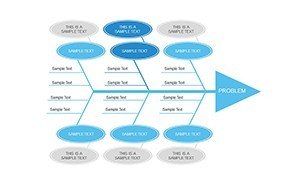
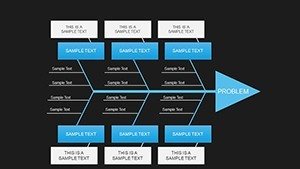
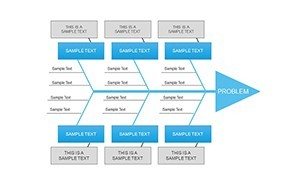
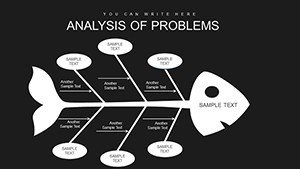
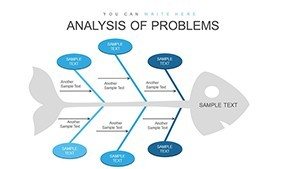
- Fishbone Diagrams: Break down root causes, like in quality control scenarios.
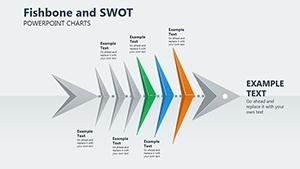
- SWOT Matrices: Assess strengths, weaknesses, opportunities, threats with grid layouts.
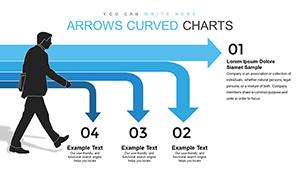
- Flowcharts: Map processes, identifying pain points in operations.
- Priority Charts: Use Pareto principles to focus on high-impact issues.
- Timeline Analyses: Track problem evolution over time for historical context.
Inspired by lean methodologies from the Project Management Institute (PMI), these ensure rigorous, evidence-based explorations.
Comprehensive Slide Overview
Opening slides set the stage: Slide 1 is a dashboard for problem overviews, combining icons and summaries. Slides 2-6 focus on fishbone structures, with branches for categories like people, processes, and tech - animate to build suspense.
Central sections, Slides 10-15, offer SWOT and matrix tools, with draggable quadrants for interactive sessions. Later, Slides 20-25 integrate flow and Pareto charts, complete with data bars that adjust via inputs. Closing slides provide resolution frameworks, like action plans with Gantt-like elements, ensuring your presentation ends on a proactive note.
Practical Applications and Core Benefits
Apply it where problems persist. For project managers, flowchart slides expose delays in agile sprints, as in PMI case studies where visuals halved resolution times. Business consultants use priority charts in turnaround strategies, quantifying issues for client alignment.
Data analysts leverage timelines to correlate events, uncovering patterns in metrics. Advantages over basic tools: Built-in animations prevent monotony, customizable themes maintain brand integrity, and intuitive edits democratize analysis. Ultimately, it promotes collaborative problem-solving, with visuals that facilitate discussions and consensus.
- Identify the Issue: Use overview slides to frame the problem with key data.
- Dissect Causes: Populate fishbones or matrices; tip: involve teams for diverse inputs.
- Animate Insights: Sequence reveals to guide audience through logic.
- Propose Fixes: End with action-oriented charts for clear next steps.
Sync with apps like Visio for imports, or use in virtual meetings via Zoom. Real users cite improved stakeholder buy-in, echoing findings from management journals.
Strategic Tips for Optimal Results
Incorporate 5 Whys technique within fishbones for deeper dives. Ensure inclusivity with alt texts and voice-over compatibility. A consultant example: Deploying these charts in a manufacturing audit identified inefficiencies, leading to 20% cost savings, as per industry benchmarks.
Beyond slides, this template is a framework for resilience. Ready to analyze and advance?
Take control - download this Analysis of Problems PowerPoint Charts Template and chart your way to success.
Frequently Asked Questions
What types of charts are best for root cause analysis?
Fishbone and Pareto charts, included for detailed breakdowns.
Are animations customizable?
Yes, adjust timings and effects to fit your pacing.
Ideal for which professionals?
Project managers, consultants, and data analysts seeking structured insights.
Any ongoing support?
24/7 team assistance, plus free feature updates.
Can it handle complex data?
Absolutely, with scalable designs and data linking options.